
‘Poor tropical regions’ suffer greatest economic damage from worsening heatwaves
Ayesha Tandon
10.28.22Ayesha Tandon
28.10.2022 | 7:00pm“Poor tropical regions” – which contribute the least to global greenhouse gas emissions – saw the greatest economic damage from worsening heatwaves over 1992-2013, new research finds.
Extreme temperatures can suppress a country’s economic growth by decimating crops and limiting workers’ productivity. The study, published in Science Advances, finds that the global economy suffered trillions of dollars of economic damage over 1992–2013, as a result of heatwaves made more intense and frequent by climate change.
Extreme heat has already suppressed per-person gross domestic product (GDP) in tropical countries, such as Brazil, Venezuela and Mali, by more than 5% per year, according to the paper. In contrast, high-latitude nations, such as Canada and Finland, have seen only a 1% per year GDP reduction.
The findings “reinforce the conclusions of previous studies that the adverse effects of climate change are largest in some of the countries that have the lowest historical contributions to the greenhouse gas emissions”, says a scientist not involved in the paper.
“The economic toll of climate change is here…it is occurring now,” the lead author of the study tells Carbon Brief. He adds that while poorer, tropical nations have seen the most severe economic damage, “human-caused intensification of extreme heat” has caused damage to “essentially all economies”.
Extreme heat
Extreme heat can severely impact people and ecosystems across the planet. During the “record-shattering” Pacific north-west heatwave of 2021, hospital admissions spiked as people struggled with heat stress – a dangerous build-up of body heat.
The following summer, intense heat across India cut crop yields by 10-35% in some regions, driving to soaring food prices and widespread food insecurity.
This year’s Lancet Countdown report on climate change finds that around 470bn hours of labour were lost in 2021 due to heat exposure, resulting in $669bn of reduced income. It adds that 100 million more people experienced moderate-to-severe food insecurity as a result of heatwaves in 2020 than in previous decades.
Labour and crops are the two “most obvious” impacts of extreme heat on people, Christopher Callahan – a PhD student at Dartmouth College and lead author of the study – tells Carbon Brief. However, he adds that heatwaves can also have subtler impacts – including damage to mental health.
The study compares observed data on temperature over 1992-2013 with data on economic growth to find a statistical relationship between the two. The map below shows how a temperature increase of one standard deviation – a measure of how far an event strays from the average conditions for the region – impacts economic growth. The study defines “regions” as “subnational administrative levels” – states in the US, for example.
Red shading indicates areas where a one-standard-deviation rise in regional temperature suppresses economic growth, while blue means it encourages growth. The darker the shading, the bigger the impact. Hatching indicates that subnational economic data was unavailable, and so data was extrapolated from elsewhere.
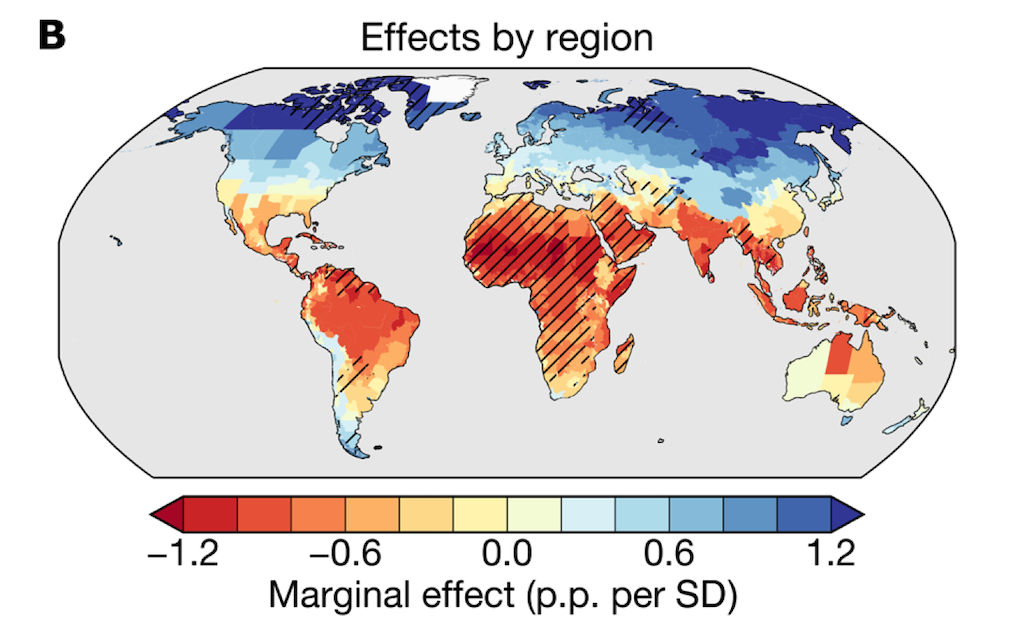
The map shows that a single-standard-deviation increase in temperature negatively impacts almost all regions in the southern hemisphere, while regions in the northern hemisphere generally see greater economic growth. This aligns with past work that suggests around 14C is an “optimal” absolute average for economic success, the study says.
For example, in Brazil – where the average temperature is 23.8C – the authors find that the increase in temperature suppresses growth by 0.63 percentage points. Meanwhile, Norway has an average temperature of 4C, and sees 0.62 percentage points of growth from a single standard deviation rise in temperature.
However, Callahan stresses that it is “misleading” to conclude that climate change is therefore beneficial for countries in the northern hemisphere – in part, because the global economy is interconnected. He explains:
“While an increase in temperature theoretically could benefit high latitude and wealthy regions, the actual effect of human-caused intensification of extreme heat has been to damage essentially all economies.”
The authors also explore how quickly countries can recover from a heatwave. They find that while individual heat extremes do not permanently impact economic growth, repeated extremes may result in “tangible long-term income changes”.
Economic damage
As the planet warms, heatwaves are becoming more long-lasting, frequent and intense. There are many ways of measuring heatwaves, which are defined as an extended period of hot weather relative to the expected conditions at that time of year for that area.
The authors of this study focus on the hottest five-day period (Tx5d) in each year over 1992-2013, for a global sample of subnational regions. They then run climate models from the sixth Coupled Model Intercomparison Project (CMIP6) to determine Tx5d for each year in a world without climate change. Comparing the two values shows how Tx5d has changed as a result of human-caused warming.
The left-hand map below shows how much more intense Tx5d temperature is in today’s climate as a result of global warming. The map on the right shows increases in the likelihood of extreme heat as a result of climate change. Darker reds indicate areas with the largest increases.
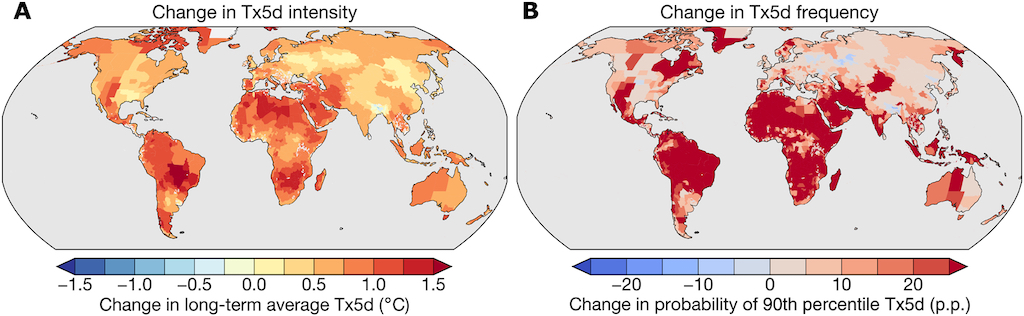
The authors find that, globally, Tx5d values have become 0.77C higher on average over 1992-2013 as a result of warming. For tropical countries, this increase is around 1C, they add, while for the US it is less than 0.5C.
The authors then assess how much economic damage the hotter heatwaves has caused. The maps below show the percentage (left) and absolute (right) changes in per-capita GDP from the human-caused increase in extreme heat over 1992-2013. Darker reds indicate greater damages.
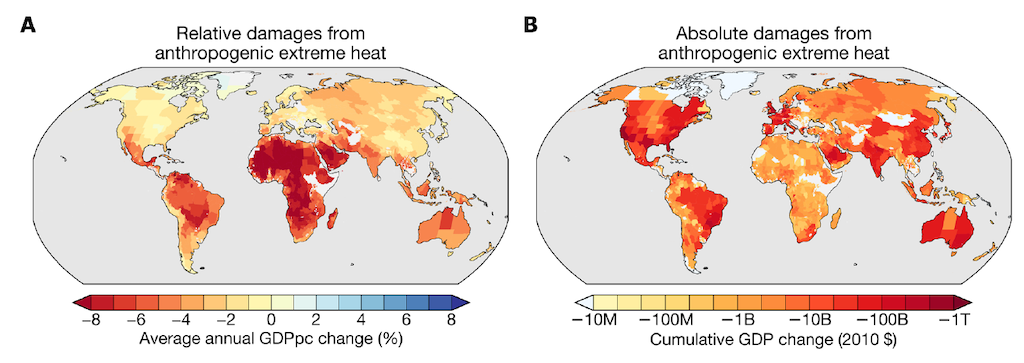
Global economic losses due to worsening heatwaves “likely” fall between $5tn and $29tn over 1992-2013, the authors find. This range is large because there are many steps to the analysis, each of which has uncertainties, Callahan tells Carbon Brief.
However, this damage is spread unequally across the planet. Regions in the lowest 10% of incomes experienced average losses of 6.7% of GDP per person per year over 1992-2013, the study says, compared to losses of only 1.5% for regions in the top 10% of incomes.
For example, Brazil, Venezuela and Mali have seen at least a 5% reduction in GDP per year as a result of worsening heatwaves, while Canada and Finland have only seen a depression of only 1% per year.
Until recently, research around the economic impact of climate change has been “largely based on averages”, says Dr Leonie Wenz – the deputy head of the “complexity science” research department at Potsdam Institute for Climate Impact Research.
Wenz, who was not involved in the study, tells Carbon Brief that averages “can mask the full effects of local and temporary events [and] do not fully reflect how we as humans experience temperature”. She praises the contribution that this study makes to the field by focusing on extremes.
Inequality
The fact that historical responsibility for climate change lies with wealthy and powerful people – and yet it disproportionately impacts the poorest and most vulnerable – is core to the climate justice movement.
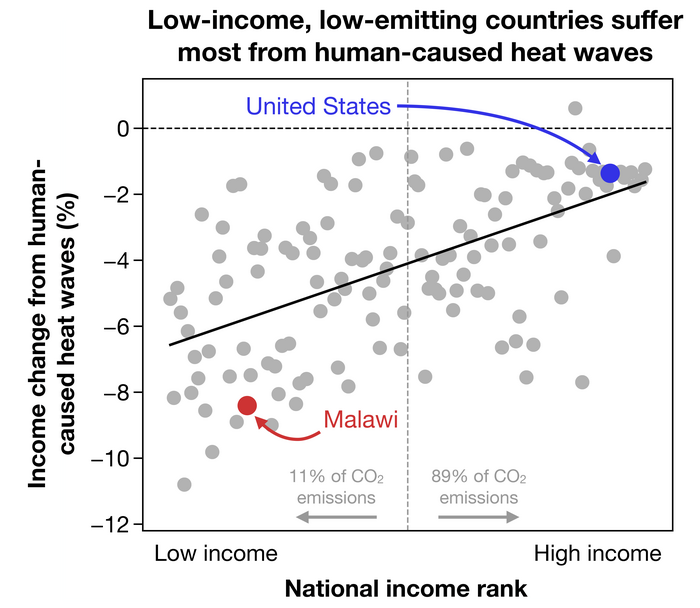
The plot below compares income with the change in income caused by human-caused increases in heatwaves for a spread of counties. It shows that low-income countries (on the left) see more severe economic damage than high-income countries (on the right) as a result of heatwaves.
The plot highlights the examples of the US (blue) and Malawi (red) – the latter being one of the poorest countries in the world. The dotted line down the centre of the plot also shows that the poorest countries are responsible for only around 11% of CO2 emissions. In contrast, the highest income countries, which see the least-severe economic damage, are responsible for 89% of emissions.
The work is “highly relevant”, according to Dr Erich Fischer – a senior scientist and lecturer at ETH Zurich, who was not involved in the study, but has previously published work on the “unprecedented” climate that tropical regions could face in the future. He says:
“[The findings] reinforce the conclusions of previous studies that the adverse effects of climate change are largest in some of the countries that have the lowest historical contributions to the historical greenhouse gas emissions.”
He also notes that the economic impact of heatwaves could be more severe than the study suggests as the impacts of extreme heat “can be substantially amplified by humidity – and these effects are largest in parts of the global south”.
Dr Luke Harrington – a senior lecturer at the University of Waikato in New Zealand, who was also not involved in the study – has published work on the impacts and drivers of extreme heat, often focusing on the dangers for poorer regions. He also highlights the findings on inequality:
“Because lower-latitude countries also tend to be lower-income countries, this pattern exacerbates existing socioeconomic inequalities, with the largest impacts borne by those who have contributed least to a changing climate.”
The authors note that low-income, tropical regions often have limited availability of data on climate extremes. Fischer tells Carbon Brief that the authors “carefully acknowledge” the “substantial data limitations both for climate data as well as for economic data in the global south”. Nonetheless, he adds, they “represent a substantial caveat” to the findings.
Dr Izidine Pinto, a climate scientist at the University of Cape Town, who was not involved in the study, expresses “concern” about this lack of data, saying that “it makes it difficult to reach conclusions about global inequalities”.
Callahan discussed the lack of data in the global south with Carbon Brief, noting that higher income countries tend to have better quality data, while “people tend to be the most vulnerable” in places with limited data.
He explains that there is a risk of skewing the result towards the regions with good data – an exercise he likens to “looking for your keys under the lamppost”. He wanted to avoid this trap in his paper, he says.
The data extrapolation method used in this study for regions with limited data “comes with uncertainties”, Callahan notes. But, he says, it is still “important” to do it in order to “fully capture the globally unequal nature of the effects we find”.


Callahan and Mankin (2022) Globally unequal effect of extreme heat on economic growth, Science Advances, doi:10.1126/sciadv.add3726
-
‘Poor tropical regions’ suffer greatest economic damage from worsening heatwaves