Renewables growth breaks records again despite fall in investment
Jocelyn Timperley
04.06.17Jocelyn Timperley
06.04.2017 | 2:16pmFalling costs allowed the world to add record new renewable capacity even as investment fell, according to a new report.
The findings, from the UN Environment Programme (UNEP) and Bloomberg New Energy Finance (BNEF), show 139 gigawatts (GW) of renewable capacity was built in 2016.
This was an 8% increase on the year before, largely driven by the steeply falling costs of renewables, even while investment fell by 23%.
The report mirrors the findings of new statistics released by the International Renewable Energy Agency (IRENA) last week, which also showed 2016 was the strongest year ever for new renewable energy capacity additions.
From the ongoing solar boom to a doubling in green bond issuance, Carbon Brief runs through some of the key findings of the two reports.
Record new capacity
The additional 138 GW of new renewable power capacity built last year represents an increase of 10 GW from the 128 GW *added in 2015.
This extra capacity – which includes wind, solar, biomass and waste-to-energy, geothermal, small hydro and marine sources but excludes large hydro – is roughly equal to total installed electricity capacity of Canada.
A similar estimate from IRENA puts added global renewable energy capacity at 161 GW in 2016, including all hydro. 2016’s additions grew the world’s total renewable energy capacity by 8.7%, IRENA said, bringing it to 2,006 GW.
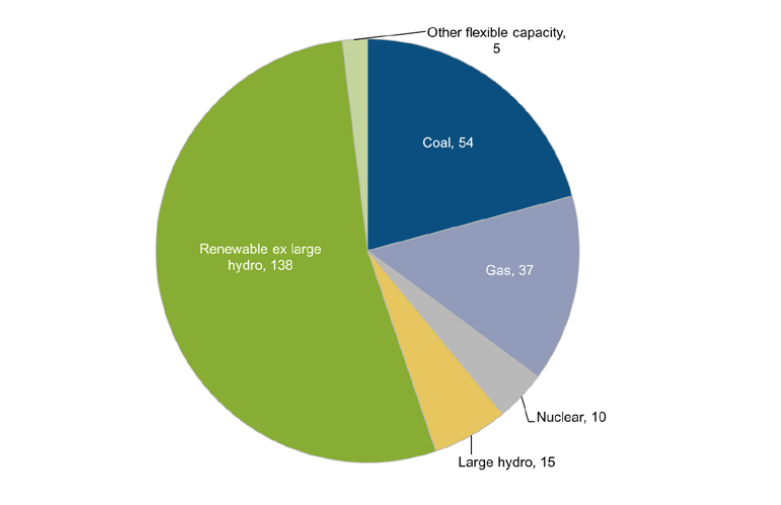
Net power generating capacity added in 2016 by various technologies, GW. Source: Bloomberg New Energy Finance/UNEP Global Trends in Renewable Energy Investment 2017.
Bigger renewables share
This record addition of new renewables capacity accounted for 55% of all new electricity generation capacity of any kind created in 2016: the highest proportion for renewables to date.
It means renewables now account for almost 17% of global power capacity, up from 15% last year.
![]()
It also boosted the overall proportion of global electricity coming from renewable sources from 10.3% in 2015 to 11.3% in 2016. (Note this figure does not include large hydro, which now makes up 13-14% of global electricity generation, BNEF says.)
It’s worth pointing out that the reason the proportion of electricity generated from renewables generation is lower than its capacity share is because renewables generally have lower load factors than conventional power sources such as coal, gas and nuclear.
Despite the record additions, though, the renewable share of generation still only inched forwards by 1 percentage point. This is a far slower pace than what will be needed to keep global temperatures well under 2C as set out in the Paris Agreement. A recent analysis by the International Energy Agency (IEA) of how to achieve this said wind and solar would, together, need to become the largest source of electricity by 2030.
Still, all renewables excluding large hydro together prevented the emission of an estimated 1.7bn tonnes of CO2 last year, UNEP says. For comparison, total CO2 emissions in 2016 are estimated to be 39.9bn tonnes. Therefore, global emissions would have been around 4% higher without renewables.
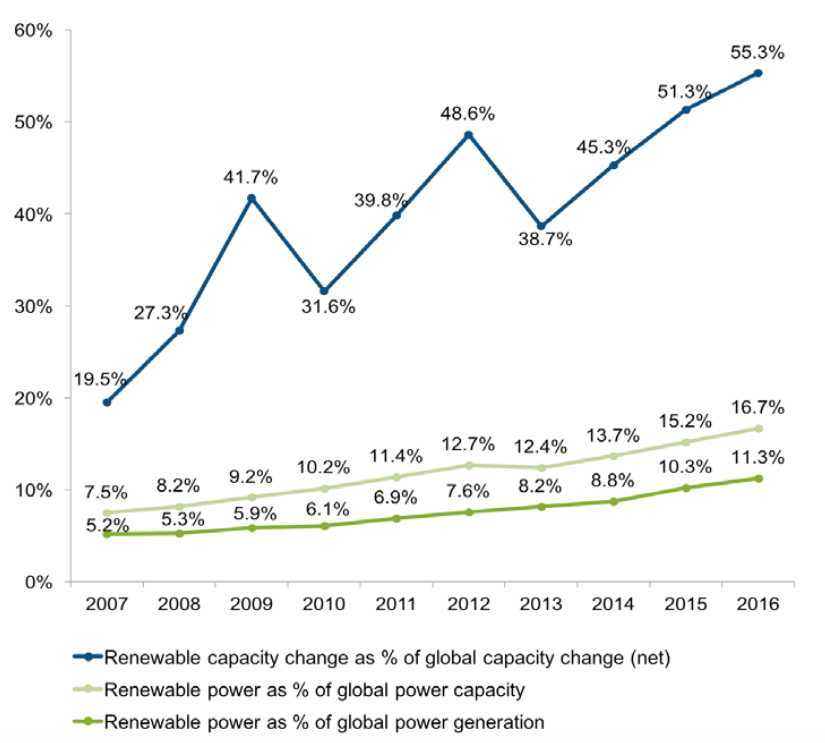
Renewable power generation and capacity as a share of global power, 2007-2016, %. Renewable shares exclude large hydro. Source: Bloomberg New Energy Finance/UNEP Global Trends in Renewable Energy Investment 2017.
“More for less”
Significantly, the record rise in renewable capacity came despite an overall fall in investment compared to the previous year.
The world invested $242bn in 2016 (excluding large hydro): 23% less than 2015 and the lowest since 2013. Around $23bn was invested in large hydro, down 48%.
The fall in investment was in large part due to falling costs, UNEP said, with the average per megawatt cost of solar photovoltaics and wind dropping by more than 10% compared to 2015.
Another positive sign came in winning bids for solar and wind in auctions around the world at tariffs that would have seemed inconceivably low a few years ago, UNEP adds.
The records set last year were $29 per megawatt hour for solar in Chile and $30 per megawatt hour for onshore wind in Morocco.
Michael Liebreich, chairman of the advisory board at UNEP, says in the report:
“It’s a whole new world: even though investment is down, annual installations are still up; instead of having to subsidise renewables, now authorities may have to subsidise natural gas plants to help them provide grid reliability.”
Investment still falls far short of what it needed to stay in line with the Paris Agreement however. In its recent report, the IEA said yearly investment in the energy sector would need to hit an average of $3.5tn per year up to 2050 to keep global temperatures well below 2C. Total investment in renewables including hydro in 2016 was less than 8% of this figure.
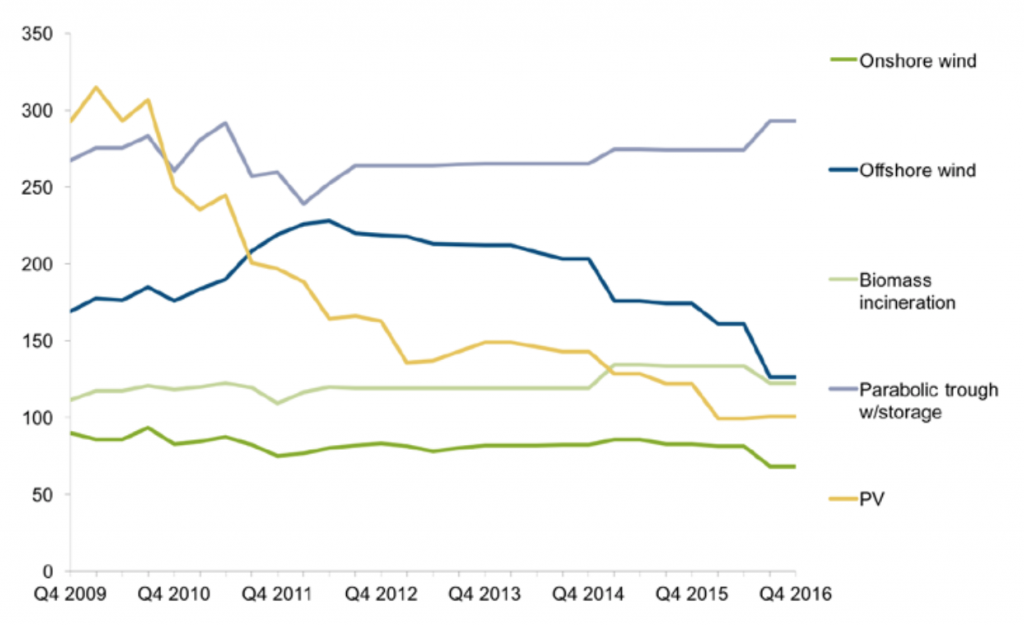
Levelised cost of electricity from selected renewable energy sources, in $ per mwh. Solar thermal is parabolic trough with storage. Source: Bloomberg New Energy Finance/UNEP Global Trends in Renewable Energy Investment 2017.
Financing slowdown
The lower cost of renewables was not the only reason investment fell last year, however.
UNEP also documents a slowdown in activity in key markets China and Japan, as well as in some emerging markets.
Investment in renewables did not drop across the board, however. Europe’s investment rose 3% to $60bn, although this was the only region to see a rise.
Europe’s investment owed its resilience to record commitments to offshore wind, totalling $26bn, up 53% from 2015, says UNEP.
This was driven by large growth in investment from Norway, Sweden, Denmark and Belgium. However, investment in the UK and Germany – Europe’s biggest investors by far – slipped by 1% and 14% respectively.
Meanwhile, it’s important to note that investment in renewables capacity was still roughly double that of fossil fuel generation.
New renewables investment in different regions from 2004 to 2016. Source: Bloomberg New Energy Finance/UNEP Global Trends in Renewable Energy Investment 2017. Chart by Carbon Brief, using Highcharts.China fallback
The fall in investment in China is perhaps the most striking.
Last year’s UNEP report showed that the majority of renewable energy investment was, for the first time, in developing nations. But this trend reversed in 2016, with a steeper fall in investment in developing nations, meaning richer countries regained their lead in renewables investment.
This was largely driven by a $37bn drop in investment in China to $78bn – a fall of almost a third. Investment in India and Brazil stayed fairly steady at $9.7bn and $6.8bn, respectively.
Even so, Asia still accounted for 58% of new renewable capacity added in 2016, according to IRENA, reflecting the fall in per megawatt costs. Asia has a total of 812 GW renewables capacity – 41% of the global total.
Meanwhile, Africa installed 4.1 GW of new capacity in 2016, twice as much as in 2015.
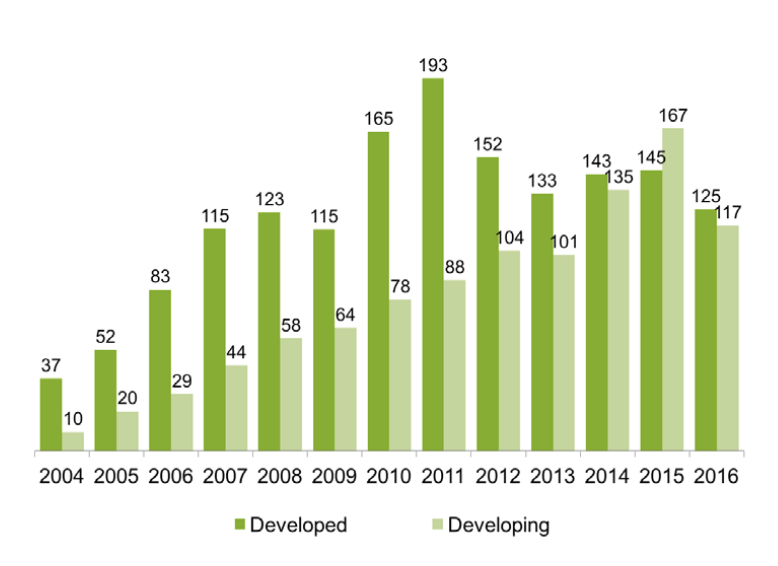
Global new investment in renewable energy: developed v developing countries, 2004-2016, $bn. Source: Bloomberg New Energy Finance/UNEP Global Trends in Renewable Energy Investment 2017.
Solar surge
Different renewables also fared variably under 2016’s fall in investment.
New investment in solar in 2016 totalled $114bn. While this was 34% lower than the record high in 2015, this didn’t stop a record 75 GW of solar added – a sharp rise from the 56 GW added in 2015.
This boost meant more new solar capacity was added than of any other technology for the first time.
For example, India saw the construction of the 648 MW Ramanathapuram solar complex in Tamil Nadu – the world’s largest ever PV project.
IRENA put the amount of new solar capacity slightly lower at 71 GW, though also notes this was the first year since 2013 that solar growth outpaced wind energy, which it says increased by 51 GW.
Almost half of all solar capacity growth was in China, which installed 34 GW, while the US, Japan and India all had significant increases in capacity, with 11 GW, 8 GW and 4 GW installed respectively, IRENA says.
Solar capacity in Europe expanded by 5 GW to reach 104 GW, with most growth in Germany and the UK.
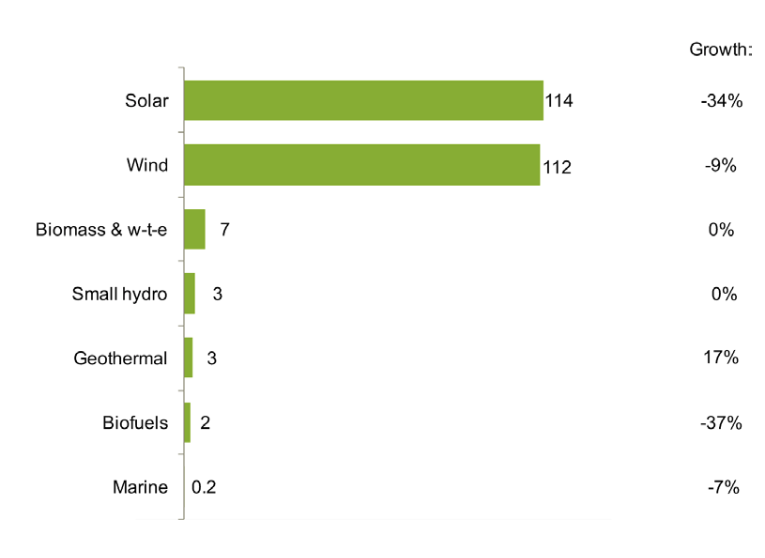
Renewable energy asset finance and small distributed capacity investment by sector, 2016, and growth on 2015, $bn. Source: Bloomberg New Energy Finance/UNEP Global Trends in Renewable Energy Investment 2017.
Wind setbacks
The effect of falling investment on wind power differed from the solar story, however.
Global investment of $113bn in wind, while significant, fell 9% on the previous year, says UNEP, and overall wind capacity additions in 2016 fell to 54 GW from their 63 GW high the year before.
There was still an “unprecedented” surge in financings for offshore wind projects, UNEP says, despite the much higher capital costs per MW than onshore wind farms. Investment decisions in offshore wind totalled $30bn, up 41% from the previous year.
Europe’s renewables investment was dominated by offshore wind, a 53 per cent increase to $26bn thanks to the development of several mega-arrays, such as the 1.2 GW Hornsea offshore wind project in the UK North Sea, estimated to cost almost $6bn. China also invested $4bn, its highest figure to date.
IRENA adds that almost three-quarters of new wind energy capacity was installed last year in just four countries: China, the US, Germany and India.
Other renewable energy sectors had “mixed fortunes” in terms of investment last year, UNEP adds. Biofuels investment fell by over a third to its lowest for at least 13 years, and marine investment also fell slightly. Biomass and waste stayed at a similar level to 2015, as did small hydro, while geothermal investment increased by a sixth.
Global new investment in different renewables sectors from 2004 to 2016. Source: Bloomberg New Energy Finance/UNEP Global Trends in Renewable Energy Investment 2017. Chart by Carbon Brief, using Highcharts.Green bonds boom
One eye catching figure from the UNEP report is the huge rise in 2016 of green bonds.
Green bonds are debt investment offers launched by banks or companies with the promise that proceeds will go entirely into clean energy and other environmentally-friendly projects.
Global issuance leaped to $95.1bn, almost double the $47.9bn issued in 2015. China in particular saw a huge leap in issuance to $27.1 bn, overtaking the US’s $15.5 bn.
It’s worth noting that green bonds cover a wider scope than renewable energy investment alone. For example, the raising of debt for water, waste management and even climate change adaptation projects can all be labelled as green bonds.
In addition, 2016 was a record year for renewables acquisition deals – such as refinancings and buying of renewable energy plants – which hit $110bn. This is a sign that ‘new renewables’ are becoming ever more mainstream, according to UNEP.
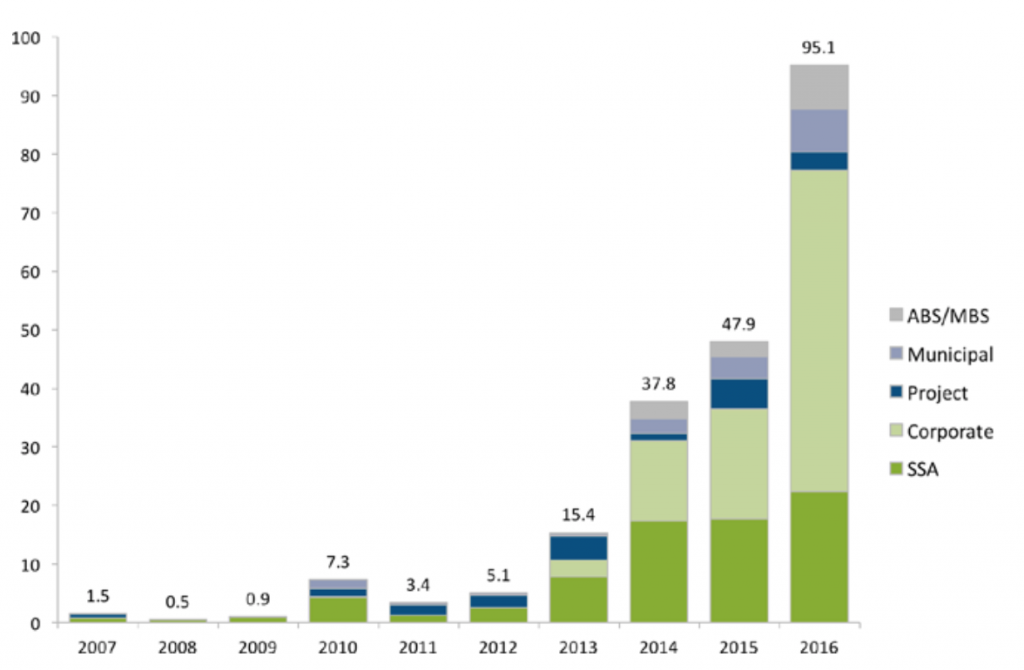
Total green bond issuance by category, 2007 to 2016, $bn. SSA stands for supranational, sovereign and agency; ABS stands for asset-backed securities; MBS stands for mortgage-backed securities. Source: Bloomberg New Energy Finance/UNEP Global Trends in Renewable Energy Investment 2017.
*Note that UNEP previously estimated 134 GW were added in 2015, however it has now revised this down