
State of the climate: 2017 shaping up to be warmest ‘non-El Niño’ year
Zeke Hausfather
11.09.17Zeke Hausfather
09.11.2017 | 4:34pmThe year 2017 has seen some of the warmest temperatures ever recorded, only slightly below the record set in 2016. It has also seen unusually low Arctic and Antarctic sea ice for much of the year, though the summer Arctic minimum was only the eighth lowest on record.
2017 is also almost certain to be the warmest year without an El Niño event. When the effects of El Niño and La Niña are removed from the temperature record, the first nine months of 2017 are likely the warmest ever recorded.
Near-record warm temperatures
Ten months in, 2017 is very likely going to be either the second warmest or third warmest year on record, depending on the temperature series used. While there was some speculation earlier in the year that it could challenge 2016 for first place, colder temperatures in the period from June through September have largely eliminated any chance of a new record.
Carbon Brief has examined global temperature data from eight different climate centres around the world, both for the Earth’s surface and the lower troposphere (TLT). Temperatures for the full year of 2017 were estimated using the data available to-date for each dataset, along with projection of the El Niño Index for the remainder of 2017 (see methods at the end of the article for technical details).
The results are shown in the figure below. Annual temperatures from 1979 through 2016 are shown in black for each record, while the likely (95% confidence interval) range of the 2017 annual temperature is shown by the red bar.
The last two records shown, RSS and UAH, come from satellite data and are measuring the atmosphere on average around 5 km up from the surface. While these have similarities to surface temperatures, they are not expected to always respond in the same way to El Niño or other factors.
Annual global mean surface temperatures and 2017 estimates from NASA GISTemp, NOAA GlobalTemp, Hadley/UEA HadCRUT4, Berkeley Earth, Cowtan and Way, Copernicus/ERA-Interim, RSS TLTv4, and UAH TLTv6. Anomalies plotted with respect to a 1979-2000 baseline. See methods at the end for details. Chart by Carbon Brief using Highcharts.In nearly all cases, 2017 will be in the top three warmest years. Even in UAH, 2017 is more likely than not to be the third warmest year on record. Four groups – NASA, Berkeley Earth, Copernicus, and RSS – estimate that 2017 will most likely be the second warmest year on record, while the four other groups – Hadley/UEA, NOAA, Cowtan and Way, and UAH – suggest it will be the third warmest.
The probability that 2017 will be the warmest, second warmest, third, or fourth warmest year in each record is shown in the table below.
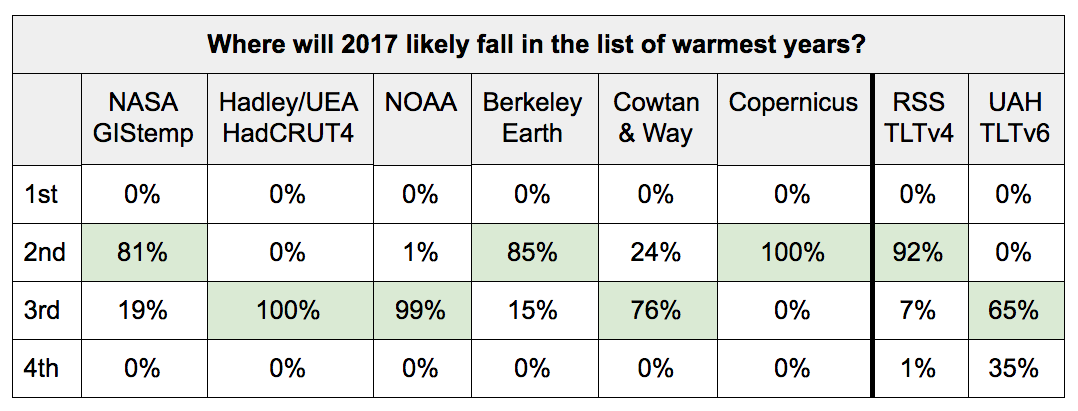
Estimated probabilities of 2017’s temperature rank for each dataset, with the most likely outcome highlighted in green. Note that this does not include measurement uncertainty for the records, just the likely best estimate for each group. See methods at end for details.
When the outcome for a group is estimated at 100% or near 100% sure, it means that there are no prior years where changes in the remaining few months of the year would result in any other outcome. In practice, a major volcanic eruption in the last few months of the year or some other factor not found in the historical record since 1979 could change the odds. These are also estimates of the published operational value for each group, and don’t include factors like measurement uncertainty.
There is effectively zero chance that the temperature reported by any group will show that 2017 was the warmest year on record. Similarly, outside the UAH group there is little chance that 2017 will be below the third warmest year..
Neutral El Niño conditions
El Niño and La Niña events – jointly referred to as El Niño Southern Oscillation, or ENSO – are changes in ocean temperatures in the equatorial Pacific driven by natural variability that occur on a 5 to 7 year cycle. During an El Niño warm surface waters drive up overall global temperatures, while during a La Niña they cool. Years in between, referred to as “neutral” ENSO years, have no major effects on temperatures.
Following the “super” El Niño event of 2015-16, 2017 has seen largely neutral conditions in the Pacific, though recent predictions suggest a La Niña event is more likely than not to develop over the turn of the year.
While 2017 started out unusually warm – especially for a year without major El Niño event – it has cooled off notably in recent months. The figure below shows monthly temperature estimates from 2012 through to today from each of the groups reporting global surface temperatures.
Monthly global mean surface temperatures from NASA GISTemp, NOAA GlobalTemp, Hadley/UEA HadCRUT4, Berkeley Earth, Cowtan and Way, and Copernicus/ERA-Interim. Only Copernicus has October 2017 values available at time of posting. Anomalies plotted with respect to a 1979-2000 baseline. Chart by Carbon Brief using Highcharts.The 2015-16 El Niño event is clearly visible in the temperature record, as well as the drop in late 2016 as the El Niño faded. The second “bump” visible for the first four months of 2017 is a bit more unusual, as it occurred during a period when the El Niño Southern Oscillation (ENSO) was neutral or somewhat negative. It may have been driven by record warmth over Siberia and Arctic regions during those months.
October surface temperatures have only been reported by the Copernicus reanalysis project so far, but show a sizable tick up of around 0.1C compared to September. A similar rise is expected in the other surface records, particularly those like NASA, Berkeley Earth, and Cowtan and Way that include near-global temperature estimates.
Because El Niño and La Niña events have a large impact on short-term temperature variations, it means that we wouldn’t necessarily expect each year to set a new temperature record in a warming world. That said, 2017 will almost certainly be the warmest year on record with neutral El Niño conditions.
To assess the effects of El Niño on the surface temperature record, Carbon Brief produced an estimate of what temperatures would be in the absence of El Niño and La Niña events. The figure below shows both the actual temperatures (top panel) and estimated temperatures with El Niño removed (bottom panel). In both cases 2017 values to-date are shown at the end. The Copernicus records is not included in the figure, as it does not have data available prior to 1979.
Global mean surface temperatures from NASA GISTemp, NOAA GlobalTemp, Hadley/UEA HadCRUT4, Berkeley Earth, and Cowtan and Way relative to a 1979-2000 baseline period. 2017 to-date values shown by dots. The influence of El Niño and La Niña is removed using the Foster and Rahmstorf (2011) approach, see methods at the end for details. Chart by Carbon Brief using Highcharts.Across all the datasets shown, 2017 would be the warmest year on record once the effects of El Niño are accounted for. This is consistent with our understanding that underlying warming is a combination of a long-term trend driven by CO2 and other greenhouse gases combined with short-term variability mainly from El Niño and volcanic eruptions.
It also suggests that despite the fact that 2017 will break our three-year streak of record warm years, it in no way indicates a slowing down of the long-term warming trend.
Low sea ice extent in the Arctic, some recovery in the Antarctic
2017 has also been a year of unusually low Arctic and Antarctic sea ice, especially in the early part of the year. The figure below shows both Arctic and Antarctic sea ice in 2017 (solid red and blue lines), the full historical range in the satellite record between 1979 and 2010 (shaded areas), and the record lows (dotted black line).
Arctic and Antarctic daily sea ice extent from the US National Snow and Ice Data Center. The bold lines show daily 2017 values, the shaded area indicates the two standard deviation range in historical values between 1978 and 2010, and the dotted black lines show the record minima for each pole. Chart by Carbon Brief using Highcharts.Despite low Arctic sea ice extent early in the year, scientists did not expect a new record minimum at the end of the summer. The 2017 Arctic sea ice minimum was 4.61m square km, the eighth lowest on record but well above the 2012 minimum of 3.34m square km. Arctic sea ice shows a strong long-term downward trend that can be clearly linked to warmer temperatures.
For Antarctic sea ice, much of 2017 saw record lows, including a record minimum over the winter. Over the past two months, however, it has recovered back to close to normal. There is little indication of a long-term trend in Antarctic sea ice related to warming, and both the low extents and recent recovery this year may be driven by natural variability there.
Methodological note
A statistical multivariate regression model was used to estimate the range of likely 2017 annual temperatures for each group that provides a temperature record. This model examined how well the first nine (or ten) months of the year combined with the ENSO index of the last few months predict overall annual temperatures over the period from 1979 through 2016. The model then uses this fit to predict both the most likely 2017 annual value for each group, as well as the 95% confidence interval. The predicted ENSO values for the last three months of 2017 are taken from the NMME model mean forecast.
The percent likelihood of different year ranks for 2017 is estimated by using the output of the regression model, assuming a normal distribution of results. This allows us to estimate what percent of possible 2017 annual values fall above and below the temperatures of prior years for each group.
Separately, the effect of ENSO was removed from each surface temperature record for each month using an approach adapted from Foster and Rahmstorf (2011). A regression model was used to estimate the impact of ENSO on each group’s temperature series from January 1950 through September 2017, using a three month lagged Kaplan El Niño 3.4 index. This estimated ENSO impact was then subtracted from the temperature series to calculate what the temperature records might look like in the absence of an ENSO signal.