Study links world’s top oil and gas firms to 200 ‘more intense’ heatwaves
Ayesha Tandon
09.10.25Ayesha Tandon
10.09.2025 | 4:00pmGlobal warming linked to the world’s biggest oil and gas companies made all “major” 21st century heatwaves more intense and frequent.
This is according to new research, published in Nature, which uses “extreme event attribution” to assess the impact of climate change on all 21st-century heatwaves that were classified as “major disasters”.
The authors find one-quarter of the 213 heatwaves would have been “virtually impossible” without human-caused global warming.
They add that the effect of climate change on heatwave frequency and intensity is becoming more pronounced as the planet warms.
The study estimates the emissions stemming from the operations and production of more than 100 “carbon majors”, such as ExxonMobil, BP, Saudi Aramco and Shell.
The fossil fuels produced by these companies account for 60% of all human-caused CO2 emissions over 1850-2023, the study says.
The authors find that heatwaves recorded over 2000-23 were made, on average, 1.7C hotter due to climate change, with half of this increase due to the emissions originating from carbon majors.
This study “could be used to support future climate lawsuits and aid diplomatic negotiation”, according to a scientist not involved in the research.
Worsening heatwaves
As the planet warms, heatwaves are becoming more intense and frequent, driving economic losses, ecosystem damage and a rise in heath-related deaths.
The EM-DAT database catalogues all “major disasters” that have been reported since the year 1900 – defined as events that cause at least 10 fatalities, affect at least 100 people, or result in the declaration of state of emergency or a call for international assistance.
Between 2000 and 2023, the database lists more than 200 heatwaves. These are shown on the map below, where darker pink indicates a greater number of heatwaves. Countries with no reported heatwaves are shown in grey.
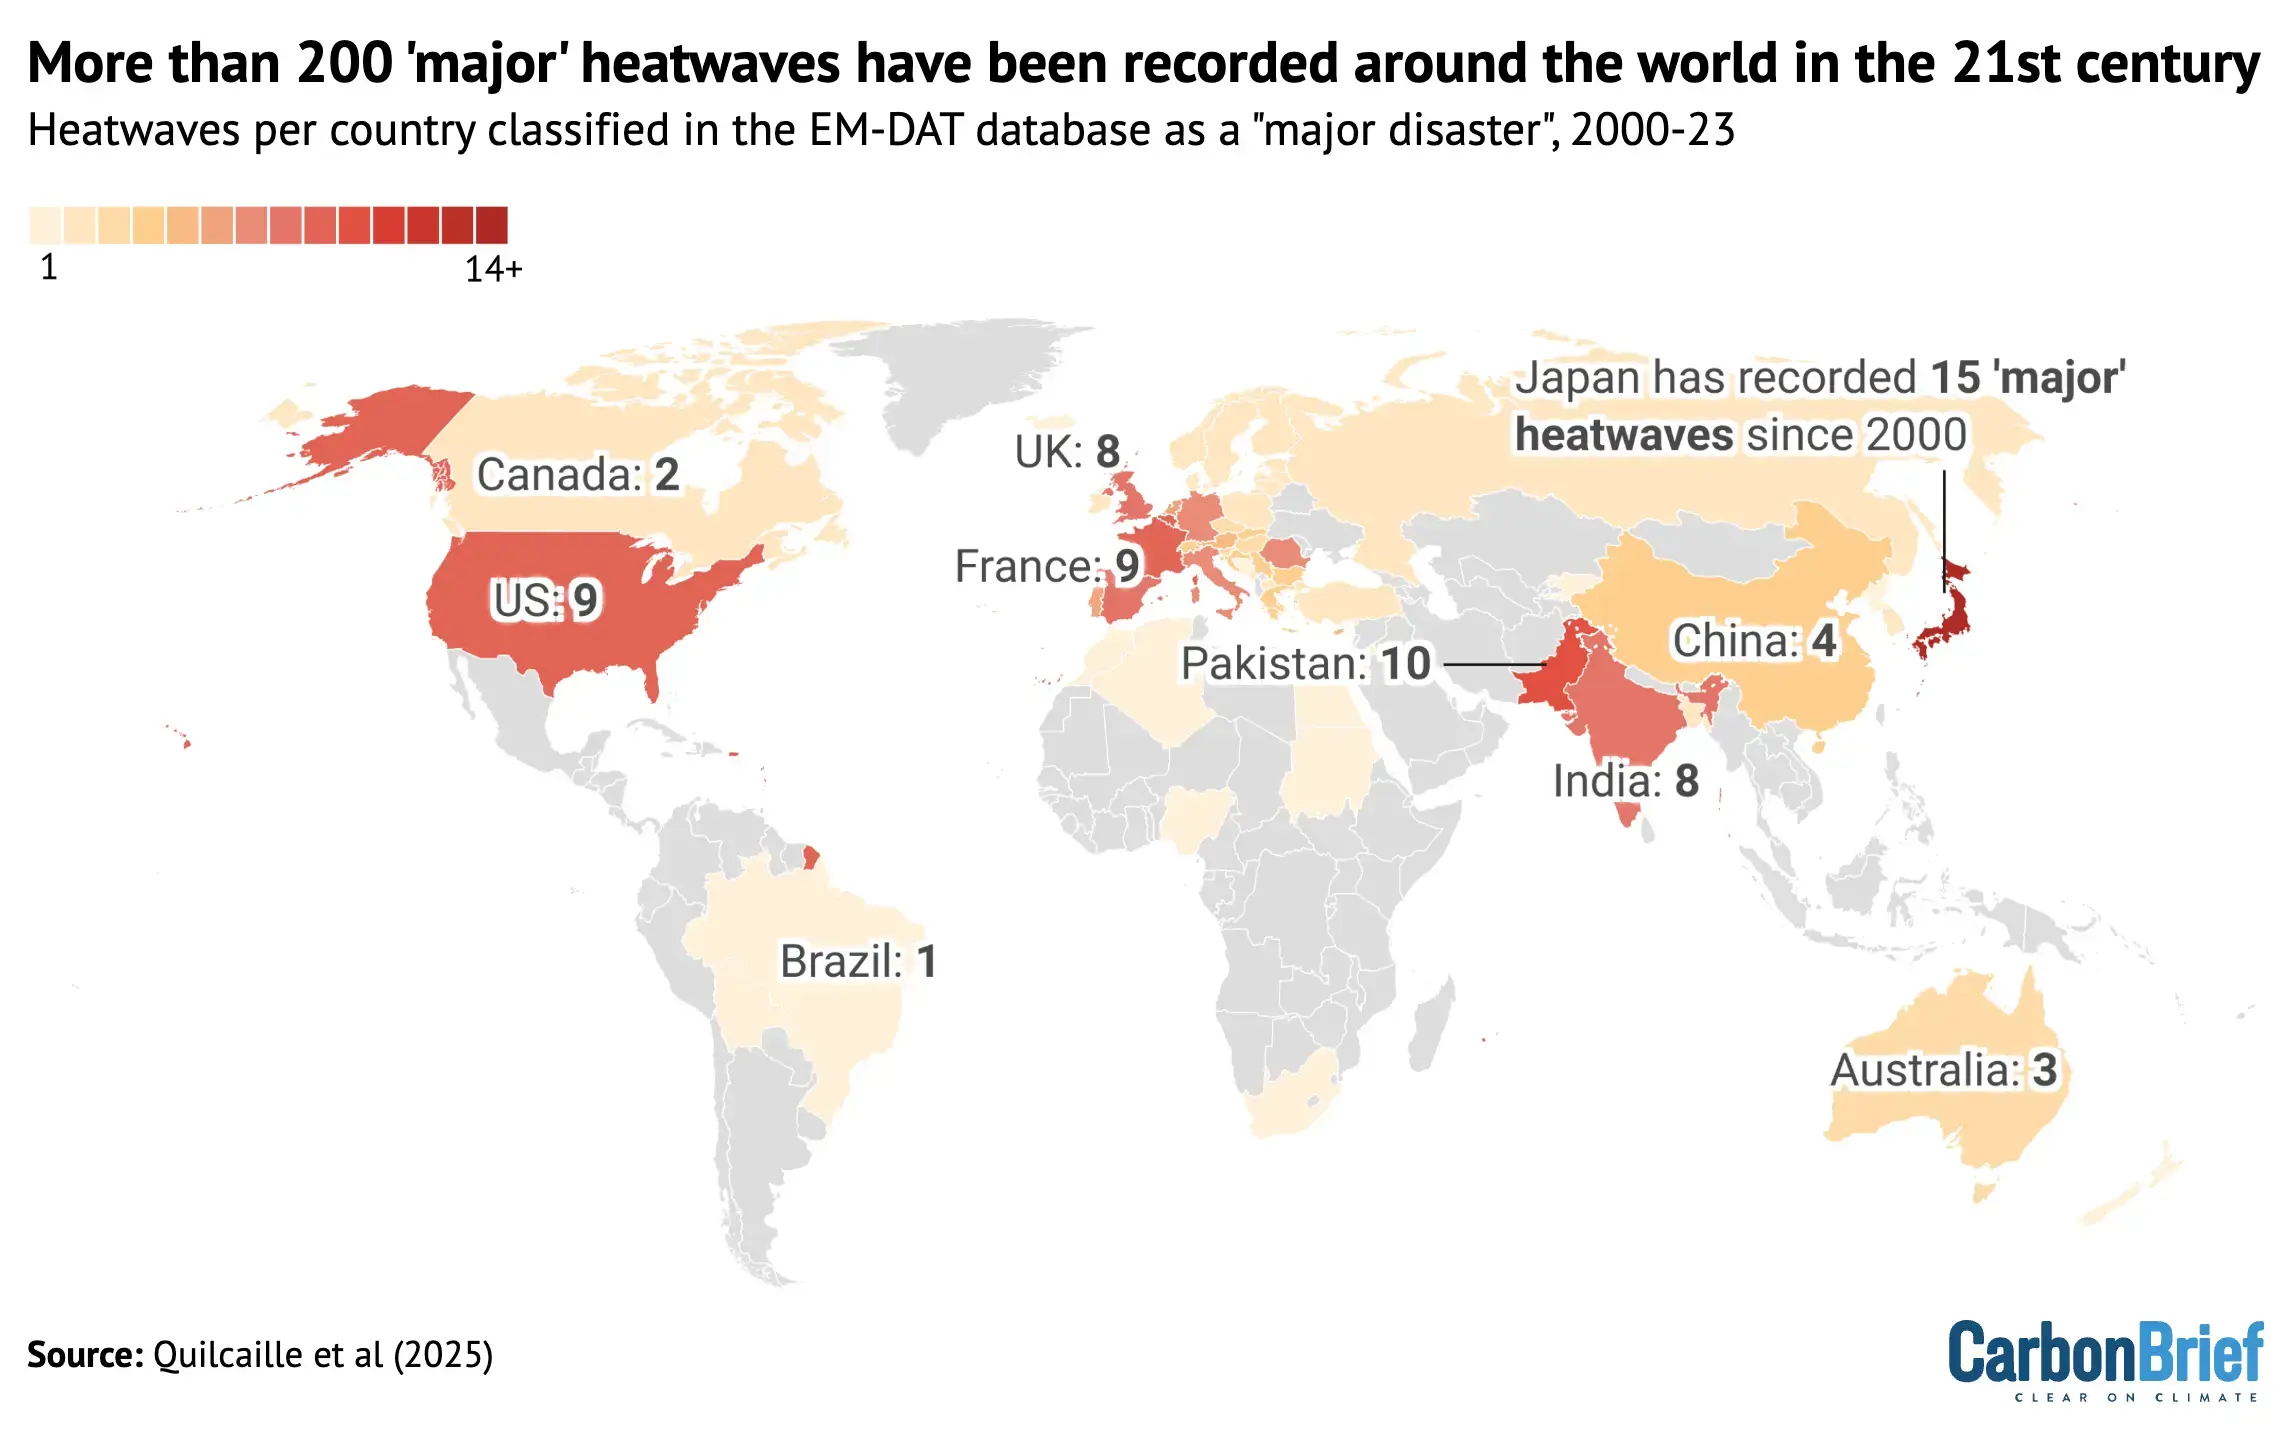
The study authors acknowledge that heatwave reporting is “highly uneven”, with only nine of the heatwaves reported in the database since the year 2000 in Africa, Latin America or the Caribbean. (This is largely because extreme heat events in these regions are not routinely monitored.)
They then carried an attribution analysis on each heatwave to identify whether it was made more likely or intense due to human-caused climate change.
The chart below shows how climate changes increased the intensity and frequency of the 78 heatwaves assessed over 2000-09 (left), 54 heatwaves assessed over 2010-19 (middle) and 81 heatwaves assessed over 2020-23 (right).
The authors find that climate change increased the intensity and probability of all 213 heatwaves in the study. They add that the influence of climate change on heatwaves is strengthening over time.
In each panel, the bars show the percentage of heatwaves in that time period that were made 0.25-1.0C (yellow), 1.0-2.0C (orange) or 2.0-3.0C (red) hotter due to climate change.
The position of bars indicate the change in likelihood of the heatwaves. This ranges from those made 1-10 times more likely due to climate change (left-most bar in each panel) to those made more than 11,000 times more likely (right-most bar in each panel).
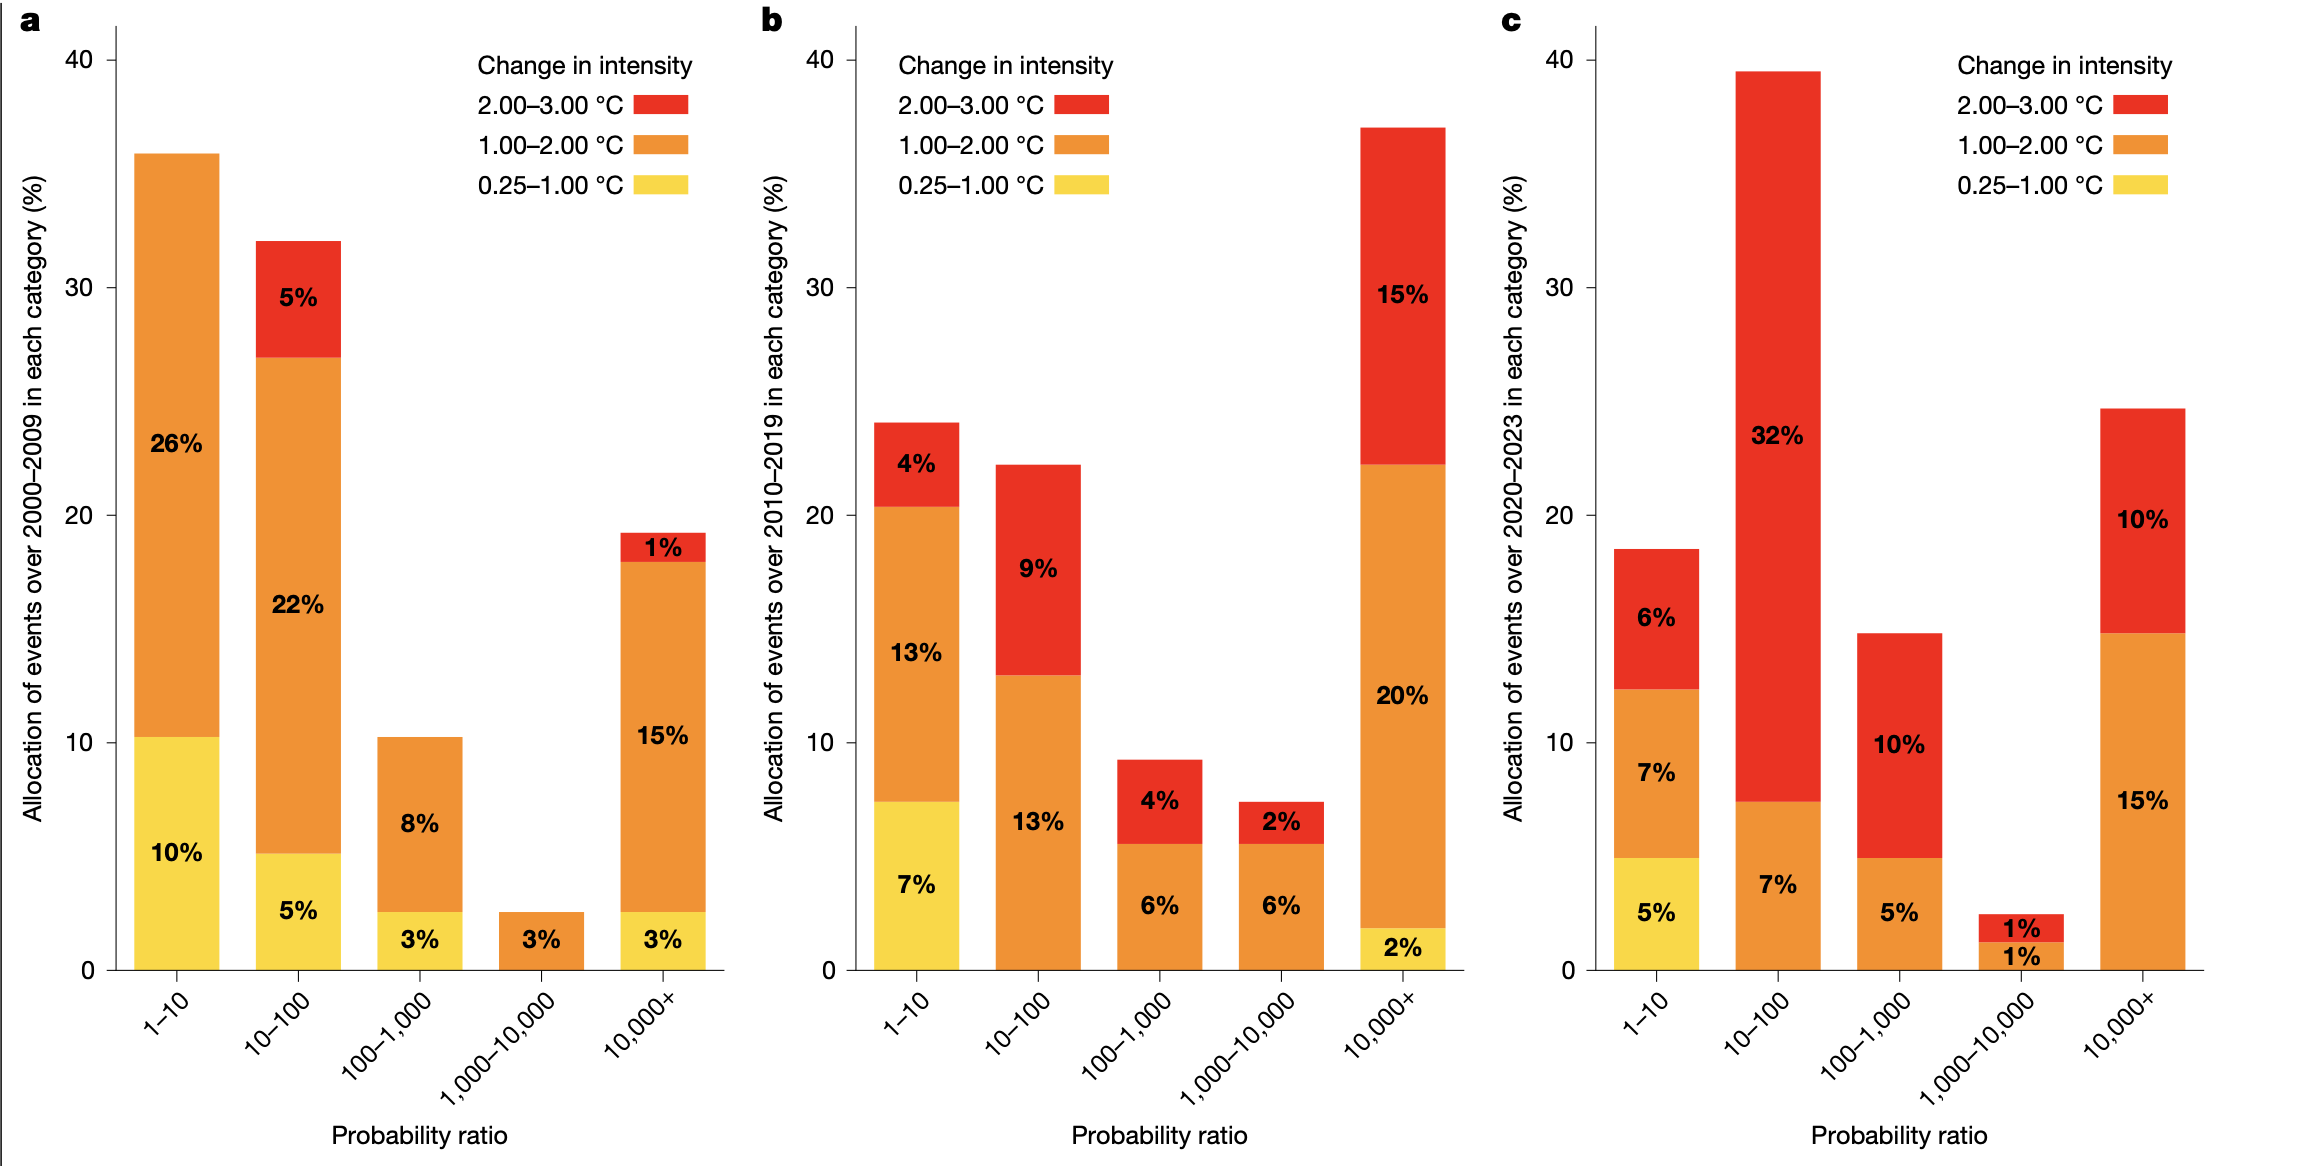
Heatwaves recorded over 2000-09 were, on average, 20 times more likely due to climate change, according to the authors. Meanwhile, those recorded over 2010-19 were about 200 times more likely.
Similarly, 2000-09 heatwaves were 1.4C hotter due to human-caused climate change on average, according to the study, while 2010-19 heatwaves were made 1.7C hotter.
The study finds that human-caused climate change made 55 heatwaves at least 10,000 times more likely. According to the authors, this is “equivalent to saying that they would have been virtually impossible” without the influence of human activity.
Carbon majors
To assess the contribution to heatwaves by oil and gas companies’ products, the authors use a database of carbon dioxide and methane emissions from 180 carbon majors over 1854-2023. This includes direct emissions from the companies, as well as the emissions released when the oil and gas they produced is used by others.
The 180 carbon majors in the database represent 60% of all human-caused CO2 emissions, including land use, over 1850-2023, according to the study. The paper adds that 14 companies, including ExxonMobil, BP, Saudi Aramco and Shell, are responsible for almost half of these emissions.
Using the Earth system model OSCAR, the authors estimate that global average surface temperatures increased by 1.3C between the 1850-1900 average and the year 2023.
They find that 0.7C of this increase was linked to the carbon majors, with 0.3C due to the emissions of the 14 largest.
The chart below, taken from an accompanying Nature “news and views” article, shows the contribution of oil and gas companies’ products to increasing global average surface temperatures over 1950-2023, compared to the 1850-1900 average.
Each colour indicates a carbon major, while grey indicates other sources of temperature increase, such as land-use change.
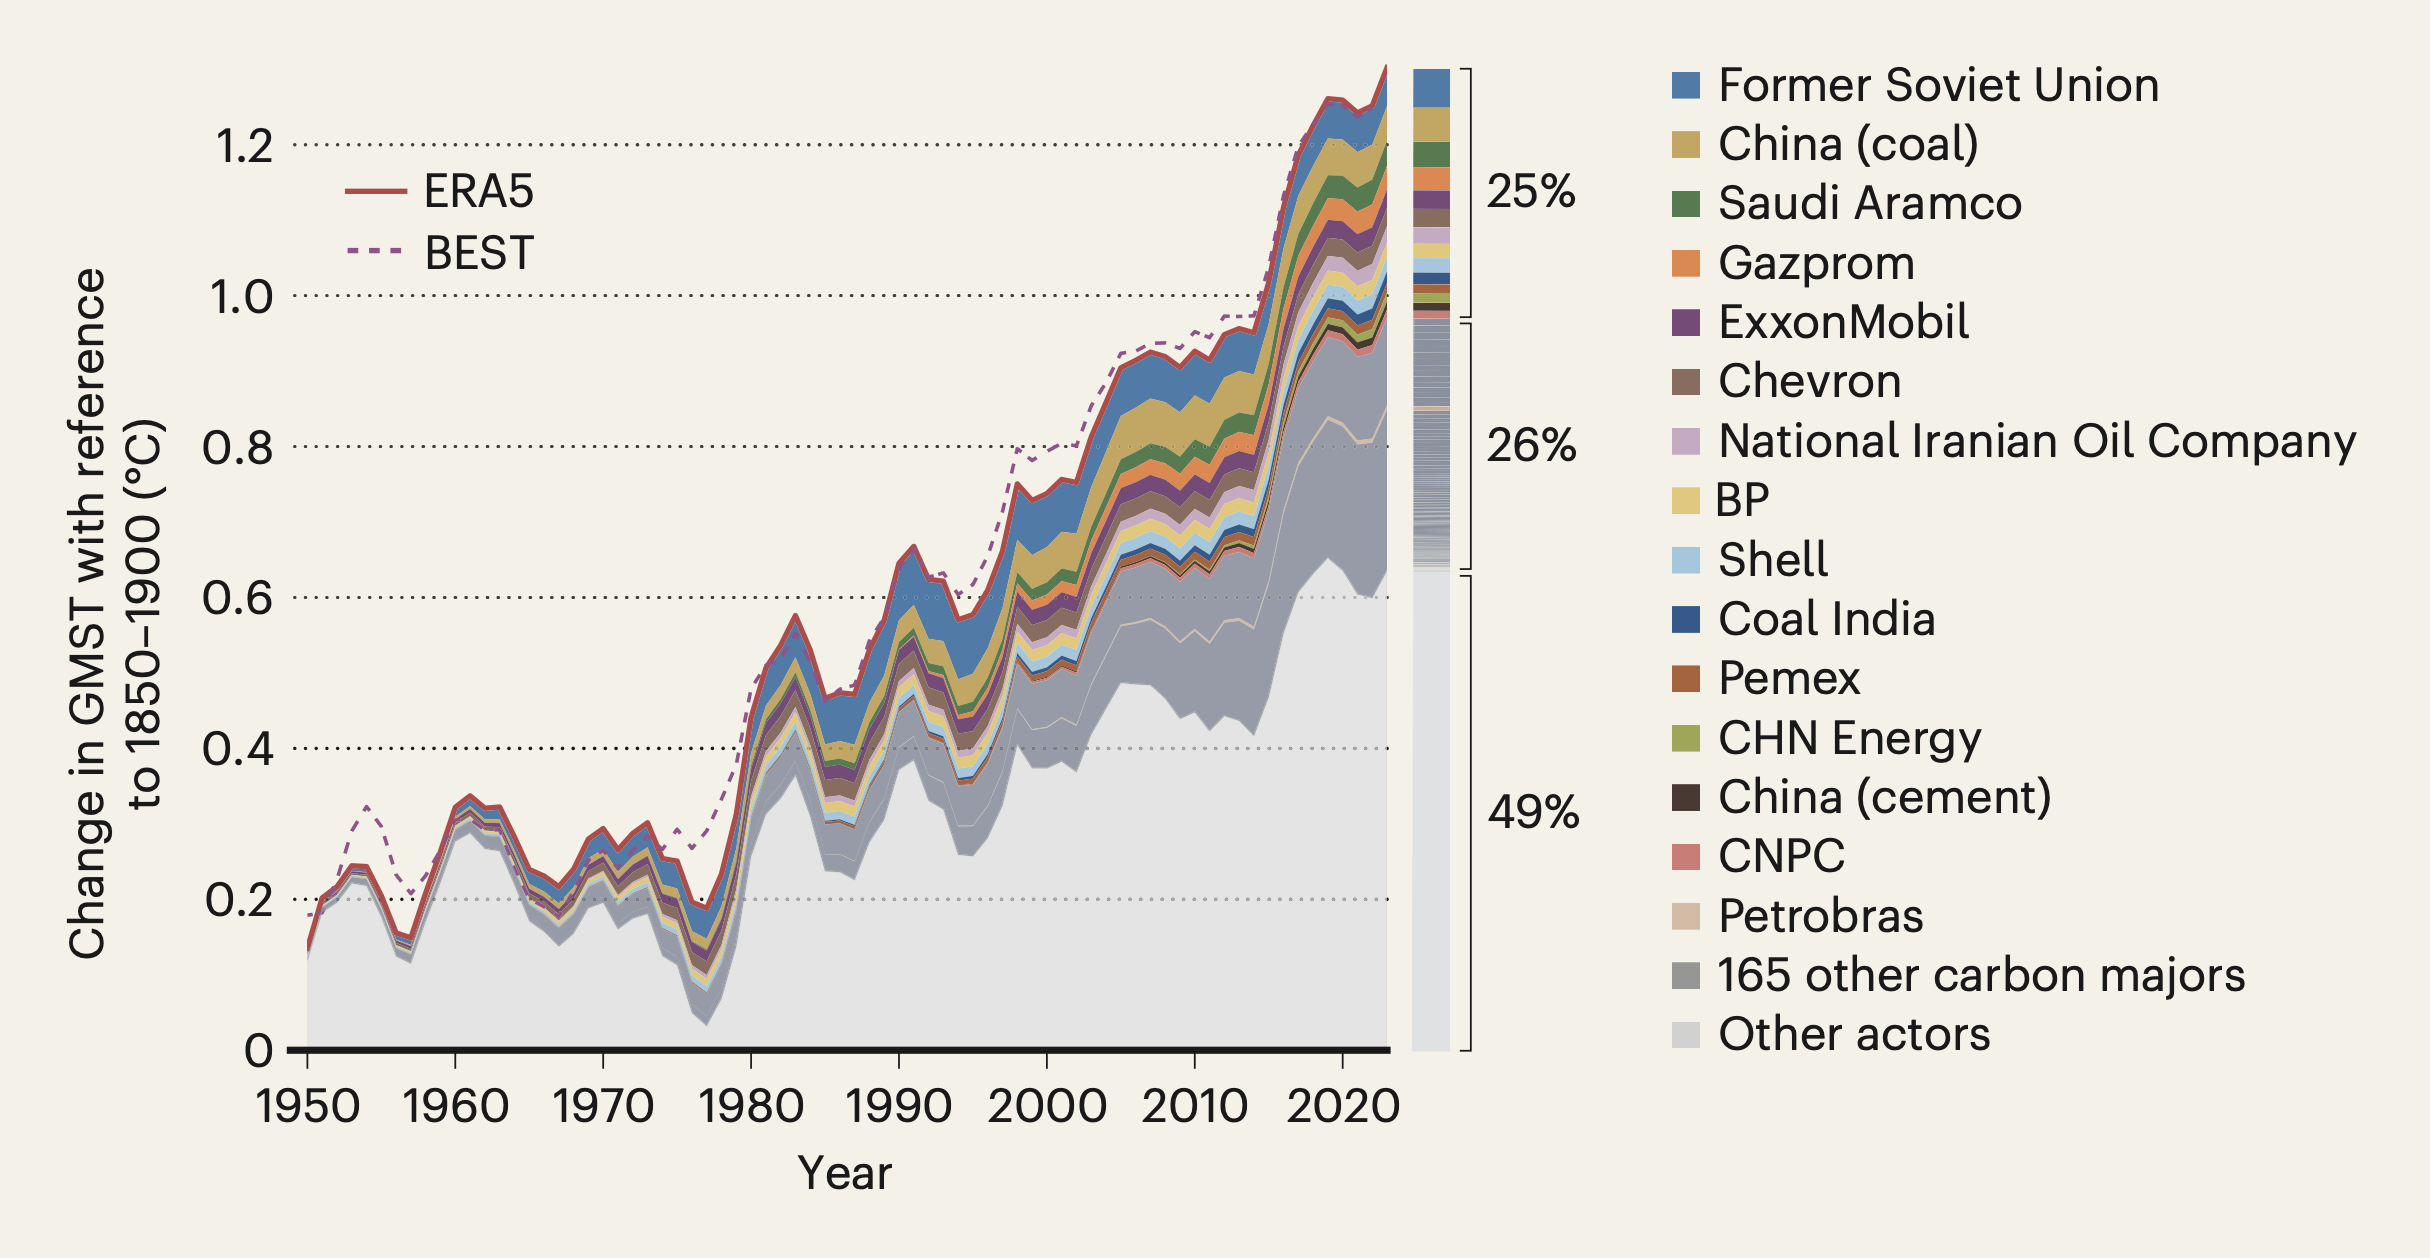
Heatwaves recorded over 2000-23 were, on average, 1.7C hotter due to climate change, according to the study. The authors find that emissions originating from carbon majors and their products contributed about half of the increase in intensity of heatwaves seen since pre-industrial times.
The authors then break down the contribution of emissions from each carbon major on each heatwave in their analysis.
For example, they find that the emissions linked to Saudi Aramco made 51 heatwaves at least 10,000 times more likely. They add that on average, emissions tied to the company made the 213 heatwaves 0.04C hotter.
Legal action
Attribution studies already play an important role in courts by providing evidence that helps judges to determine liability.
Dr Rupert Stuart-Smith is a research associate in climate science and the law at the University of Oxford’s Sustainable Law Programme. He was not involved in the study, but has published separate work showing that the emissions linked to each of the six largest corporate emitters cause one heat-related death in Zurich alone, every summer.
Stuart-Smith tells Carbon Brief that the new paper is a “high-quality analysis and a meaningful step forward for the field of climate change attribution”. He adds:
“With more and more lawsuits aiming to hold high-emitting companies responsible for their contributions to climate change impacts or compel state and corporate actors to reduce their emissions and prevent rising climate harms, work like this provides the basis for well-informed judicial decision-making.”
Dr Yann Quilcaille is a researcher at ETH Zürich and lead author of the study. He stresses the importance of attribution research for court cases, telling Carbon Brief that he hopes his work “can be used by legal practitioners”.
However, he also says that his role as a scientist is not to assign “responsibility” for climate change, but to “provide information to governments for decision making and to courts for litigation”.
Earlier this year, Dr Christopher Callahan, the principal investigator of the IU Climate & Society Lab, published a study with Prof Justin Makin, an associate professor in the department of geography at the University of Dartmouth, which links trillions of dollars in economic losses to the extreme heat caused by emissions tied to oil and gas companies.
Mankin tells Carbon Brief that the new paper is “very closely” linked to his research.
Callahan says the new paper is “an important contribution to an emerging literature that illustrates how individual emitters can be linked to the change risk of extreme climate conditions and human impacts”.
He explains that “this kind of evidence will be important in courtrooms – holding emitters legally accountable requires demonstrating a causal nexus between that emitter and a particularised harm suffered by a plaintiff”.
Attribution
The cutting-edge field of extreme weather attribution seeks to establish the role that human-caused warming played in these events. Attribution studies have been carried out on hundreds of heatwaves all around the world, as shown in Carbon Brief’s interactive map.
The new paper uses one of the earliest and most commonly used methods of attribution, called “probabilistic attribution”.
Specifically, it uses the method set out by the World Weather Attribution initiative for its “rapid attribution” analyses.
The authors first chose a temperature “threshold” to define their heatwave.
They then used a global climate model to simulate two worlds – one mirroring the world as it was during the heatwave and the other using the climate of 1850-1900. This second scenario is used to represent the climate in a world without human-caused climate change.
The authors run their models thousands of times in each scenario. As the world’s climate is inherently chaotic, each model “run” – individual simulations of how the climate progresses over many years – produces a slightly different progression of temperatures. This means that some runs simulate the heatwave, while others do not.
The authors count how many times the threshold temperature was in each model run. They then compared the likelihood of crossing the threshold temperature in the world with – and a world without – climate change.
For example, they find that the 2021 Pacific north-west heatwave was made 3.1C hotter due to human caused climate change and more than 10,000 times more likely.
(A study by the WWA at the time of the heatwave found that the heatwave was made 150 times more likely. The discrepancy is due to differences in the definition of the event, as well as its “very unlikely nature” according to the study authors.)
Dr Frederieke Otto is a professor at Imperial College London and founder of the WWA initiative. She tells Carbon Brief that the new study is “very similar to some other recent studies on impacts, based on the hazard attribution method used by WWA”, but says that “this is the most high profile and wide-reaching one”.
Otto adds:
“I do hope that many more impact attribution studies will follow, based on our or other extreme event attribution studies. We need more research on this.”
Quilcaille, Y. et al. (2025), Systematic attribution of heatwaves to the emissions of carbon majors, Nature, doi:10.1038/s41586-025-09450-9


