Video: NASA satellites show our ‘breathing’ planet in action
Roz Pidcock
11.17.15Earth’s plant life isn’t static, but ebbs and flows with the seasons. A new animation from NASA, the US space agency, shows a year in the life of plants on land and in the oceans.
Watch the mesmerising colours changing month by month in the video below. On land, the green colour represents plants and forests. In the oceans, it’s tiny floating plants called phytoplankton.
The seasonal cycle of Earth’s plant life over a 12 month period, using combined data from different satellite instruments over many years. Credit: NASA’s Goddard Space Flight Center.From December through till February, not much sunlight hits the mid and high latitudes in the northern hemisphere and plant growth is sparse. At the same time, it’s the height of summer in the southern hemisphere, and the ocean around Antarctica and the forests of South America, Africa and Indonesia are teeming with life.
As the seasons march onwards and spring arrives in the northern hemisphere, a wave of greenery spreads over the land and oceans, extending right up to the far north. The nutrient-poor tropical oceans either side of the equator remain as relatively lifeless blue expanses all year round, these great gyres growing and shrinking with the seasons.
Satellites measure the amount of chlorophyll in plants, the pigment used to capture sunlight as they photosynthesise and grow. The video above isn’t for any particular year. Instead, it shows the average annual cycle by combining satellite information for several years into one animation.
Our ‘breathing’ planet
Plants absorb carbon dioxide from the atmosphere as they grow, releasing some of it again as they die and decompose. Anything that affects the life cycle of plants, such as drought, deforestation and wildfire affects how much the Earth cycles or “breathes” carbon dioxide in and out.
A new satellite launched last year is allowing NASA to keep track of how the amount of carbon dioxide in the air changes throughout the year in different parts of the world.
The video below shows the tracks taken by the Orbiting Carbon Observatory-2 satellite between May and August this year as it circled the Earth, measuring carbon dioxide as it went.
The orange and red colours reveal areas where it recorded a carbon dioxide concentration above 400 parts per million (ppm), blue is where it dropped to around 390ppm. A press release from NASA explains:
So far, OCO-2 only has one full year’s worth of data, but soon it will be able to help scientists study how the cycling of carbon between the atmosphere, land and oceans changes from one year to the next as the climate warms. The land and ocean have, so far, absorbed about half the carbon dioxide humans have released through burning fossil fuels. But scientists aren’t sure how long they will continue to do so.
Links to El Niño
Scientists at NASA are also using the carbon dioxide maps from OCO-2 to examine the impacts of El Niño, the phenomenon underway in the Pacific that’s causing extreme weather worldwide.
The World Meteorological Organisation announced this week that this year’s event is the strongest for 15 years and looking very likely to be one of the top three biggest on record.
The OCO-2 satellite has spotted a strong correlation between atmospheric carbon dioxide over the Pacific Ocean and the current El Niño, says Dr Anne-Marie Elderling, the NASA scientist second in charge of the project. She tells Carbon Brief:
The scientists don’t have conclusive findings to report just yet about their El Niño observations. But Dr Abhishek Chatterjee from the NASA Goddard Space Flight Center, Dr Michelle Gierach and Prof Dave Schimel from NASA’s Jet Propulsion Laboratory are among a team of scientists looking closely at what the new satellite can tell us about the weather event everyone’s talking about.
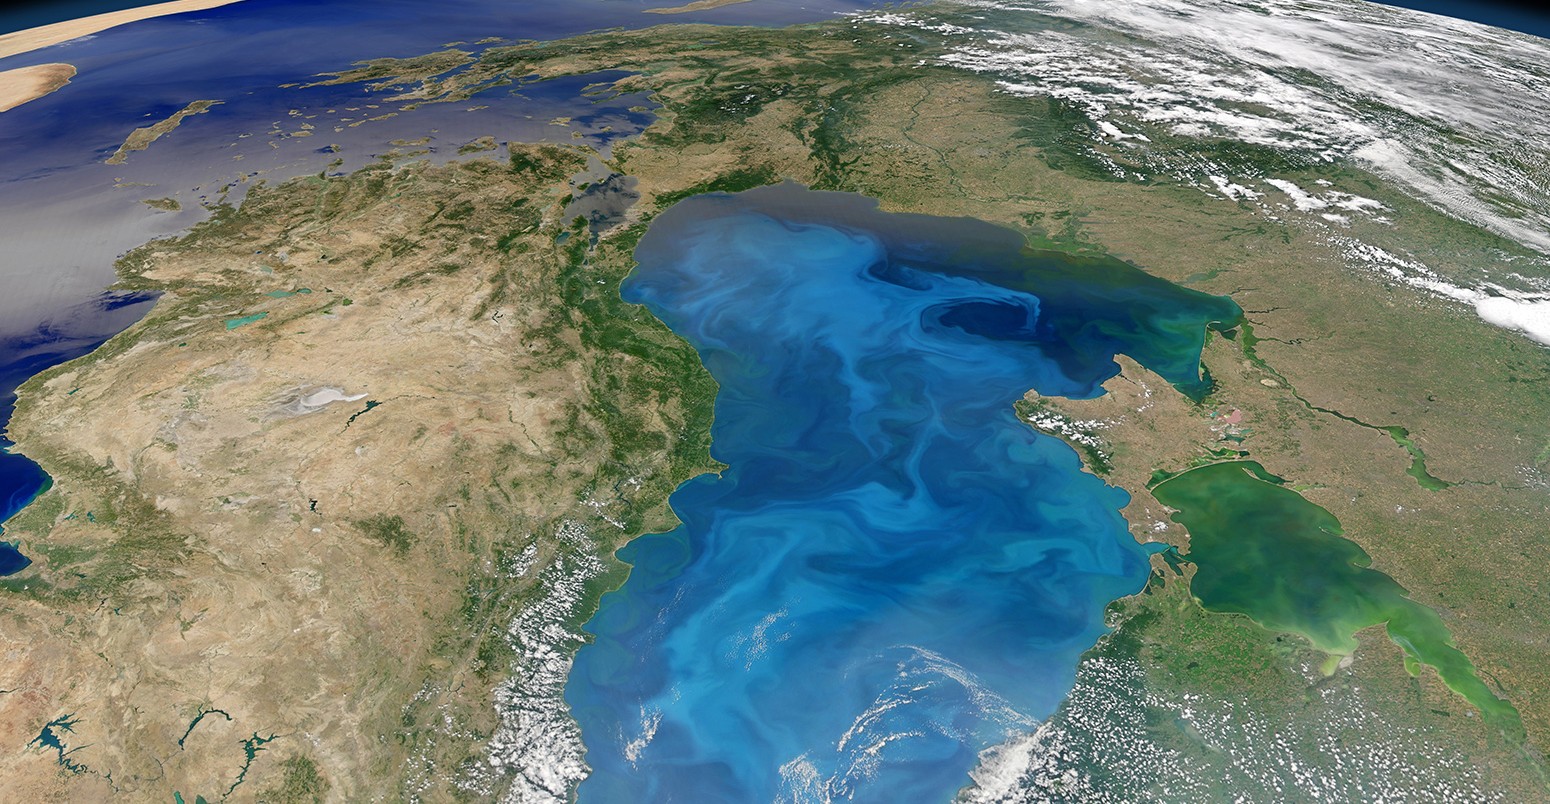
Main image: Algae bloom in the Black Sea. © NASA/Corbis.
-
Video: NASA satellites show our 'breathing' planet in action
-
A new animation from NASA, shows a year in the life of plants on land and in the oceans.