
World’s major climate agencies confirm 2016 as hottest year on record
Roz Pidcock
01.18.17Roz Pidcock
18.01.2017 | 3:58pmLast year was the warmest year in recorded history, scientists confirmed today. With global temperatures topping 1C above preindustrial times, the world has now experienced three consecutive record-warm years for the first time since records began.
The long-term warming trend from greenhouse gas emissions received an extra boost from the tail-end of a strong El Niño but 2016 would have been a record even without it, say scientists.
The 12-month period from January to December 2016 was 0.13C warmer than the previous record set in 2015, which was itself 0.11C warmer than 2014, according to scientists from the US National Aeronautics and Space Administration (NASA).
The US National Oceanic and Atmospheric Administration (NOAA) also released its official data today, confirming 2016 as the hottest year on record. A third, independent record from the UK Met Office/University of East Anglia puts 2016 marginally above 2015’s record high.
You can see how the three global datasets compare in the graph below. NASA is in blue, NOAA is in red and the Met Office/UEA is in yellow. (Read on for more details about why they differ.)
Graph: Global surface temperature from 1850-2016. By Rosamund Pearce for Carbon Brief using Highcharts.The World Meteorological Organisation, which takes an average of all three major datasets, also confirmed 2016 as the hottest year on record today.
Role of El Nino
![]()
According to NASA’s analysis, the departing El Niño gave a boost to global temperature early in 2016, leading to a string of record-setting months. The six-month period from January to June was the warmest half-year in the modern temperature record, dating back to 1880.
As the effects of the El Niño reached a peak and began to wane, greenhouse gas warming kept global temperatures high for the rest of the year.
Overall, El Niño contributed about 0.12C to the global temperature anomaly in 2016, with the bulk of the warming coming from greenhouse gases, according to NASA figures. The UK Met Office’s analysis echoes the small role of El Niño relative to climate change. Dr Peter Stott, acting director of the Hadley Centre, said today:
“A particularly strong El Niño event contributed about 0.2C to the annual average for 2016…The main contributor to warming over the last 150 years is human influence on climate from increasing greenhouse gases in the atmosphere.”
The scientists say they do not necessarily expect 2017 to be another record year, since the world is now in a weak La Niña phase – the cold counterpart to El Niño that tends to edge global temperature downwards – and scientists are expecting a slip back to “neutral” by February.
Nevertheless, continued warming from greenhouse gases will mean 2017 is still likely to be a very warm year in the context of the 136-year record, the scientists say.
Arctic warming
Aside from El Niño, 2016 was out-of-the-ordinary for other reasons.
The Arctic, in particular, experienced an exceptional year. Persistent high temperatures saw Arctic sea ice extent drop to record lows in January, February, April, May, June, October, and November.
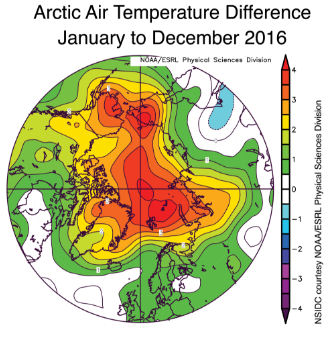
Arctic temperature anomaly for January to December 2016, showing above average temperatures for most the region and warming up to 4C above average in some parts. Source: NSIDC
But observations are scarce in the remote Arctic. How the three global temperature datasets handle the absence of data is a major reason for the differences between them, says Dr Gavin Schmidt, director of NASA’s Goddard Institute for Space Science. He tells Carbon Brief:
“One of the interesting things this year is that because of the very warm Arctic, the datasets that extrapolate into the Arctic somewhat more comprehensively show a much larger gap between 2015 and 2016 than the datasets that only have a partial Arctic component.”
In large part, he explains, this is why NASA’s global temperature for 2016 (blue) is so much higher than for the Met Office/UEA (yellow) in the graph above. Schmidt continues:
“Effectively, their implicit assumption is that the Arctic is warming as fast as the rest of the world when it is obvious that it is warming quite a bit faster than the rest of the world.”
Margin of error
All of today’s estimates of global temperature come with a measure of uncertainty, a range above and below the estimate within which the actual value is likely to lie. This is to account for the fact that there are some uncertainties in the measurements themselves. As Schmidt explains:
“Our ability to tell exactly what’s going on in any given year depends a little bit on the methodology we use, it depends a little bit on the interpolation we do where there isn’t data. It depends on the uncertainty of meshing together different sources of data together, particularly in the ocean.”
Each of the global agencies takes a slightly different approach to stitching together different data sources. The difference between global temperature in 2016 and the previous record in 2015 is greater than the margins of error in the NASA and NOAA datasets, putting it beyond doubt that 2016 is the hottest year in those records. The distinction isn’t so clear cut for the Met Office/UEA record, where missing Arctic data makes for a larger margin of error. As Stott explains:
“In the HadCRUT4 dataset, the temperature for last year was very close to the year before…2015 was remarkable for having stood out so clearly from previous years as the warmest year since 1850 and now 2016 turns out to have been just as warm.”
That all three datasets arrive independently at the same overall result – of exceptional warmth relative to the past – increases confidence in their conclusion. Schmidt says:
“There are always choices in how you build these things and it’s important to be able to demonstrate that this result doesn’t depend on the choice one group makes…If there was just one then I think we’d be rightly criticised for claiming too much on the basis of one dataset.”
Over time, scientists develop better ways to do this “meshing” and the datasets are updated. A paper this month, for example, confirmed that a recent upgrade to the ocean temperature record that both NASA and NOAA use does a better job at capturing the pace of warming in recent decades than older versions.
Important though they are, corrections to account for changes in the way data is collected are small compared to warming we’ve seen since humans started industrialising, Schmidt notes:
“If you didn’t make those corrections and you just added them all up in a slightly naive way, it’s still abundantly obvious that the planet has warmed about 1C in the last 100 years. These changes don’t affect the gross picture that you see, though they can impact a short-term trend.”
Broken record
Seemingly every year there’s a discussion about whether the previous year broke records or not. Does this focus on record-setting help our understanding of climate change?
Untangling the factors that can nudge global temperature up or down in any given year, such as El Niño and La Niña, is scientifically interesting, but it doesn’t alter the big picture. As Prof Jerry Meehl, senior scientist at the US National Center for Atmospheric Research, explains:
“Though some years will be warmer than others, the overall trend over multiple decades will inevitably be upward as long as concentrations of CO2 in the atmosphere keep increasing.”
Or as Prof Dave Reay, professor of carbon management at the University of Edinburgh, puts it:
“Short-lived swings in global temperature due to things like El Nino or volcanic eruptions have always been the waves atop the long term tidal cycle that is climate. Through our carbon emissions we have now radically altered this cycle and the tide is rising fast.”
That said, the focus on momentous “events” is inevitable, to some extent, as that tends to be how humans monitor changes over time, Schmidt tells Carbon Brief:
“Whether 2016 was the first or second warmest [year on record] doesn’t make any difference to the impacts that we anticipate over time…So, in some sense, [records] aren’t important, but in another sense they are. Our birthdays, these records, these milestones, are how we track what’s going on because we’re not very good at tracking things in a continual sense.”
So, while humans are tuned to pay attention to records, the bottom line is that the planet is warming and we’re in a period of exceptional warmth historically, Schmidt concludes:
“Where we’re headed – 2,3,4, possibly 5C – is an enormous deal…We will have been a geological force marked in the ocean sediment and the ice cores as large as anything that’s happened, with the possible exception of the Cretaceous meteorite impact. That’s very sobering.”
NEW: World’s major climate agencies confirm 2016 as hottest year on record | @RozPidcock https://t.co/Cn2CfNa4f0 pic.twitter.com/S8vqnDdVvY
— Carbon Brief (@CarbonBrief) January 18, 2017