Analysis: Coronavirus temporarily reduced China’s CO2 emissions by a quarter
Lauri Myllyvirta
02.19.20Lauri Myllyvirta
19.02.2020 | 12:01amAs China emerges from one of the most serious epidemics of the century – even as much of the rest of the world remains in a coronavirus crisis – the country’s energy demand and emissions are beginning to return to normal.
Update 30 March 2020: The analysis contained in this article was first published in mid-February and was subsequently updated several times as new figures became available. This analysis remains in the first sections of the article, below.
Now, as of the end of March and based on the most recent data, including official government figures, it is possible to gauge the accuracy of this initial analysis. There is a detailed update and reflection on what is known so far at the end of this article.

Overall, the figures reinforce my estimate that China’s carbon emissions fell by around 25% over a four-week period, as outlined below, equivalent to around 200m tonnes of CO2 (MtCO2). Demand slowly returned to normal levels over an extended seven-week period, bringing the reduction so far to around 250MtCO2, with emissions some 18% lower than usual levels.
As before, however, the Chinese government’s coming stimulus in response to the disruption could outweigh these shorter-term impacts on energy and emissions, as it did after the global financial crisis and the 2015 domestic economic downturn.
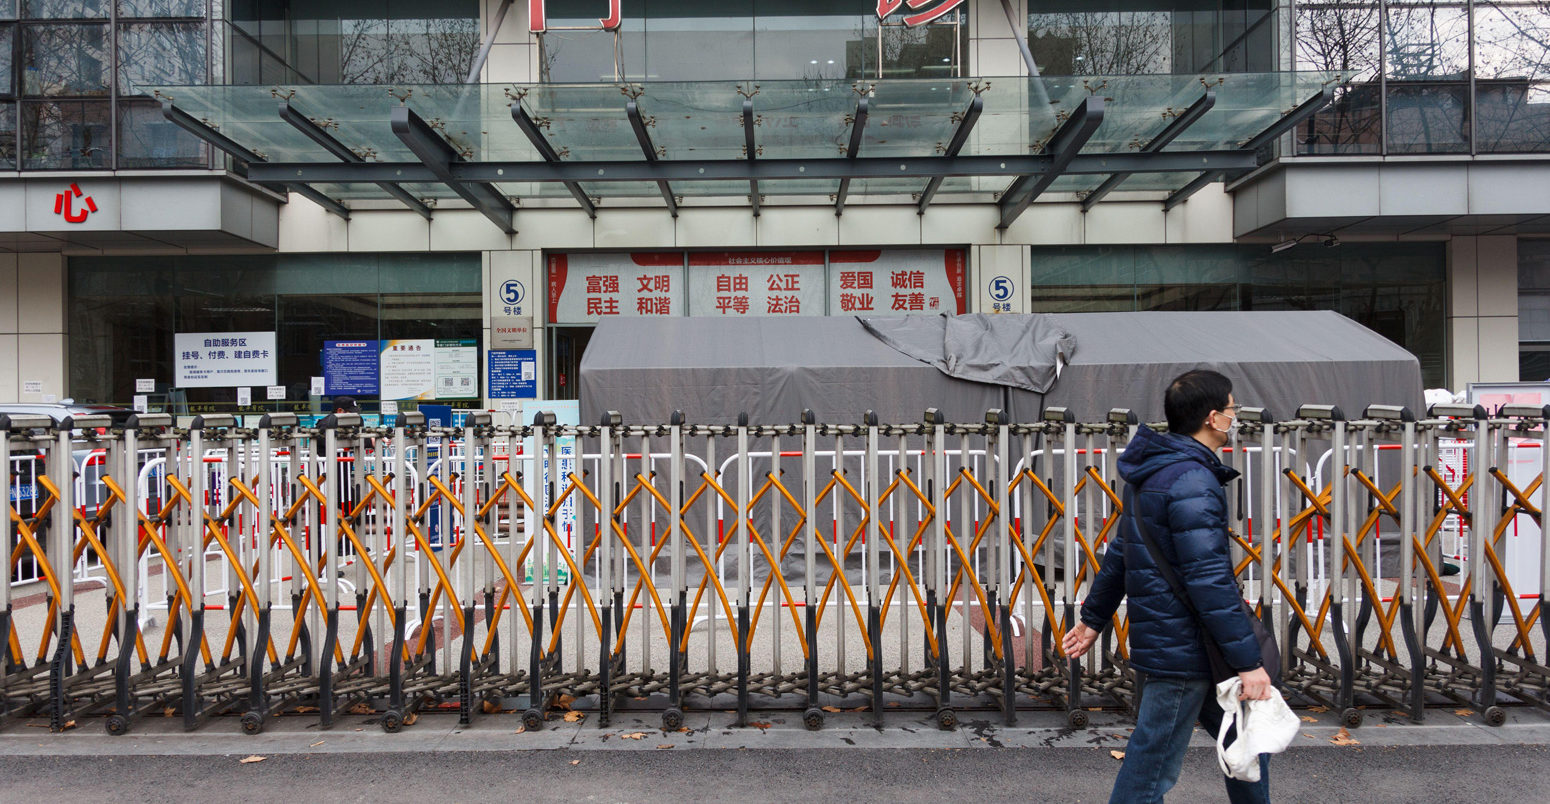
A country in shutdown
Every winter, during Chinese new year, the country closes down for a week, with shops and construction sites closing and most industries winding down operations. The holiday has a significant short-term impact on energy demand, industrial output and emissions.
The blue lines on the chart below show how coal-fired power generation typically drops by an average of 50% in the 10 days following the eve of Chinese new year, marked as zero on the x-axis.
This year, shown in red, the usual fall in energy use has been prolonged by 10 days so far, with no sign of rebound. This is because the annual holiday was extended to give the government more time to get the epidemic under control – and demand has remained subdued, even after the official resumption of work on 10 February.
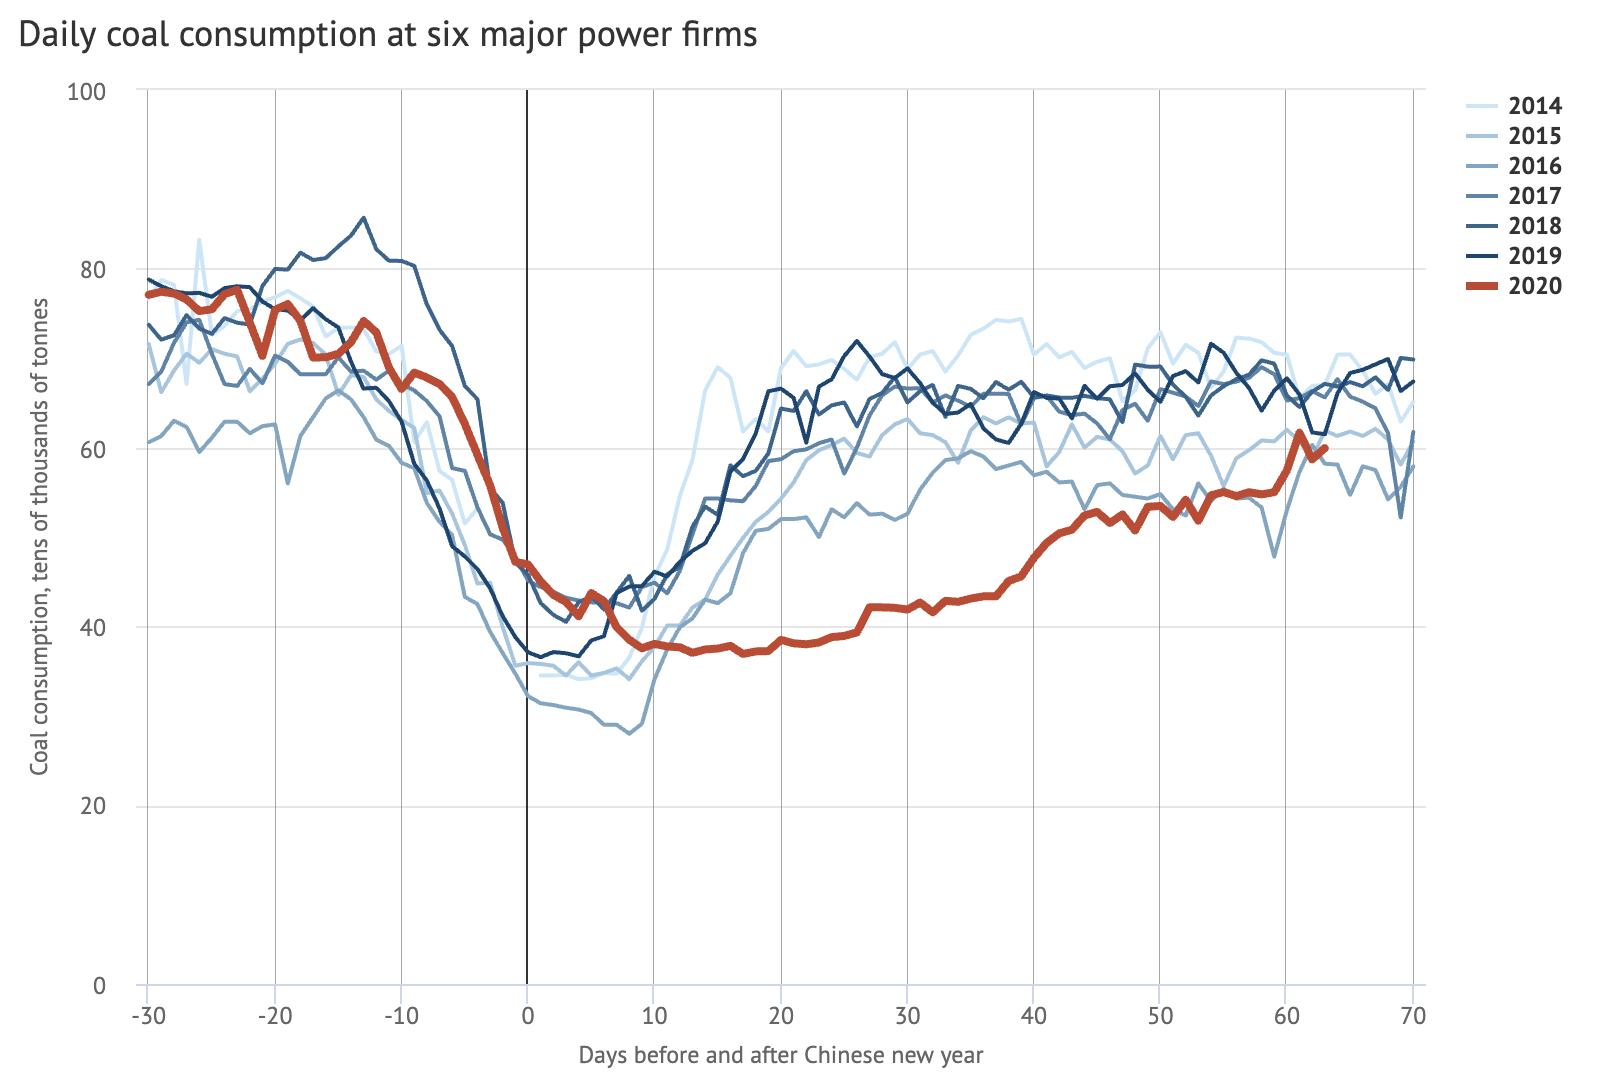
In the four-week period commencing 3 February this year, average coal consumption at power plants reporting daily data fell to a four-year low, with no sign of recovery in the most recent data, covering Sunday 1 March.
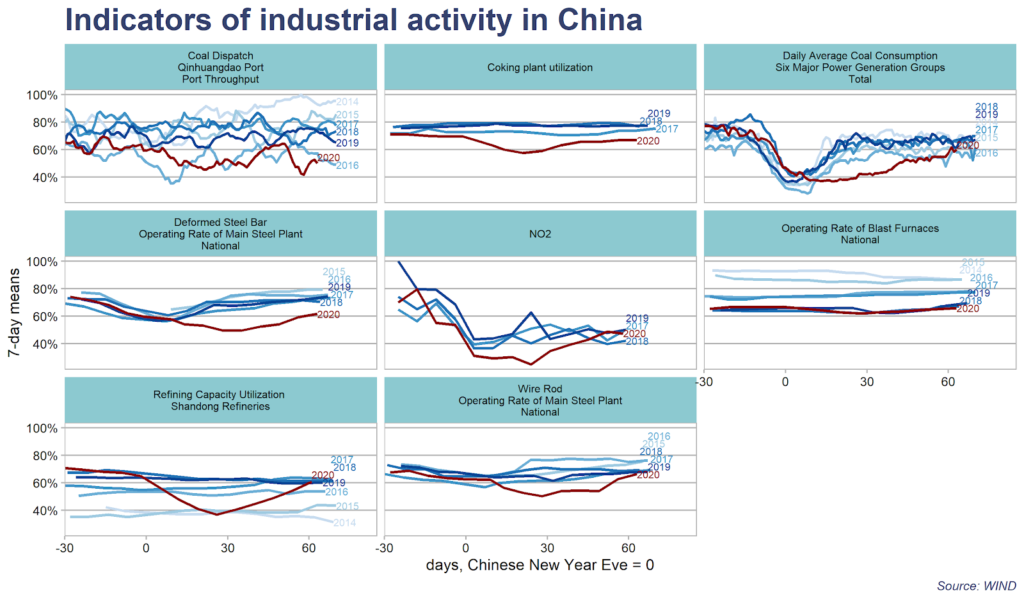
The short-term effect has been equally dramatic across a range of other industrial indicators, shown as 28-day averages in the figure below. The top left chart shows coal throughput at the main coal port, Qinhuangdao, which fell to the lowest level in four years in the four weeks to 1 March.
Similarly, refinery operating rates in Shandong province, the country’s main centre for oil refining, fell to the lowest level since autumn 2015 (below left), indicating a sharply reduced oil demand outlook. Furthermore, as expected, underlying demand for oil products, steel and other metals has fallen much more than output, resulting in record-high stockpiles, which will put pressure on production going forward.
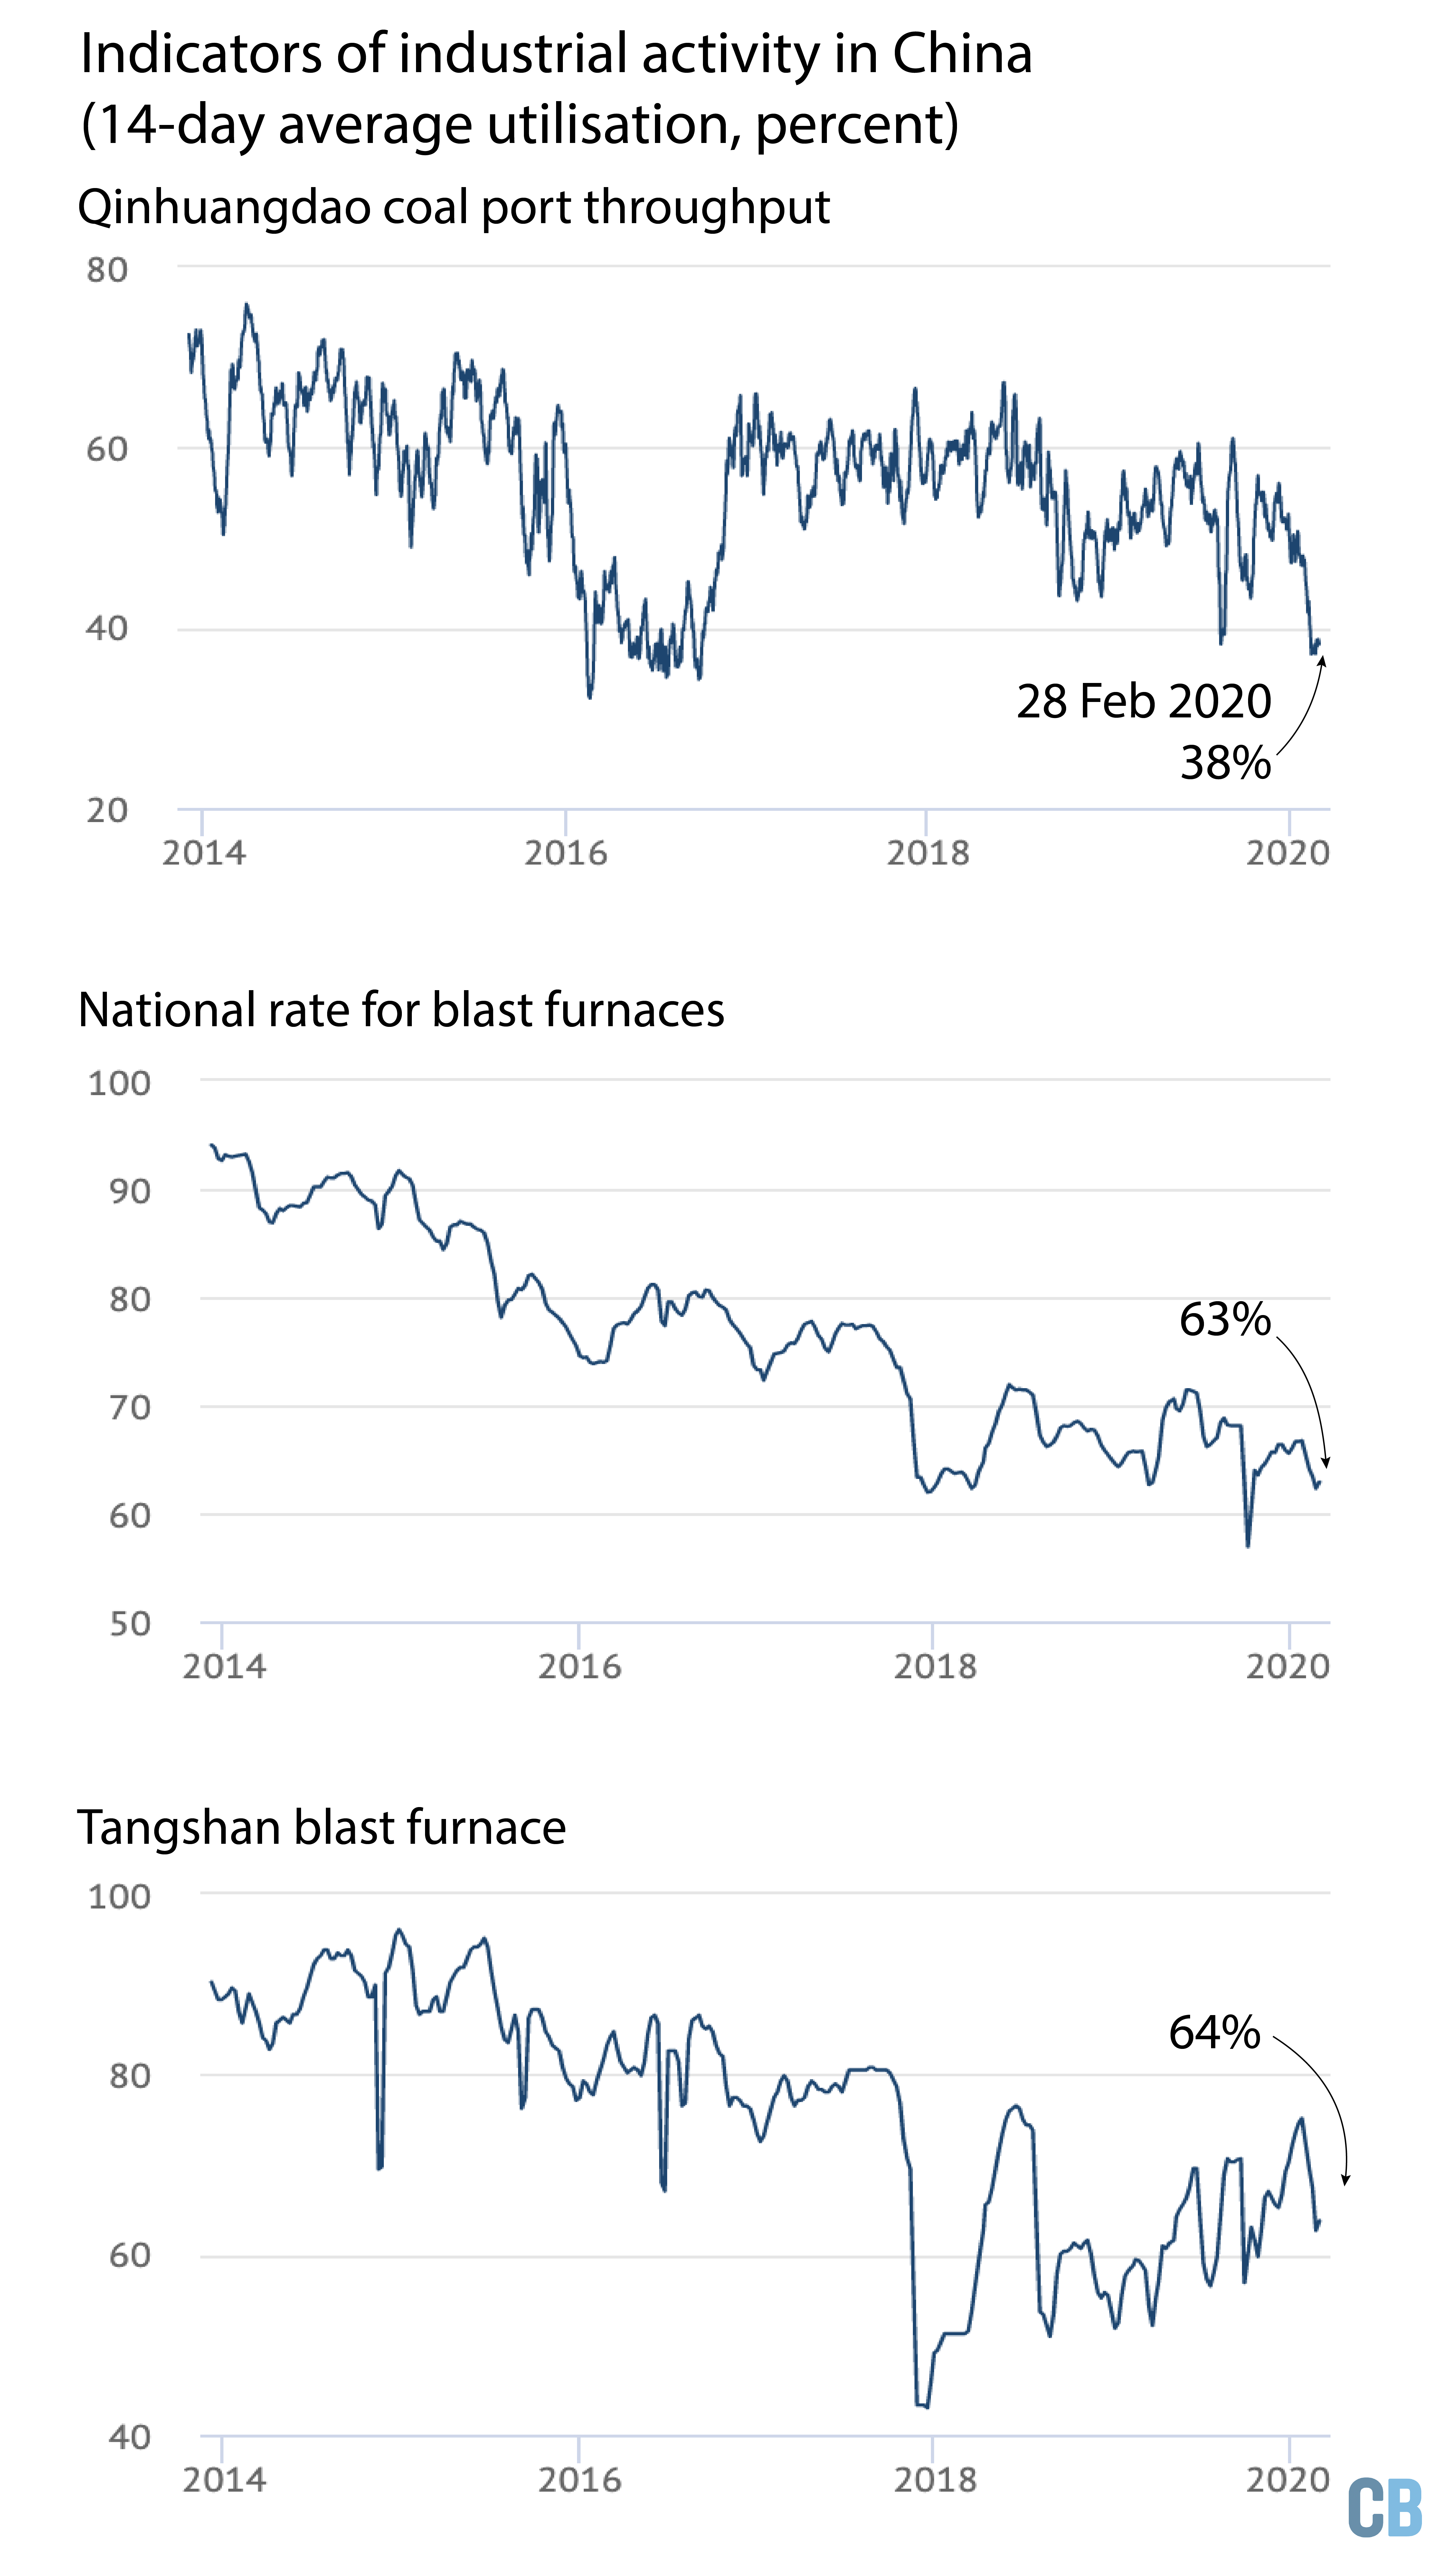
Strikingly, all indicators of industrial capacity utilisation – coal power plants, blast furnaces, coking, steel products, refineries – deteriorated further in the week commencing 10 February, when business was officially expected to resume.
- IEA: ‘Green’ coronavirus recovery would keep global emissions below 2019 peak
- Coronavirus: Tracking how the world’s ‘green recovery’ plans aim to cut emissions
- Webinar: What impact is Covid-19 having on global CO2 emissions?
- Q&A: Could climate change and biodiversity loss raise the risk of pandemics?
- Analysis: Coronavirus set to cause largest ever annual fall in CO2 emissions
- Coronavirus: What could lifestyle changes mean for tackling climate change?
- Analysis: Coronavirus temporarily reduced China’s CO2 emissions by a quarter
The rebound in industrial operation and domestic fossil fuel consumption has proven to be slow, with the first signs of the resumption of activity evident in the national aggregate data only in the past week, but still with a long way to go. This is not for lack of trying though, as some cities have reportedly even resorted to mandating factories to use more electricity, whether or not they have the personnel to resume production, in an effort to doctor a resurgence in power demand. While anecdotal, this is testimony to the massive pressure on local officials to jumpstart the economy.
Taken together, the reductions in coal and crude oil use indicate a reduction in CO2 emissions of 25% or more, compared with the same two-week period following the Chinese new year holiday in 2019. This amounts to approximately 100MtCO2 – or 6% of global emissions over the same period.
One exception to the wider downturn has been primary steel production, which kept running through new year and the extended holiday. In contrast, production of the main steel products – a closer proxy of demand – is down a quarter, hitting the lowest 14-day level in five years. Unless demand rebounds fast, blast furnaces will have to shut down as well given limited capacity to hold stocks and a souring demand outlook.
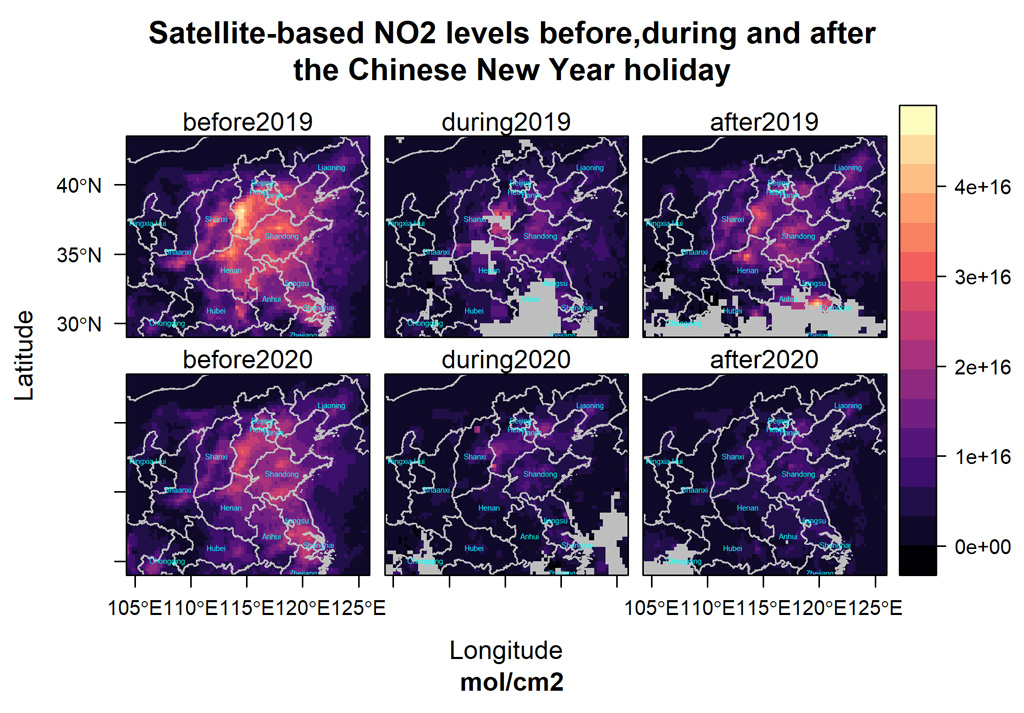
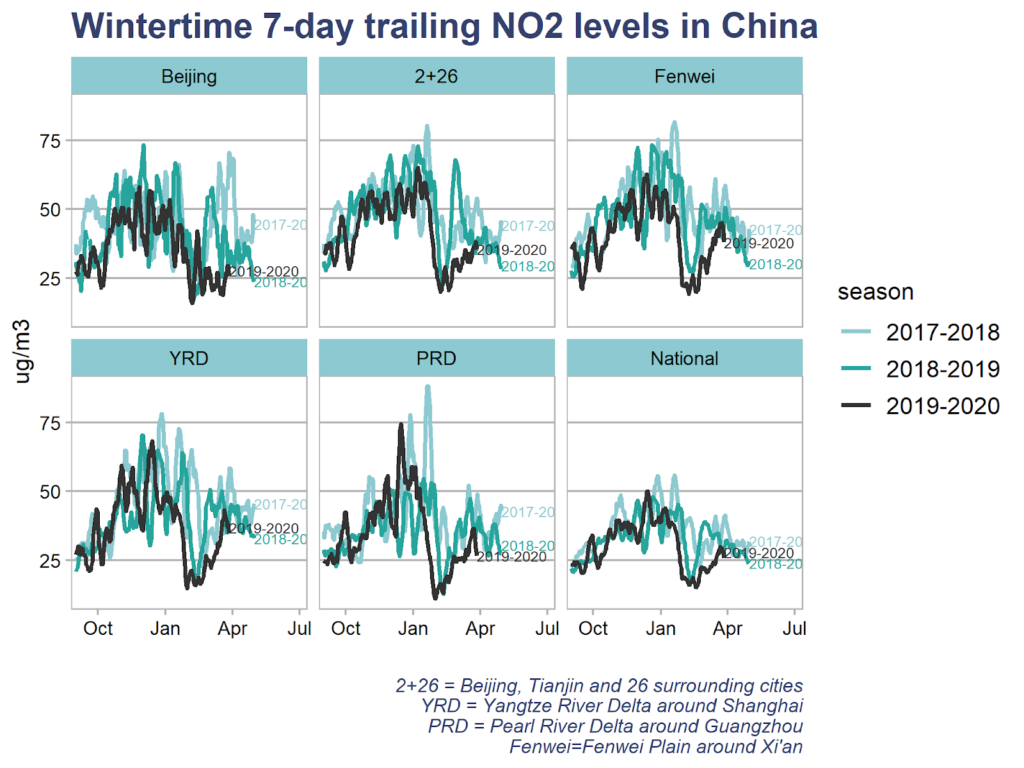
There is further confirmation of the reduction in fossil-fuel use in satellite measurements of NO2, an air pollutant closely associated with fossil-fuel burning. In the week after the 2020 Chinese new year holiday, average levels were 36% lower over China than in the same period in 2019, illustrated in the right-hand panels below.
Demand-side impacts
Although the short-term impact of the current crisis is large, in terms of reduced energy demand and industrial emissions, the longer-term direct effect of factory closures could be much more limited.
Apart from the annual Chinese new year holiday, shutdowns of a week or more are not uncommon in China.
Moreover, shaving 25% off energy consumption and emissions for two weeks would only reduce annual figures by around one percent. China also has very substantial overcapacity in all of the major CO2 emitting industries, meaning production volumes – and emissions – can catch up rapidly after a shutdown, if the demand is there.
Any sustained impact on fossil-fuel use would come from reduced demand, which initial indicators suggest could have a major impact. For example, February car sales are forecast to fall by 30% below last year’s already depressed levels.
If consumer demand is reduced – for example, due to unpaid wages during the crisis cascading through the rest of the economy – then industrial output and fossil-fuel use might not recover, even though capacity is available to do so.
Some analysts have pointed to images of empty cities and cellphone factories as evidence for such an effect, although this might give an exaggerated idea of the impact. China’s energy consumption is heavily dominated by energy-intensive industries and freight, with residential and commercial electricity consumption, private cars and so on playing a relatively minor role.
This is illustrated by the fact that Beijing experienced its second severe smog episode of the year last week, leaving many wondering where the pollution was coming from when most cars were off the road and most businesses were shut. As already noted above, steel blast furnaces in particular kept running throughout the extended holiday, while most power plants only shut a part of their boilers, at most.
Instead, the single most important question on the demand side is the effect of the coronavirus outbreak on construction activity. The sector relies on migrant workers who might still be affected by restrictions on movement, enforced home quarantine and other measures for days or weeks, so resumption of operations is not straightforward.
The key factor determining the size of this impact is how fast things return to normal.
Currently, Beijing is urging local governments to focus on getting the economy back on its feet. Chairman Xi himself has reportedly said that the coronavirus response outside the epicentre of the outbreak in Hubei province has gone too far, warning of damage to the economy and cautioning against more restrictive measures.
However, local governments continue to maintain and even tighten controls on movement and are encouraging businesses to stay shut. This suggests they are more worried about getting blamed for a new outbreak than about keeping the economy on ice for a few extra days or weeks.
Beyond the disruptions caused by the measures to combat the virus on construction sites, apartment sales are certain to be affected for weeks, if not months, due to restrictions on movement. Lowered income is likely to prompt builders to slow down and refrain from starting new projects. If financial distress results in disruption to operations, the effect could be more profound and sustained.
The impacts on downstream demand have become even clearer, with real estate sales value forecast to fall as much as 50% on the first quarter.
The potential for wider financial disruption is clear as firms, local governments – and increasingly households – have high levels of debt. Lack of cashflow during the extended shutdown is likely to make some debt unserviceable, with the country’s leading financial media Caixin calling the virus “an existential threat” to small businesses. The issue is compounded by the widespread practice of firms taking on very short-term debt to finance long-term spending.
The measures taken by China and other countries to contain the virus are also having a dramatic impact on aviation volumes. The industry data provider OAG reports reductions of 50-90% in capacity on routes departing mainland China and a 60-70% reduction in domestic flights within the mainland over the past two weeks, compared with the week commencing 20 January. Based on ICCT estimates (pdf), these flights were responsible for 17% of total CO2 emissions from passenger aviation in 2018, implying that that the on-going flight suspensions and cancellations have cut global CO2 emissions from passenger flights by around 11% (3Mt) in the past two weeks. (This is calculated by taking into account that flights arriving in China emit the same amount of CO2 as flights departing from China, and have to be reduced in equal amount.)
Government response
The leadership in Beijing appears keenly aware of the financial risks. It has been calling on banks to roll over loans and local governments to cut rents and other costs for firms, as well as on brokerages to hold or buy stocks to keep share prices from tanking.
Beyond the immediate interventions to avoid financial disruption, a forceful economic policy response is shaping up.
The background to this is that 2020 was to be the showcase year for China’s economic accomplishments, marking the achievement of the goal of “building a moderately prosperous society”, set a decade ago. Significantly lower GDP growth rates for the year would hardly fit the script.
The basic formula of Chinese economic policymaking is to take the projected growth in private consumption and net exports, and subtract them from the GDP growth target. The residual is the amount of debt-driven investment spending that is needed to hit the target.
Of these three GDP components, investment is by far the most CO2-intensive, due to the energy used to make steel, cement, non-ferrous metals, glass and other basic construction materials. If the central government were to make up for a worse outlook on consumption and exports, then it could result in an increase in CO2 emissions overall.
There are already signs this could happen, with the Politburo calling recently for “active” stimulus, including speeding up large construction projects and increasing both bank lending and government spending. The expectations of major stimulus spending are building up, with provinces reportedly preparing “wish lists” of projects to spend on, in preparation for a flood of money being available for such projects.
A return to debt-fuelled stimulus spending runs counter to the government’s aim of rebalancing the economy towards consumption. Relaxing the GDP growth target for the year would give more space to reconcile the different objectives, but Xi has signalled that the country should stick to its targets “as of now”.
The GDP growth target for 2020 will be officially set in the annual session of the National People’s Congress, which normally takes place at the start of March, but appears likely to be delayed due to the virus outbreak.
Another major uncertainty is that the initial statements about stimulus gave no indication of which sectors or what type of expenditure should be targeted. Targeting clean energy and energy efficiency investments would be a natural way to reconcile the perceived need to prop up economic growth with state-engineered spending and China’s stated ambition to be a contributor to the fight against climate change.
The clean-energy sector is currently running well below capacity as investment in non-fossil energy sources and in electric vehicles slowed in 2019.
Analysis of data from the China Electricity Council shows newly installed wind power capacity fell 4%, solar power capacity by 53%, hydropower by 53% and nuclear by 31% in the first 11 months of the year, while newly added thermal power capacity increased by 13%. After booming in the first half of the 2019, electric vehicle sales fell 32% year on year in the period from July to November.
Update: 30 March 2020
Coal consumption at power plants and oil-refinery utilisation bottomed out in early March and returned to a normal range by the fourth week of March, about seven weeks after the country was originally going to return to work, on 3 February.
Nitrogen dioxide pollution levels, measured both from NASA satellites and Chinese government stations, have also returned to normal, indicating that current emission levels both in urban areas and in industrial centres are close to pre-crisis levels.
These and other indicators of industrial activity are shown in the figure, below. Each chart’s x-axis is centred on Chinese New Year Eve, with activity in 2020 shown in red and previous years in shades of blue.
China’s consumption of refined oil products is projected to fall by 20-30% in March, relative to the same month last year. There were even more substantial reductions in February, with one oil company reporting petrol sales falling 60% and diesel by 40%. It also reported that product inventories are nearing capacity, despite cutbacks in production, a factor that will suppress future demand for crude oil even as the economy recovers.
Steel product output is still below normal levels, but inventories held in warehouses and other storage have still skyrocketed, as the chart below shows. Inventory levels doubled from December to February and are now far above the previous record, which was reached at the height of the domestic economic downturn in 2015.
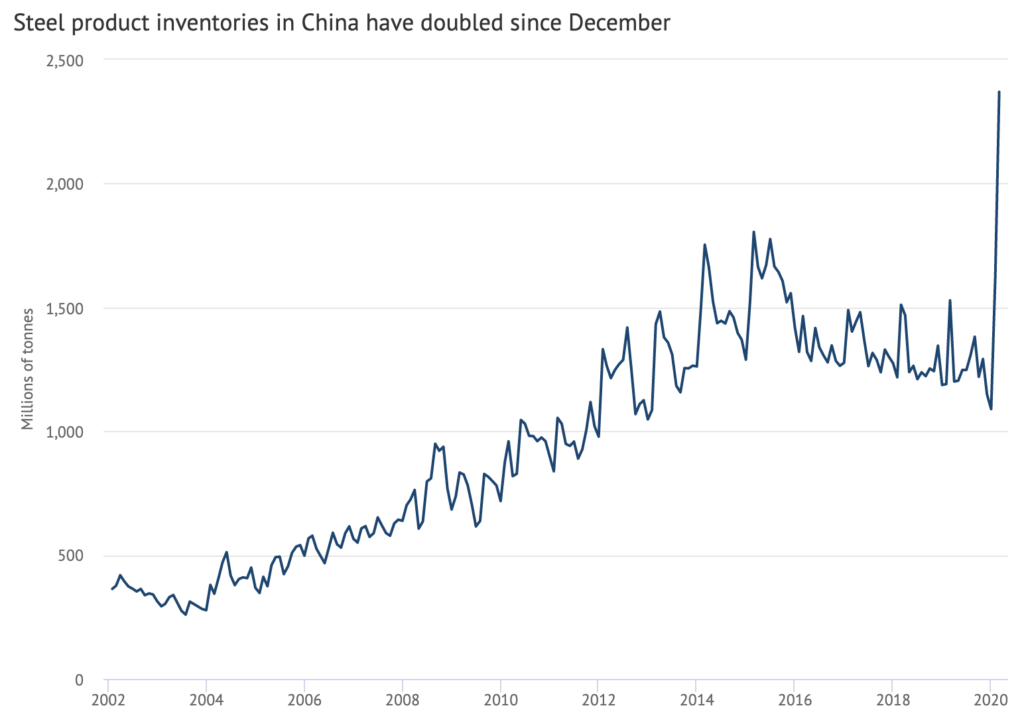
The new record steel product inventory levels suggest that steel companies may be making an all-out bet on a government stimulus causing a surge in demand. Some Chinese investors also seem to be betting on this, with Bloomberg reporting on 17 March that the price of a steel-reinforcing bar had surged even as other commodities saw steep falls.
Official data on industrial operation showed that cement output fell by 30% in the two-month period of January-February, indicating an approximately 60% reduction in the weeks after the Chinese New Year holiday.
Thermal electricity generation – largely from coal – was reportedly down by 9%, the same data shows, indicating a roughly 20% drop after the holiday. This is less than I had estimated previously, using available data which is biased towards eastern China.
Output data for other sectors was in line with my earlier estimates, given the levels of uncertainty involved.
Despite these updates to the numbers for coal generation and cement, my best estimate remains that China’s CO2 emissions were cut by 25% reduction in the four weeks after Chinese New Year, equivalent to 200MtCO2. For the first seven weeks, during which demand slowly resumed, I estimate roughly an 18% reduction, amounting to 250MtCO2.
The resumption of usual levels of economic activity, energy use and carbon emissions are supported by regional satellite data showing NO2 pollution levels around China, as seen in the figure, below.
The official data also confirms a dramatic impact on the demand side of the Chinese economy. There was a 25% reduction in fixed-asset investment – such as transport infrastructure and other construction – during the January-February period.
This uses most metal and almost all cement produced in the country, and is responsible for more than half of energy and electricity demand. The 25% cut over two months indicates at least a 50% drop during the weeks affected by the lockdown measures against the virus.
Real-estate sales fell 40% and construction starts by 44%, the data shows, indicating an almost complete halt in February. The next shock to demand will be due to the impact of the virus on the rest of the world, leading to export demand evaporating. Indeed, many manufacturers have resumed business just to see overseas orders cancelled.
China stimulus latest
The National People’s Congress meeting that approves the country’s GDP target for the year, normally taking place in early March, has been delayed until the turn of April-May, potentially giving policymakers time to assess the economic implications of the crisis.
There have been some rumours and indications that a more realistic target is being considered. For example, Chinese banks have cut their GDP forecasts, signaling shifting expectations among financial elites, and the premier Li Keqiang has played down the importance of this year’s GDP growth number, as long as the job market is stable.
However, meeting notes of the Communist Party Central Committee at the end of March again emphasised meeting “economic and social development targets”, including the goal of doubling GDP from 2010 to 2020. This would require almost 6% GDP growth in 2020.
The political bureau of the central committee indicated that a major stimulus package is underway, noting that “we must promptly study and propose a package of macroeconomic policies and measures”.
Notably, the document emphasised three hard-to-reconcile goals: the GDP growth targets; high-quality growth; and expanding the effectiveness of the measures against the virus. There was little indication of how these should be prioritised. The document makes no mention of the climate or environmental aspects of any stimulus measures.
In an indication of moves by provincial governments to expand investment and boost growth, approvals of new coal power plant projects surged in March.
The 7,960 megawatts (MW) approved for construction in just the first 18 days of the month exceed the 6,310MW figure for the entire year of 2019. This follows a loosening of the “traffic lights” policy for new coal plant permits in February.
The Chinese solar manufacturing industry appears to be preparing for a major expansion as well. From December 2019 to mid-March, some 28 different manufacturers announced plans for new factories that would be capable of producing 240 gigawatts (GW) of solar panels per year. This possibly signals the start of a new “arms race” in the sector.One of the firms, GCL Systems, stepped up the ambition in late March, filing plans with the Shenzhen stock exchange for a gigantic new plant with a capacity of 60GW per year, half of the entire current global market. These firms will be well positioned if China’s upcoming stimulus measures include a boost for clean energy.
Methodology
The estimated CO2 reduction is based on fossil-fuel consumption data by sector and fuel for February 2019, and estimating year-on-year changes using sector activity indicators: daily coal consumption at power plants; coking plant; blast furnace and steel plant operating rates; and oil refinery operating rates. Residential fuel use is assumed to be unaffected. The estimate aligns with satellite-based NO2 levels, which point to the possibility of an even larger reduction.
-
Analysis: Coronavirus temporarily reduced China’s CO2 emissions by a quarter