Analysis: Coronavirus set to cause largest ever annual fall in CO2 emissions
Simon Evans
04.09.20Simon Evans
09.04.2020 | 3:20pmThe global coronavirus pandemic continues to unfold at a staggering pace, decimating lives, livelihoods and the normal functioning of society, as well as interrupting energy demand and CO2 emissions.
Previous Carbon Brief analysis showed that the crisis temporarily cut CO2 emissions in China by 25%, with emissions still below normal more than two months after the country entered lockdown.
With dozens more countries enforcing lockdowns in response to the pandemic, a wide range of indicators show how transport use, electricity demand and industrial activity are being cut. Yet there have been few attempts, thus far, to quantify the consequences for global CO2 emissions.
- IEA: ‘Green’ coronavirus recovery would keep global emissions below 2019 peak
- Coronavirus: Tracking how the world’s ‘green recovery’ plans aim to cut emissions
- Webinar: What impact is Covid-19 having on global CO2 emissions?
- Q&A: Could climate change and biodiversity loss raise the risk of pandemics?
- Analysis: Coronavirus set to cause largest ever annual fall in CO2 emissions
- Coronavirus: What could lifestyle changes mean for tackling climate change?
- Analysis: Coronavirus temporarily reduced China’s CO2 emissions by a quarter
To date, most global estimates have been based on informed speculation, or on forecasts of reduced GDP growth. Many have also warned that emissions will quickly rebound, unless the response to the pandemic can create lasting, structural changes towards net-zero emissions.
Here, Carbon Brief gathers the latest evidence on how the coronavirus crisis is affecting energy use and CO2 emissions around the world, as a way to sense-check the GDP-based estimates.
Five key datasets and projections are identified, covering roughly three-quarters of the world’s annual CO2 emissions, including the entire output of China and the US, the EU carbon market, the Indian power sector and the global oil sector.
Carbon Brief analysis of this data suggests the pandemic could cause emissions cuts this year in the region of 2,000m tonnes of CO2 (MtCO2). Although this number is necessarily uncertain, countries and sectors not yet included in the analysis can be expected to add to the total.
Update 15 April 2020: This analysis was updated in light of new forecasts for global oil demand in 2020, which suggest a significantly larger drop this year. The original version had put the potential impact of coronavirus at 1,600MtCO2 in 2020, equivalent to 4% of 2019 emissions.
This updated tentative estimate is equivalent to around 5.5% of the global total in 2019. As a result, the coronavirus crisis could trigger the largest ever annual fall in CO2 emissions in 2020, more than during any previous economic crisis or period of war.
Even this would not come close to bringing the 1.5C global temperature limit within reach. Global emissions would need to fall by some 7.6% every year this decade – nearly 2,800MtCO2 in 2020 – in order to limit warming to less than 1.5C above pre-industrial temperatures.
To put it another way, atmospheric carbon levels are expected to increase again this year, even if CO2 emissions cuts are greater still. Rising CO2 concentrations – and related global warming – will only stabilise once annual emissions reach net-zero.
Update 30 April 2020: The International Energy Agency has forecast the CO2 impact of the crisis, suggesting emissions could fall by 8% this year, some 2,600MtCO2. It draws on more recent data and covers 100% of global emissions, whereas Carbon Brief’s estimate was based on information covering only around 75% of the total.
Emissions data challenges
It is important to stress before explaining Carbon Brief’s analysis that there are many challenges when it comes to estimating the impact of the coronavirus pandemic on global emissions in 2020.
The most significant of these are timely data availability, attribution of any changes to coronavirus, and the huge uncertainty over the path and duration of the crisis.
For example, UK data on demand for petroleum products is published monthly, but the figures for January were only released at the end of March. Similarly, the 20 March release of UK tax data – including fuel duty receipts reflecting road-traffic volumes – only covers the month of February.
Estimates of annual global CO2 emissions are usually first published by the Global Carbon Project (GCP) in November or December of the year in question, but more definitive figures only arrive the following spring. Official emissions inventories can take years to be finalised.
The US Energy Information Administration (US EIA) publishes national energy data and emissions estimates only a few weeks in arrears. Yet in its 8 April weekly report on oil markets, it notes that, on a global basis, “real-time data remain limited”.
Robbie Andrew, senior researcher in climate economics at the CICERO Center for International Climate Research in Norway and a contributor to the GCP, tells Carbon Brief:
“We get frequently updated economic stats, but environmental stats are just occasional. How would it change the way we think if, every time economic stats were published, there were environmental stats updated alongside?”
In terms of attributing any changes to the on-going pandemic, a long list of confounding factors cloud the picture. This means it is hard to attribute a changing indicator solely to coronavirus, given multiple reasons why fossil-fuel demand in March 2020 might have fallen, relative to the same month in previous years.
The mild winter across Europe and North America has cut demand for heating in the first quarter of the year, for example, making it cheaper to burn gas for power and industry. Temperatures also affect electricity demand. Adjustments to account for this are possible, but add complexity.
Renewable capacity was already rising, eating into the market share of fossil fuels, while sunny and windy weather has boosted the output of existing windfarms and solar parks relative to last year.
These trends, combined with low gas prices that were also unrelated to coronavirus, mean coal-fired electricity was already plummeting in many countries – and was expected to continue doing so.
As a practical example, German electricity got much cleaner in the first quarter of 2020, cutting emissions by 20m tonnes of CO2 (MtCO2). But only a quarter of this (5MtCO2) was due to the pandemic, according to analysis from the thinktank Agora Energiewende.
German power market developments in Q1 2020:
— Philipp Litz (@PhilippLitz) April 1, 2020
Renewables +14%
Nuclear -18%
Lignite -33% (!)
Hard Coal -44% (!)
Gas +/-0
Demand -3%
Exports -43% (!) https://t.co/oweWgLzX3U pic.twitter.com/wiglFSGGAr
Second-order effects add to this already complicated situation. The drop in oil demand due to the pandemic is being compounded by a price war, in which Saudi Arabia and Russia have raised their output. This means oil prices are tumbling, as are those for gas, because of oil-linked contracts.
Finally, the unprecedented nature of the current crisis makes all forecasts and predictions even more than usually susceptible to being wrong. The duration of the crisis and the timing of lockdowns being lifted are particularly uncertain.
In its latest short-term projections, the US EIA says that it expects the biggest hit to oil demand in the second quarter of 2020, but that the reduction will only “gradually dissipat[e] over the course of the next 18 months”. Its outlook notes:
“Although all market outlooks are subject to many risks, the April edition of EIA’s Short-Term Energy Outlook is subject to heightened levels of uncertainty because the impacts of the 2019 novel coronavirus disease (Covid-19) on energy markets are still evolving.”
Marcus Ferdinand, head of European carbon and power analytics for data provider ICIS, published one early analysis on 24 March, looking at how coronavirus would affect the EU Emissions Trading System (EU ETS). This covers EU emissions from electricity generation, industry and aviation.
Ferdinand told Carbon Brief on 3 April that while electricity sector data is “relatively good” and despite reasonable proxies being available for transport, there was still a lot of “guesswork” involved at this stage, particularly around the unknown depth and duration of the crisis.
His analysis started by looking at the effect of the 2008-9 global financial crisis, then drew on a mixture of hard data and news reporting of planned measures to extrapolate onto the current situation. He described the effort as a “first impact assessment” that would need to be refined as more data became available. Ferdinand told Carbon Brief on 3 April:
“I’m humble enough to know that I’m wrong. And I think every forecast, in this case, is wrong – unless there is pure luck – because there’s so many unknowns. So I think what we painted here is one potential scenario of what could happen, if the circumstances were as we described them. If the circumstances are different – which we will find out when we get more and more data – then we will need to adjust our analysis.”
Despite all of these challenges, there is plenty of data to draw on that points to significant – though uncertain – changes in CO2 emissions, as a result of the coronavirus crisis.
Estimated impact on global emissions
In order to start building up a global picture of how the pandemic is affecting energy use and emissions, Carbon Brief has been gathering evidence from a wide range of sources.
The information includes direct data, proxy indicators, news reports and third-party forecasts. It covers road-transport demand, aviation, industrial activity, economic output, electricity demand, air pollution, atmospheric carbon and other relevant markers.
In some countries and sectors, notably international aviation, the impact of the current crisis is so severe and dramatic that there can be little doubt it is due to other factors. Even so, a number of assumptions are needed to translate flight cancellations into tonnes of CO2.
Amazing change in aviation traffic. March ‘19 vs ‘20 pic.twitter.com/ZCuWKJnFGD
— Sam Morgan (@SamJamesMorgan) March 25, 2020
Not all of the information can so easily be translated into impacts on emissions. For example, proprietary global traffic data, produced by satnav maker TomTom and tracked by the Financial Times, shows that road use has evaporated in many cities under lockdown. But this city-by-city “congestion index” does not directly correspond with overall transport fuel use.
Similarly, the “truck-toll-mileage index”, published by the German Federal Statistics Office, shows an unprecedented 5.9% monthly fall in goods traffic in March 2020. This only corresponds to one part of German road-transport demand, but also offers a glimpse of the impact on industrial activity.
Ferdinand tells Carbon Brief the index “has a strong correlation with German industry production”, meaning it can provide “some early hints” regarding how economic activity will develop.
So far, five sets of data and existing analysis stand out as offering strong, timely and quantifiable evidence of the coronavirus crisis cutting global CO2 emissions in 2020. These cover the global oil sector, the EU ETS, India’s electricity sector and the entire economies of the US and China.
More detail on all of the pieces of evidence gathered so far will be added to this article over time, with a particular focus on the key countries and sectors highlighted here. (Details of the estimate for China are contained in previously published Carbon Brief analysis; the EU ETS analysis is explained in detail in a report by ICIS analyst Marcus Ferdinand.)
Together, these five areas account for the large majority of annual global CO2 emissions, some three-quarters (76%) of the total in 2018, according to Carbon Brief analysis of data from ICIS and the International Energy Agency (IEA) World Energy Outlook 2019.
The chart below shows the combined estimated impacts for these five areas in red, alongside an illustrative range (grey bars) showing what a 1, 3 or 5% drop in annual emissions would look like in 2020. Below the dotted line, in blue, are the five largest annual falls ever recorded prior to this year.
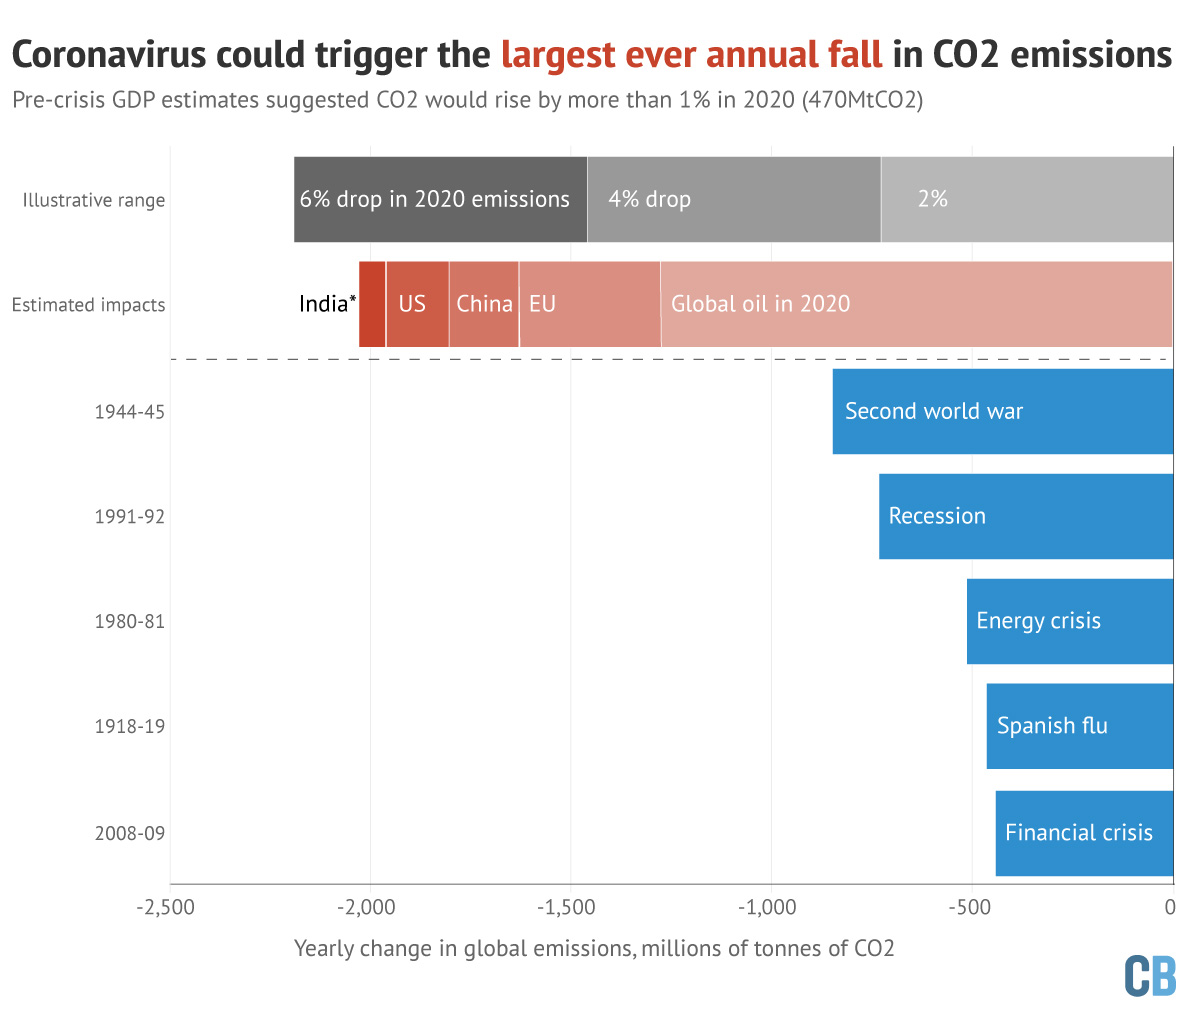
The five largest falls in annual global CO2 emissions ever recorded are shown in blue bars, in millions of tonnes of CO2. The grey bars illustrate how far emissions would fall in 2020 under a 2%, 4% or 6% reduction compared to 2019 levels. The red bars show estimated emissions impacts of the coronavirus crisis in 2020 on the global oil sector, the EU carbon market, China, the US and India, with the latter only accounting for changes in the power sector. Where possible, estimates are shown relative to pre-crisis forecasts. Geographical estimates exclude oil. Source: Carbon Brief analysis of emissions data from the Carbon Dioxide Information Analysis Centre (CDIAC) and the Global Carbon Project; analysis of assessments from ICIS and the US Energy Information Administration; analysis of daily data from India’s Power System Operation Corporation (POSOCO). Chart by Carbon Brief.
As if to emphasise the fast-moving and uncertain nature of the current situation, consultancy Rystad Energy published a significantly updated estimate of the impact on global oil markets on 8 April, after Carbon Brief’s initial analysis had already been finalised.
Whereas the firm had earlier been aligned with the latest US EIA outlook of a roughly 5% decline in oil demand this year, it now expects a much larger 9.4% reduction for the year. Subsequently, on 15 April, the International Energy Agency (IEA) updated its outlook for oil in 2020, such that it now expects a 9.3% decline for the fuel, similar to the forecast from Rystad.
These more dramatic oil-sector forecasts have now been incorporated into Carbon Brief’s analysis. They increase the global oil-sector component of CO2 emissions cuts this year from the 800MtCO2 in Carbon Brief’s initial analysis to 1,300MtCO2.
Carbon Brief’s estimated coronavirus impact on emissions in 2020 is uncertain and incomplete, but amounts to some 2,000MtCO2 this year. This is already roughly 5.5% of global emissions in 2019. (The initial analysis had put the figures at 1,600MtCO2 – 4% of 2019 emissions.)
However, a coronavirus impact equivalent to 5.5% of global emissions will not automatically equate to a 5.5% reduction in 2020. This is because, where possible, the country and sector impact estimates are made relative to “what would have happened without the crisis”.
Pre-crisis estimates of GDP growth suggested CO2 output might rise by around 1% – nearly 500MtCO2 – in 2020. But even if this previously expected growth is deducted from the estimated coronavirus impact, the 2,000MtCO2 effect is so large that it would still result in the largest annual fall in CO2 emissions ever recorded, in records going back to the 18th century.
By way of comparison, the largest annual reduction to date was the 845MtCO2 fall in 1944-45, at the tail-end of the second world war. The decline after the financial crisis of 2008-09 ranks only fifth, at 440MtCO2, and was followed a year later by a stimulus-driven 1,612MtCO2 increase.
To put the potential 2020 coronavirus effect in a broader climate context, it is worth adding that global emissions would need to fall by some 7.6% every year this decade – nearly 2,800MtCO2 in 2020 – in order to limit warming to less than 1.5C above pre-industrial temperatures.
(These percentages are taken from the 2019 UNEP gap report, which draws in turn on the Intergovernmental Panel on Climate Change (IPCC) special report. This found that global emissions in 2030 needed to be 45% below 2010 levels, in order to limit warming to 1.5C.)
Such a rapid rate of annual emissions cuts would be extremely hard to sustain for a decade. The structure of the global economy could continue its slow shift towards lower emissions per unit of GDP – in which case economic output would need to fall by 5% per year. Or GDP could continue to rise if accompanied by rapid and structural shifts towards lower-carbon economies.
If negative emissions technologies are excluded or fail to become available at scale, then the required emissions reductions for 1.5C would be even higher, at 15% every year until 2040.
Even the less stringent 2C limit would require sustained, annual cuts in global emissions of 2.7%, according to UNEP’s gap report, a level equivalent to around 1,000MtCO2 in 2020.
Finally, the nature of the global “carbon budget” means that atmospheric carbon concentrations and global temperatures will continue to rise unless and until annual emissions reach net-zero.
Even if there is a slight decrease in global fossil CO₂ emissions in 2020, the atmospheric concentration of CO₂ will continue to rise.
— Glen Peters (@Peters_Glen) March 16, 2020
The atmosphere is like a (leaky) bathtub, unless you turn the tap off, the bath will keep filling up with CO₂…https://t.co/kxzL219KMZ pic.twitter.com/6mjfw1DM26
Even a 10% fall in global fossil-fuel emissions would see some 33,000MtCO2 pumped into the atmosphere in 2020, a higher total than in any year before 2010. Any emissions cuts in 2020 alone will, therefore, have little impact, unless they are followed by longer-lasting changes.
GDP growth and carbon intensity
Carbon Brief’s bottom-up analysis of the emissions impact of the pandemic can be compared with more simplistic estimates based on what has been, to date, the most widespread approach.
These estimates have used the statistical relationship between annual CO2 emissions and the growth in economic output, coupled with revised forecasts for global GDP in 2020.
CO2 emissions and economic output are closely correlated and the ratio of the two – known as the “carbon intensity” of GDP – only changes slowly. When the carbon intensity of GDP is falling, this is often referred to as a “decoupling” of economic growth and emissions.
However, there is little reason to expect the coronavirus crisis to accelerate climate-friendly decoupling, unless post-pandemic recovery efforts make that shift a priority.
Instead, the current crisis may only temporarily cut emissions. Once shuttered factories reopen, commuters get back into their cars and flights once again take to the air, little will have changed in the structure of the global economy – and progress towards net-zero will likely be as slow as ever.
Here’s my latest: Coronavirus could halt the world’s emissions growth. Not that we should feel good about that. w/ @chriscmooney + @brady_dennis
— John Muyskens (@JohnMuyskens) March 6, 2020
https://t.co/SG6KbVmXKF pic.twitter.com/IvFoLbgFCs
Further issues include that GDP forecasts are inherently uncertain in such an unprecedented crisis and that the economic impacts of the pandemic are highly uneven across sectors, potentially breaking the usual relationship between GDP and emissions.
Ferdinand told Carbon Brief on 3 April that using the statistical relationship between economic output and CO2 emissions for the current crisis was “not the most viable” approach. He said:
“It’s systematically different compared to what we have seen in the past and it’s hitting some sectors much harder than others. I mean it’s disruptive, right, what we see at the moment, and whenever there is disruption in place, it’s difficult to use well-established statistical relationships. Because disruption usually doesn’t care about that.”
Despite all these caveats, there are now a plethora of forecasts of how global GDP growth will be reduced by the crisis, offering a simplistic window into the potential scale of global emissions cuts.
Whereas pre-pandemic forecasts had put global economic growth this year at around 2.5-3%, revised estimates now see GDP rising much more slowly, or even shrinking by as much as 9%.
In early January 2020, for example, the World Bank issued what read at the time as a gloomy projection for the year ahead. It said that “downside risks predominate” and that, as a result, global GDP growth would only reach 2.5% in 2020, up marginally from 2.4% in 2019.
If this forecast had proved accurate, and if the amount of CO2 associated with each unit of GDP had continued to improve in line with recent trends, then global emissions would have risen by some 1.3% to 37.1GtCO2. This would have been an increase of nearly 500MtCO2.
Does a low GDP growth rate (e.g., economic crisis) give a smaller decrease in carbon intensity (CO₂/GDP)?
— Glen Peters (@Peters_Glen) March 30, 2020
Not necessarily…
This is for context on using GDP growth to estimate CO₂ emissions in 2020. See https://t.co/Sqbycd40BB pic.twitter.com/sfi4OZlzrr
The post-pandemic economic outlook remains extremely uncertain, due to the unknown duration and severity of lockdown controls and doubts over the shape of the recovery.
(Economists describe post-crisis recoveries by the shape of the global GDP trajectory. Most initially expected a “V-shaped” recovery, seen after previous global epidemics, meaning the drop in GDP would be quickly recovered as economies rebound. More prolonged “U-shaped” and “L-shaped” recoveries were initially seen as less likely, but market expectations are shifting.)
Forecasts published in early March have more recently been replaced with far more pessimistic numbers.
On 2 March, the Organisation for Economic Cooperation and Development (OECD) published an “interim economic assessment” saying that global growth might be cut by as little as half a percentage point, to 2.4%, compared with its pre-crisis forecast of 2.9%.
By 26 March, the organisation had dramatically revised its forecast, saying that each month of strict containment measures – ”with no offsetting factors” – would cut the increase in global economic output by around two percentage points.
The OECD said a three-month lockdown could see annual GDP growth some 4-6 percentage points lower than it would otherwise have been. Given its pre-crisis forecast of 2.9% growth in 2020, this could translate into a global economic contraction of up to around 3% for the year.
Similarly, consultancy Oxford Economics said in early March that global GDP growth would be just 0.5 percentage points lower in 2020, at 2.0%, relative to its pre-crisis outlook of 2.5%.
By the time it published a “March/April forecast”, it was expecting 0% growth, described as its “largest-ever forecast revision over two months”. It added that given “huge uncertainty” it also saw potential for the global economy to “enter outright contraction in 2020, with GDP falling 1.3%”.
Based on a range of GDP forecasts available at the time, analysis from the Breakthrough Institute published on 26 March said global emissions might fall by between 0.5% and 2.2% in 2020, shown in the tweet below.
There are huge uncertainties about the impacts of COVID-19 on 2020 CO2 emissions. If forecasts of GDP changes are accurate – and the global economy bounces back in Q3/Q4 2020 – we’d expect declines of 0.5% to 2.2%: https://t.co/OhxGraACPm 1/5 pic.twitter.com/a8zVcxcRyX
— Zeke Hausfather (@hausfath) March 26, 2020
However, GDP forecasts have continued to worsen. A 23 March update from the UK-based Centre for Economic and Business Research (CEBR) said the pandemic would cause the “worst economic crisis since the 1930s”, arguing that global GDP would “shrink by at least 4.0% over 2020 before rebounding to growth of 3-4% in 2021”.
The April 2020 edition of the International Monetary Fund’s World Economic Outlook puts the contraction in global GDP this year at 3%, pointing to the risk of “even more severe outcomes”. (Notably, it suggests growth will rebound sharply in 2021, with GDP rising 5.8%. This would be likely to mean a large increase in global CO2 emissions next year.)
One of the gloomiest GDP outlooks to date is an 8 April analysis from the World Trade Organization (WTO). It outlines the “wide range of possibilities” for global trade flows, which it says might fall by between 13% and 32% in 2020. The analysis adds:
“WTO economists believe the decline will likely exceed the trade slump brought on by the global financial crisis of 2008‑09. Estimates of the expected recovery in 2021 are equally uncertain, with outcomes depending largely on the duration of the outbreak and the effectiveness of the policy responses.”
In its “pessimistic scenario”, the WTO says global GDP could fall by as much as 8.8% in real terms during 2020, before bouncing back with growth of 5.9% in 2021.
Bloomberg says this scenario would be the “most precipitous drop in global commerce since the Great Depression”. It also quotes International Monetary Fund chief Kristalina Georgieva, saying the world is already in a recession that is “way worse than the global financial crisis”.
A global GDP cut of nearly 9% this year, as outlined by the pessimistic WTO scenario, can be compared with the 1.7% contraction in the wake of the global financial crisis.
Based only on the historical relationship between GDP and CO2, this would translate into a near-10% cut in CO2 emissions in 2020 – a fall of more than 3,600MtCO2 – which is more than double the 2,000MtCO2 figure from Carbon Brief’s bottom-up analysis.
-
Analysis: Coronavirus set to cause largest ever annual fall in CO2 emissions