Analysis: UK solar generation tops coal for the first time
Simon Evans
04.13.16Update 10/5/16 – The UK has passed another milestone, generating more electricity from the sun than coal, over the course of a full week between Tuesday 3 and Monday 9 May. The remainder of this article has not be updated.
The UK’s solar panels have generated more electricity than coal in a full day for the first time ever, Carbon Brief analysis shows.
On Saturday 9 April, solar generated 29 gigawatt hours (GWh) of electricity, 4% of the total used that day and more than the 21GWh output from coal (3% of demand). This pattern was repeated on Sunday, with solar (6%) outpacing coal (3%).
The milestone is largely symbolic. Solar output had already started regularly topping coal during the middle of the day. And it has yet to overtake coal across a full week, month or year.
Nonetheless, this first for solar does reflect the major shifts going on in the UK electricity system.
Coal collapse
Last weekend’s solar breakthrough could not have happened without the increase in solar capacity (see below). However, an ongoing collapse in coal generation was the more immediate cause.
UK coal use has been falling fast since 2012. In 2015, coal generation fell to its lowest level since the 1950s, though it still accounted for more than 10% of UK electricity supplies on every single day of the year.
In 2016, coal has supplied less than 10% of UK electricity on 18 of 102 days, including every day in April so far. Coal has probably never supplied such a small share.
Years with miners’ strikes are a possible exception, though daily data is not available before 2009 and even in 1984 coal remained the UK’s number one source of electricity.
As coal generation falls and the days get longer, it was perhaps only a matter of time before solar would overtake coal.
Share of UK daily electricity generation in 2016
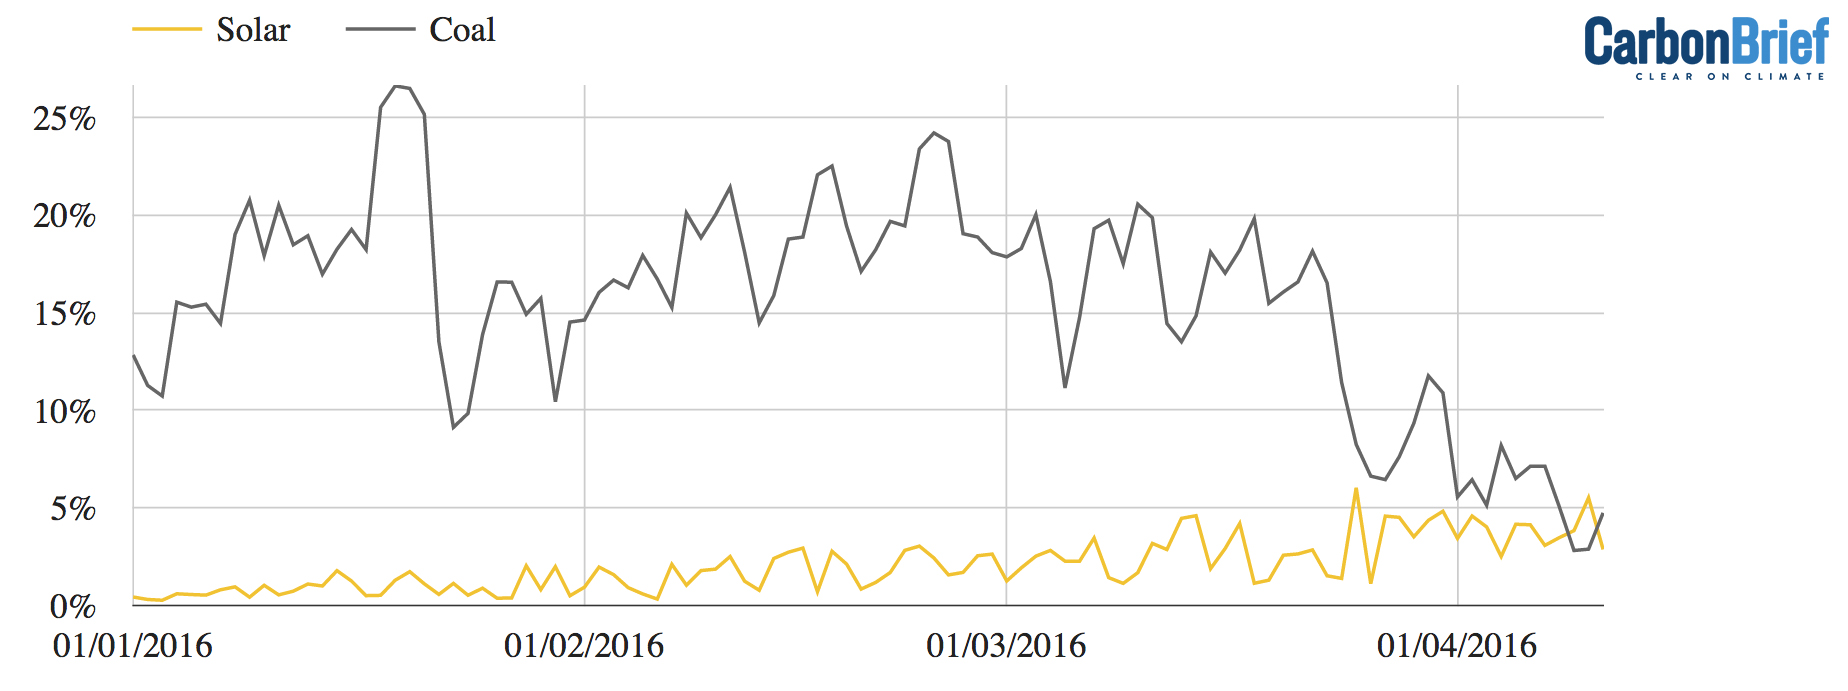
Solar share (yellow) of UK daily electricity generation, compared to that for coal (grey), during the first 102 days of 2016. This runs up to and including Monday 11 April 2016. Sources: Sheffield Solar and Gridwatch. Chart by Carbon Brief.
The most important reason for coal’s struggles is falling wholesale gas prices, down nearly 20% since the start of the year and 40% since the start of 2015. This has pushed down wholesale electricity prices.
The Guardian, reporting Carbon Brief’s analysis, carries a quote from Peter Atherton, energy analyst at investment bank Jefferies. Atherton says:
More recently, coal has also lost out to seasonal reductions in demand as warmer temperatures set in, and a series of large coal plants have shut down. The UK has pledged to phase out unabated coal generation by 2025.
Coal generation over the past fortnight was half that in the previous two-week period. Reduced demand along with increases in nuclear, solar and gas-fired generation have picked up the slack.
For more on the collapse in coal, see our countdown to the 2025 coal phase out.
Solar surge
UK solar has seen a meteoric rise in recent years. During 2015 around 4 gigawatts (GW) of capacity was added and the UK total recently hit 10GW, according to Solar Power Portal. In 2015, solar generated 2.2% of UK electricity. It was close to zero in 2011.
The capacity added last year came in a series of spurts as developers tried to complete schemes before cuts to government subsidies took effect.
The chart below shows a jump in solar power generation last April, with many new projects being finished just before the end of the tax year. You can also see that solar output varies predictably across with the seasons, as you would expect.
UK solar electricity generation
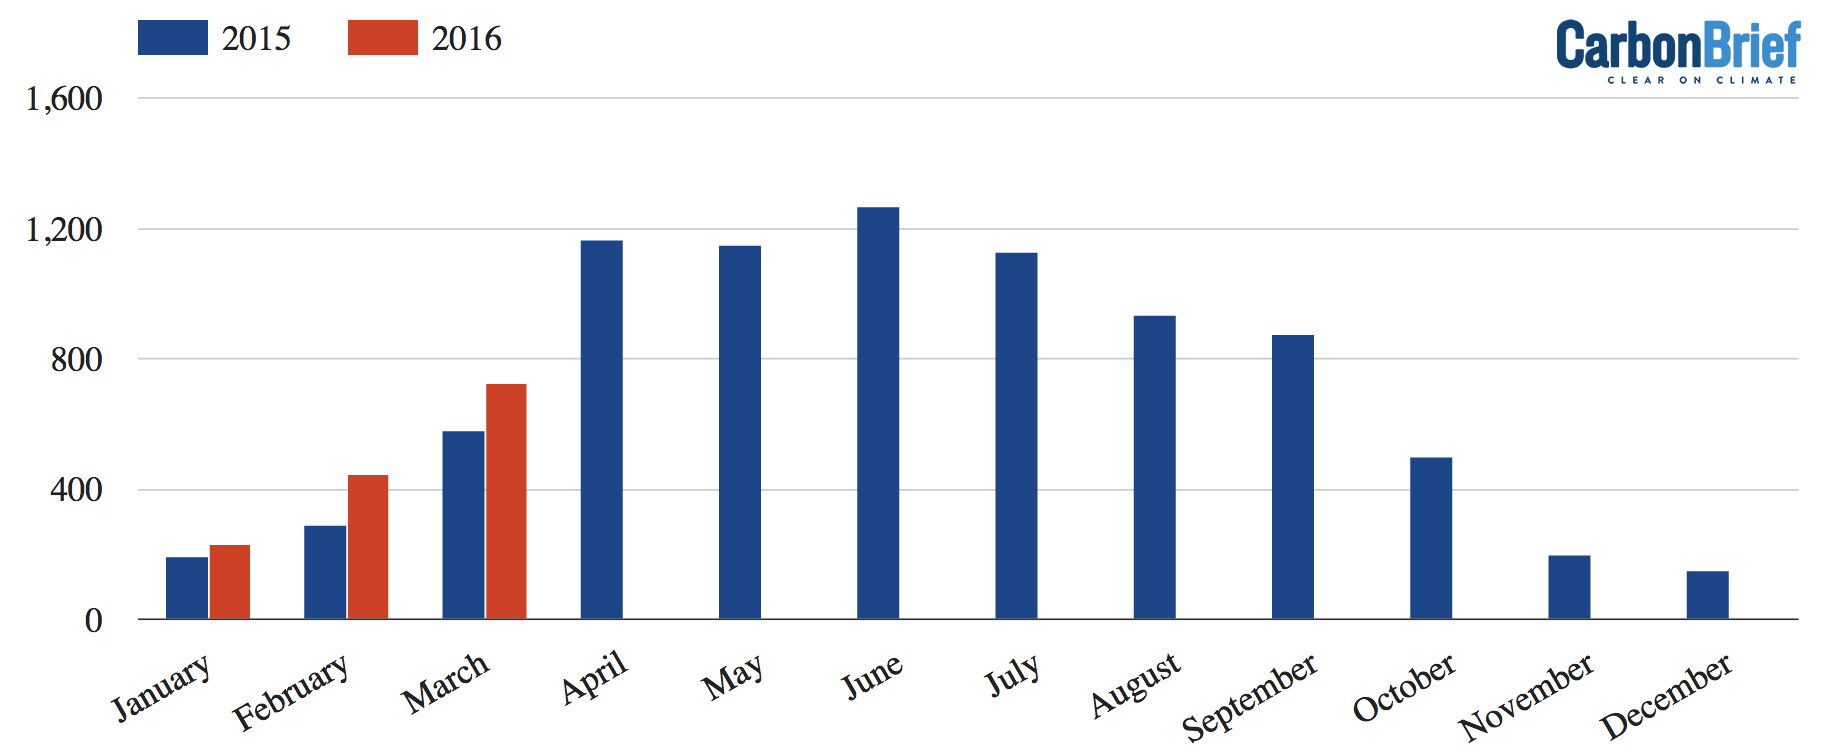
Electricity generated by UK solar during 2015 and the first three months of 2016, gigawatt hours (GWh). Source: Sheffield Solar. Chart by Carbon Brief.
Note, too, that output in the first quarter of 2016 is up 20-50% on the previous year. This reflects the rush to build solar in April 2015, along with variations in the weather.
However, domestic installation rates have plummeted over the past two months after a 65% subsidy cut took effect. A pipeline of solar farms catching the tail end of more generous rates for larger schemes could continue for another year, Liam Stoker, editor of Solar Power Portal, tells Carbon Brief.
Generation mix
Solar and other renewables combined to become the UK’s second largest source of electricity last year, overtaking coal in the process. Within that, wind and biomass are the largest sources of renewable power.
The UK’s electricity system is changing rapidly from a collection of large, centralised power stations into a more distributed mix that includes thousands of smaller sites.
The chart below shows how the electricity generation mix has varied since the start of 2016. You can see coal’s share collapsing since Easter.
Share of electricity generation in 2016
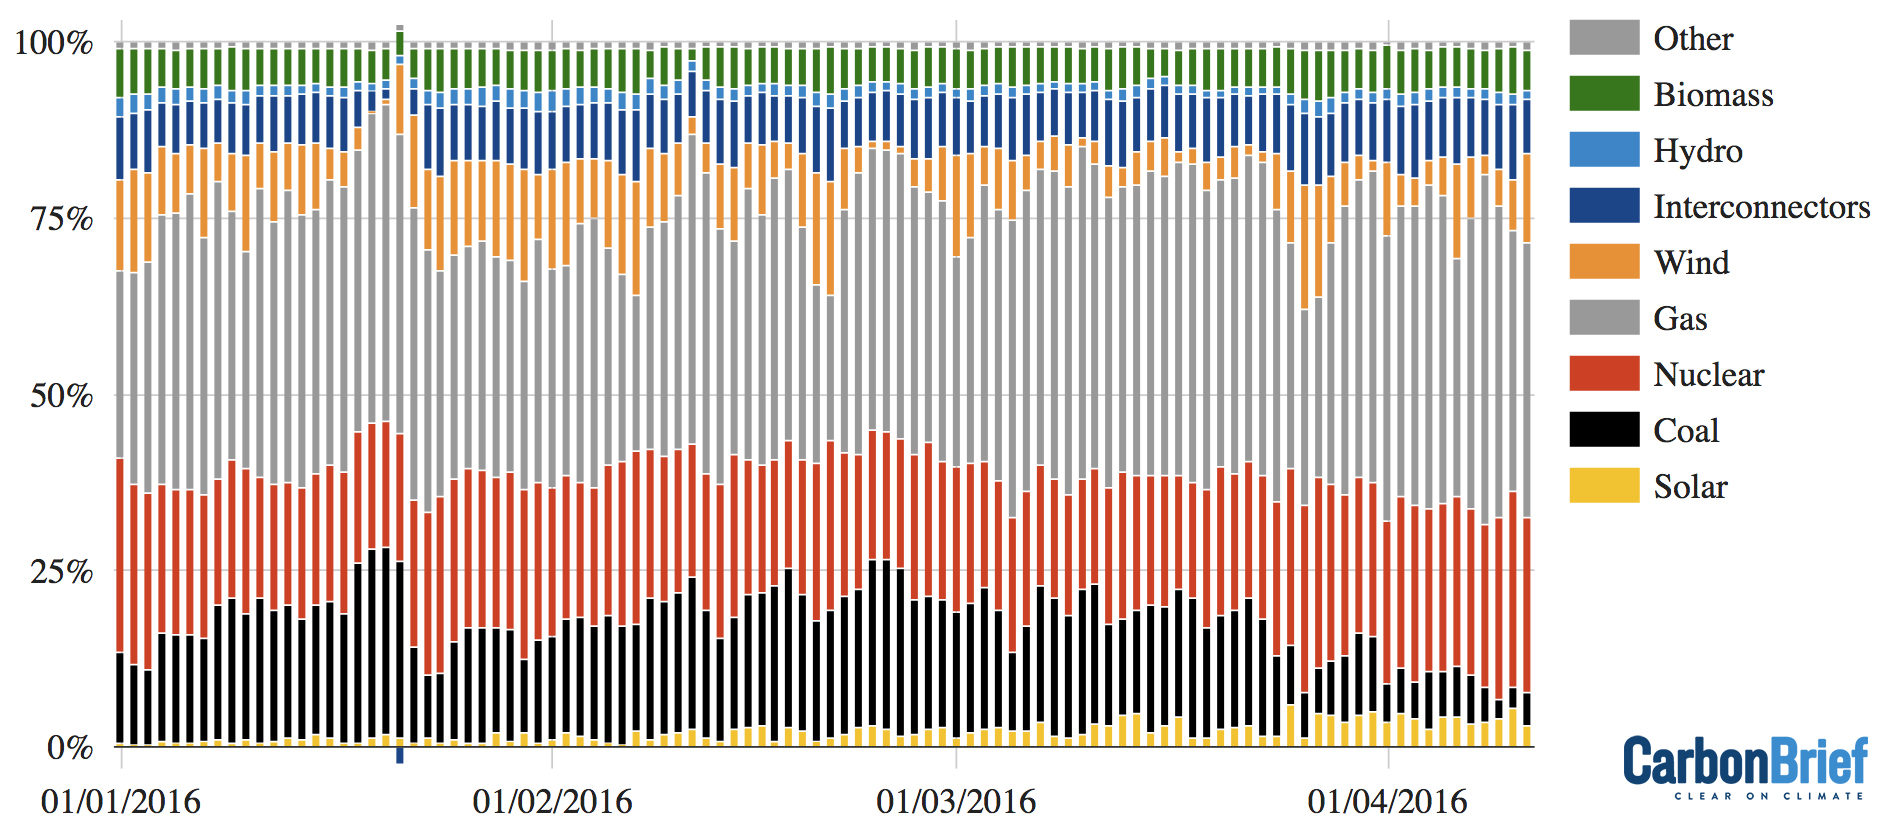
Share of electricity generated by different sources since the start of 2016 (%). The blip in late January reflects a day when the UK was a net exporter of electricity. Note that this data does not include distributed wind or biomass generation. Source: Sheffield Solar and Gridwatch. Chart by Carbon Brief.
Renewables supplied 22% of electricity in the first quarter of the year, according to energy information provider EnAppSys. This was slightly below the 25% share of electricity generated by renewables across 2015.
Other sources of electricity in Q1 2016 were gas (35%), nuclear (19%), coal (16%) and imports via interconnectors to France and the Netherlands (7%).
Note on methods: Data on electricity output in each 5-minute period is publicly available from BM Reports. This information is compiled in an accessible format by Gridwatch. This data only records centrally-metered generators, which do not include solar sites.
Sheffield Solar, a project of the University of Sheffield supported by the National Grid, uses the output from 290 sites across the UK to estimate total solar generation in half-hourly periods. Historical data is available to download.
Carbon Brief has combined these data sources to compare solar and coal’s shares of electricity generation. Our figures do not include small wind and biomass sites because comparable data is not publicly available.
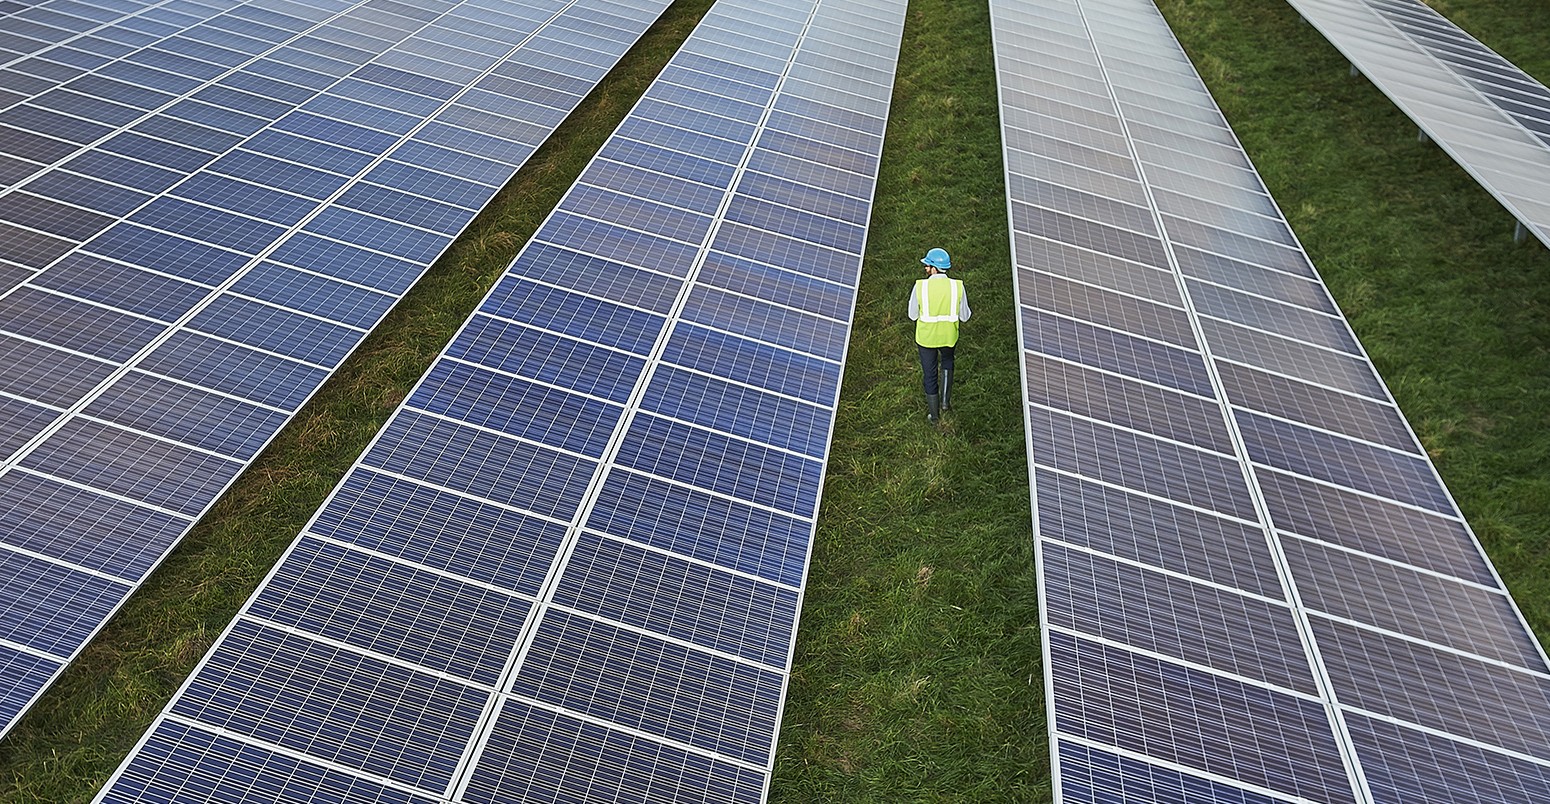
Main image: Aerial view of an engineer in high vis jacket and blue hard hat surveying a solar farm, 27 Jan 2012, UK.
-
Analysis: UK solar generation tops coal for the first time - Carbon Brief
-
UK's solar panels have generated more electricity than coal for a full day for the first time ever