Arctic sea ice winter peak in 2022 is 10th lowest on record
Ayesha Tandon
03.22.22Arctic sea ice has reached its maximum extent for the year, peaking at 14.88m square kilometres (km2) on 25 February. It is the 10th smallest winter peak in the 44-year satellite record.
The provisional data from the National Snow and Ice Data Centre (NSIDC) shows that this year’s Arctic maximum extent was recorded on 25 February – marking the third earliest maximum in the satellite record.
While the past six months have been fairly uneventful in the Arctic in general, the Earth’s other pole has seen a record-breaking melt season. For the first time since the satellite record began, the Antarctic extent fell below 2m km2 this year. Unusually, the Arctic winter peak and the Antarctic summer minimum occurred on exactly the same day.
The news comes as soaring heatwaves have hit both the Arctic and Antarctic at the same time. The Guardian reports that temperatures in Antarctica reached 40C above normal in places, while some weather stations in the Arctic hit temperatures 30C above normal.
Arctic winter peak
As spring arrives in the northern hemisphere and temperatures begin to rise, the annual Arctic freeze season comes to an end. Having grown throughout the winter months, Arctic sea ice reaches its peak for the year in February or March, and then begins to melt.
Using satellite data, scientists can track the growth and melt of sea ice, allowing them to determine the size of the ice sheet’s winter maximum extent and to record the size. This – along with the late-summer minimum – is a key way to monitor the “health” of the Arctic sea ice.
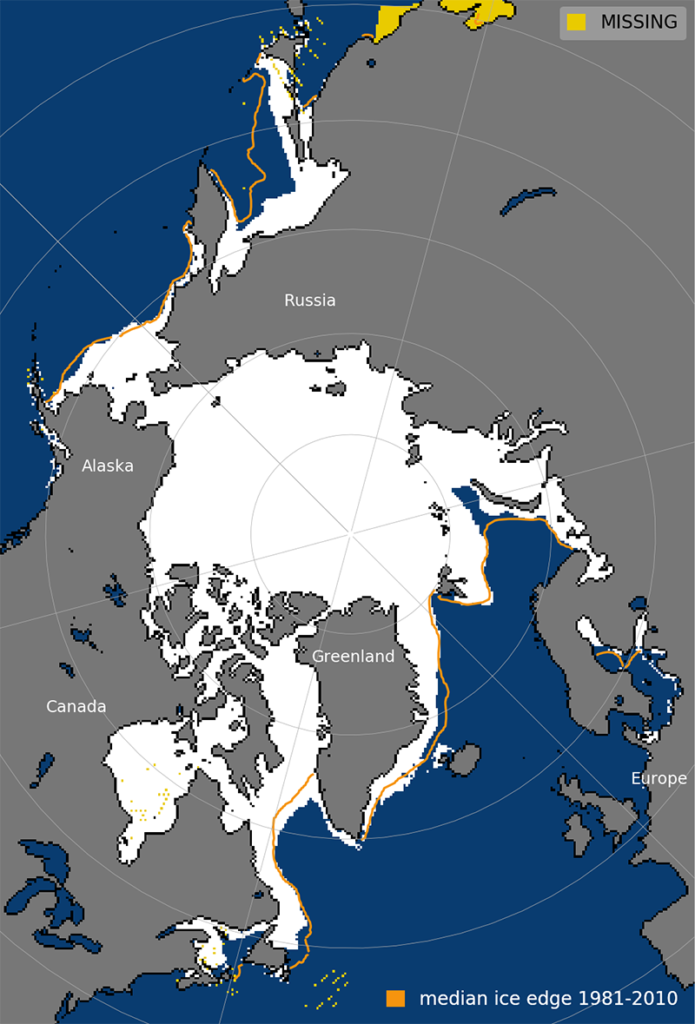
The NSIDC’s announcement says that this year’s Arctic maximum extent of 14.88m is 770,000 km2 smaller than the 1981-2010 average peak extent – ranking the 10th lowest maximum in the satellite record.
This year’s maximum extent was recorded on 25 February – 15 days earlier than the 1981-2010 average of 12 March. Only the 1987 and 1996 maxima were recorded earlier in the year – both on 24 February – the NSIDC adds.
The plot below shows Arctic sea ice extent on 25 February, with the median sea ice extent for 1981-2010 shown in yellow.
This news comes as a record-breaking heatwave hits the Arctic. The Guardian reports that “some stations near the north pole reached 30C above normal, with records broken in Norway and unusually warm temperatures recorded in Greenland and the Russian archipelago of Franz Josef Land”.
Uneventful Arctic freeze
Last year, Arctic sea ice extent reached an “unremarkable” minimum on 1 September, clocking in at the 12th lowest minimum on record.
As summer reached its close and temperatures in the northern hemisphere dropped, Arctic sea ice began to regrow – mainly in the Beaufort and Chukchi seas. Ocean temperatures remained low in this region, allowing “a quick freeze up as air temperatures dropped below freezing”, the NSIDC says.
During October, air temperatures were “well below freezing” across much of the Arctic Ocean – with the exceptions of the Barents Sea and across the North Atlantic region, NSIDC says. This allowed ice extent to increase by almost 100,000km2 per day throughout the month.
By 31 October, Arctic sea ice was tracking higher than any year since 2015, the NSIDC says:
“Ice growth was robust across the Eurasian side of the Arctic, including the East Greenland Sea, but there was little expansion of ice southwards within the eastern Beaufort Sea.”
Typically, the Hudson Bay begins to freeze up by the beginning of October, but according to the NSIDC, by the middle November 2021, only the north of the Bay was frozen. This led to the Hudson Bay area exhibiting the second lowest extent on record at this time.
“The lack of ice has potential ramifications for polar bears in the region that must wait for the bay to freeze over to hunt,” the NSIDC warned.
Meanwhile, on the opposite side of the Arctic, ice formed early along the eastern part of the Siberian coast. NSIDC notes that ships transiting through the northern sea route were caught by surprise and several became stuck in the ice.
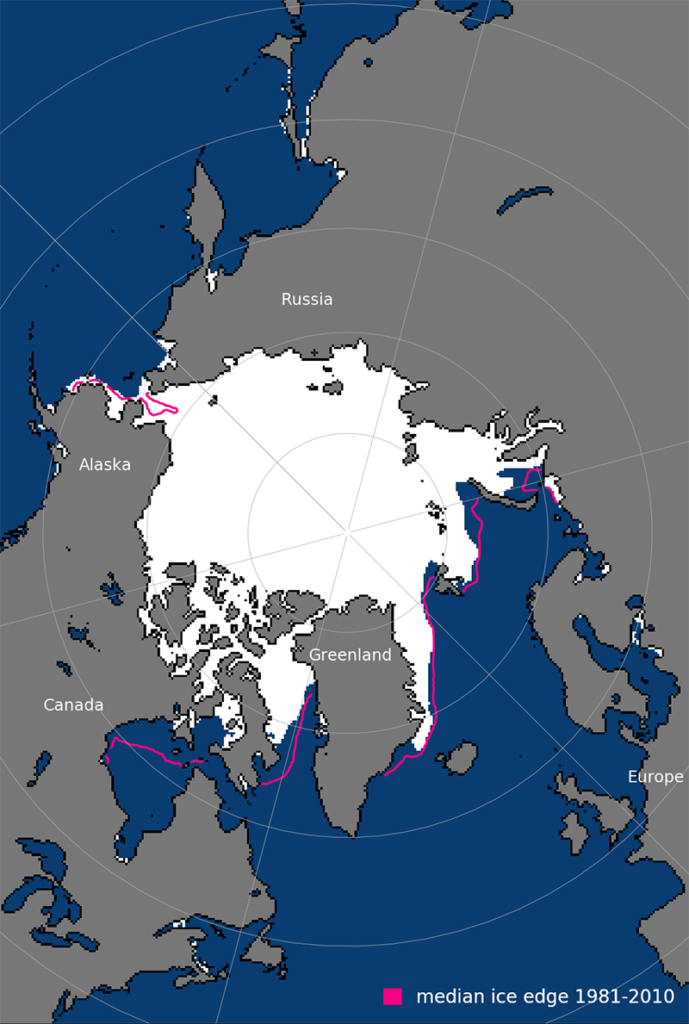
The map below shows the average Arctic sea ice extent for November 2021, compared to the November 1981-2010 average (pink). The Hudson Bay is seen towards the bottom left, along the coast of Canada.
The new year began with below average sea ice extent in the Arctic, but ice growth throughout January allowed the month to finish as the 16th lowest sea ice extent in the satellite record – above all years since 2009.
The NSIDC highlights that in the new year, lower temperatures kicked in and the upper ocean lost the heat it had gained over summer, allowing the entire Hudson Bay to freeze over by mid January.
Dr Zack Labe is a postdoctoral researcher at Colorado State University. He tells Carbon Brief that “favourable weather conditions” – associated with pressure patterns across the northern hemisphere – helped ice to expand southwards.
However, he adds that high temperature extremes were seen across parts of the Arctic. For example, highlighting that in parts of Siberia, temperatures exceeded 5C above average in February.
‘Historic’ Antarctic melt
While Arctic sea ice saw an unremarkable season, Antarctica made headlines around the world when its sea ice extent dropped below 2m km2 for the first time in a satellite record that goes back to the late 1970s.
The Antarctic recorded its annual minimum extent on the same day as the annual maximum sea ice extent was recorded in the Arctic. Labe told Carbon Brief that Antarctica’s melt season this year has been “truly historic”.
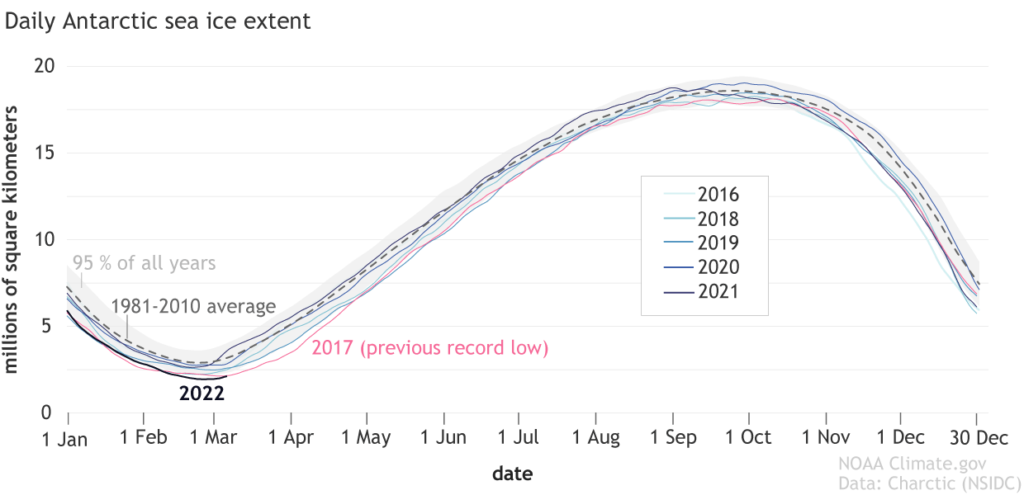
The plot below shows sea ice extent in the Antarctic over November-March, where black shows the 2022 extent, red shows 2017 extent and the dotted line shows the 1981-2010 average extent.
Antarctica saw an unusually early winter maximum sea ice extent – which was recorded on 1 September 2021. Prof Marilyn Raphael and Prof Mark Handcock from UCLA co-wrote a comment piece in Nature, explaining that the early maximum gave Antarctica a longer melt period this season, and likely contributed to its record low extent in February.
In the months following the September maximum, temperatures in the southern hemisphere increased and Antarctic sea ice extent began a “steep decline”, NSIDC says.
Antarctic sea ice was the third lowest on record by September, and reached the second lowest on record by the end of November. By January, although no individual regions in Antarctica had record-low sea ice extents, overall Antarctic sea ice was tracking as the second lowest extent on record.
According to a separate Nature article on the record minimum, strong winds pushed ice out of the Ross Sea, a bay off the coast of Antarctica, to warmer areas farther north. There, the ice broke up and melted.
On 25 February, Antarctic sea ice reached its record-breaking annual minimum extent – clocking in at 1.92m km2.
Before 2022, the previous record low Antarctic sea ice extent was recorded on 3 March 2017. The plot below shows the difference in sea ice extent during the 2017 minimum (white) and 2022 minimum (mid blue). Ice present on both dates is shown in light blue.
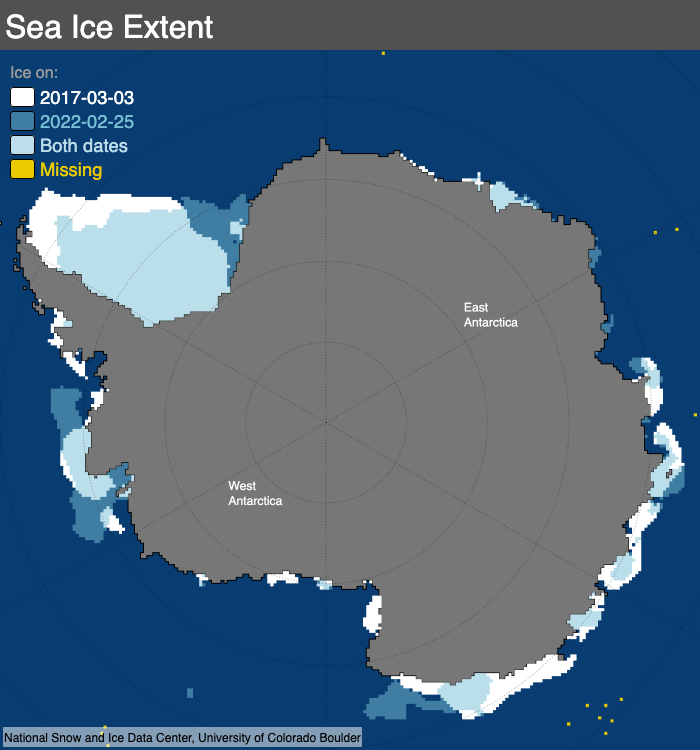
The runup to the 2022 minimum played out in a similar way to the 2017 event – the Nature article says – with an earlier than average winter maximum sea-ice extent, followed by rapid decline.
This record-breaking minimum came just weeks before an “unprecedented” heatwave hit Antarctica. The Guardian reports the Concordia station on the Antarctic Plateau hit a record temperature of -11.8C on Friday – more than 40C warmer than “seasonal norms”.
The paper adds that a major contributing factor to the high temperatures in the eastern Antarctic is an atmospheric river, which is bringing warm, moist air to the continent.
Climate change and sea ice
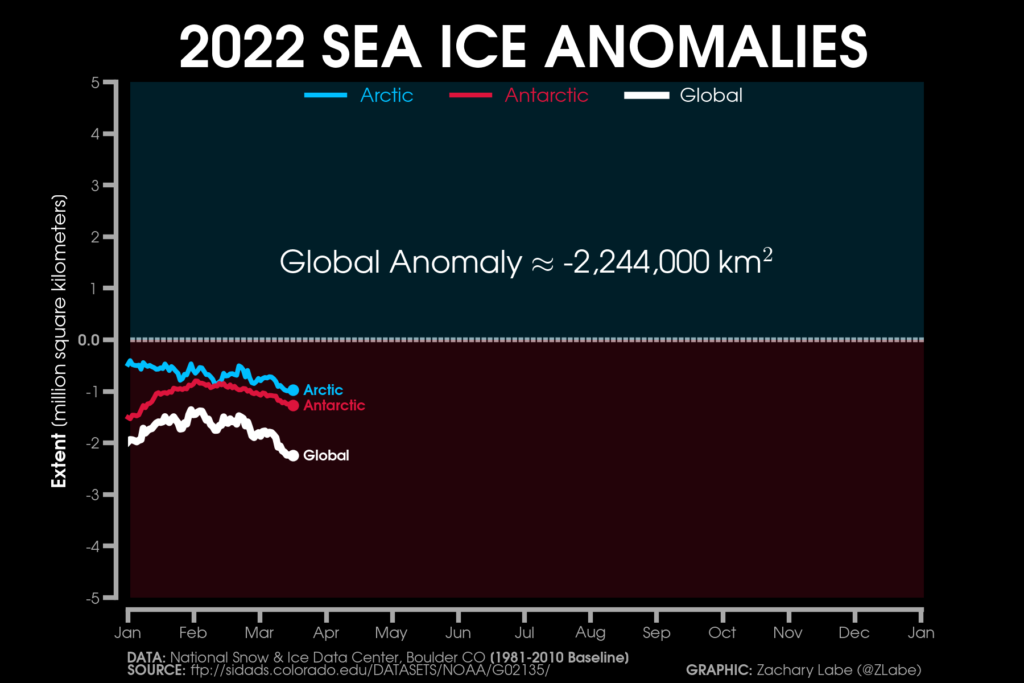
Since the start of the year, both the Arctic and Antarctic have seen below average sea ice extent – with a combined departure from the 1981-2010 average of more than 2m km2.
In the Arctic, sea ice has been declining fairly consistently throughout the satellite record as temperatures have risen, as the animation below shows.
As such, although the 2021-22 Arctic freeze season was not itself record breaking, it was “consistent with our long-term trends of Arctic climate change”, Labe tells Carbon Brief. He adds:
“Certainly, this winter was not a recovery, but just another data point in the large year-to-year variability, but overall declining trend.”
Labe also notes the pattern of thinning ice across the Arctic – highlighting that January this year, Arctic sea ice was “more than two metres thinner than average in the region just north of Greenland, which used to be ‘home’ to the oldest and thickest ice”.
However, the picture in the Antarctic is more complex. The plot below shows minimum Antarctic ice cover over the satellite period, which began in 1979.
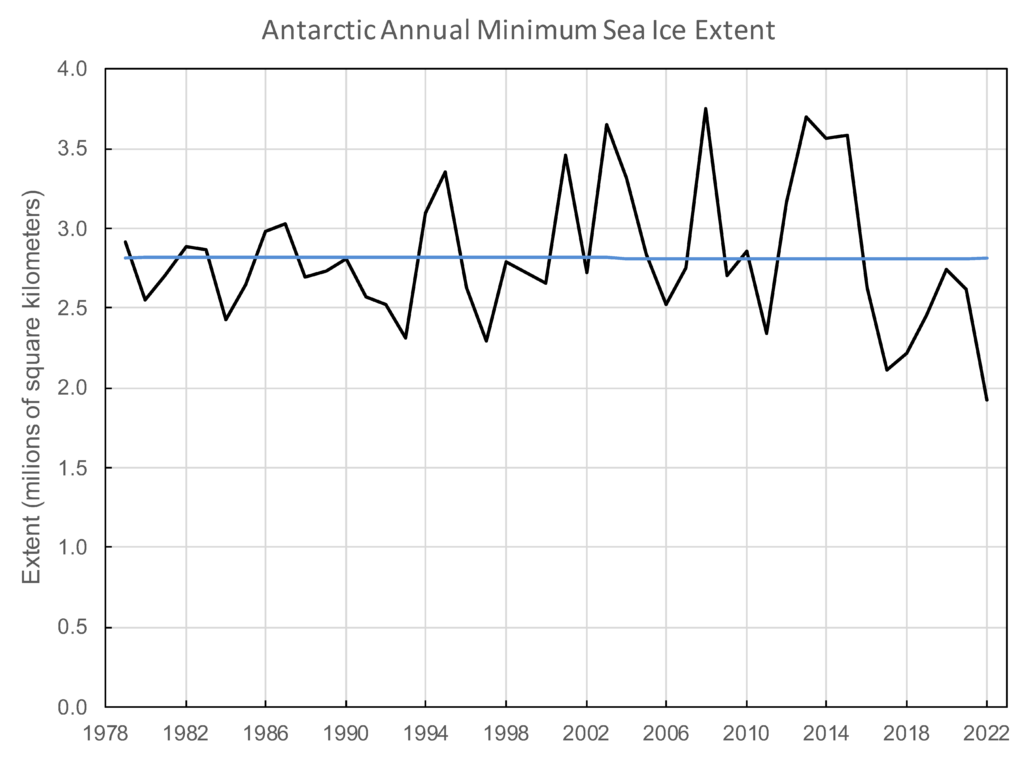
The plot shows that, unlike Arctic sea ice extent, Antarctic sea ice has not declined steadily over the satellite record, but instead fluctuated.
In a recent guest post for Carbon Brief, Dr Clare Eayrs and Prof David Holland from the Center for Global Sea Level Change at New York University, Abu Dhabi explore the main drivers of changing sea ice extent in the Antarctic.
They say that sea ice changes at the Earth’s south pole have been “much less clear cut” than those at the North Pole, adding that “the annual fluctuation in Antarctic sea ice is one of the largest seasonal changes in surface cover on the planet”.
Prof Julienne Stroeve – a professor of polar observation and modelling at University College London and senior research scientist at the NSIDC – tells Carbon Brief that “Antarctic sea ice is much more variable than in the Arctic, and so far any anthropogenic signal appears to be smaller than the natural variability”.
However, in their comment piece, Raphael and Handcock noted that this year’s record-low Antarctic sea ice extent might indicate “a transition to new, more extreme, annual fluctuations”. They wrote:
“The level of variability exhibited in 2016-17 and 2021-22 is unprecedented in the satellite record and might signal a change in the Antarctic sea ice regime as a response to anthropogenic warming. This change might not be a reversal of the trend, but rather a shift to a new state of stability where extremes become more common…These record fluctuations thus suggest a new period of extremes – a changing sea ice regime.”