El Niño causes West Antarctica’s ice shelves to gain height yet lose mass
Robert McSweeney
01.08.18Robert McSweeney
08.01.2018 | 4:00pmEl Niño events are known for bringing floods to South America and contributing to wildfires in Indonesia, but new research reveals they also affect the height and mass of ice shelves in Antarctica.
Ice shelves form where a glacier on land reaches the coast and the ice flows out onto the ocean to form a floating shelf.
During an El Niño event, many of the ice shelves around West Antarctica receive more snow on their surface, but also lose more ice from underneath because of warm ocean water.
Overall, the ice shelves actually lose mass during an El Niño, the research finds, making such events an important factor in the year-to-year fluctuations of ice shelf size.
With more “extreme” El Niño events expected as global temperatures rise, West Antarctica’s ice shelves could see larger fluctuations in height and mass, the lead author tells Carbon Brief – on top of their accelerated thinning in response to climate change.
Year-to-year fluctuations
Around three-quarters of Antarctica’s coast is fringed with ice shelves spilling out onto the water. They play an important role of “buttressing” the glaciers on land behind them, stopping ice flowing from the interior straight out into the ocean where it would contribute to sea level rise.
The new study, published in Nature Geoscience, focuses on the ice shelves of the West Antarctic. These shelves hold back some of the fastest-melting glaciers on the continent.
Using satellite data from four missions covering 1994 and 2017, the researchers identified a pattern in how the height and mass of the ice shelves fluctuate from one year to the next.
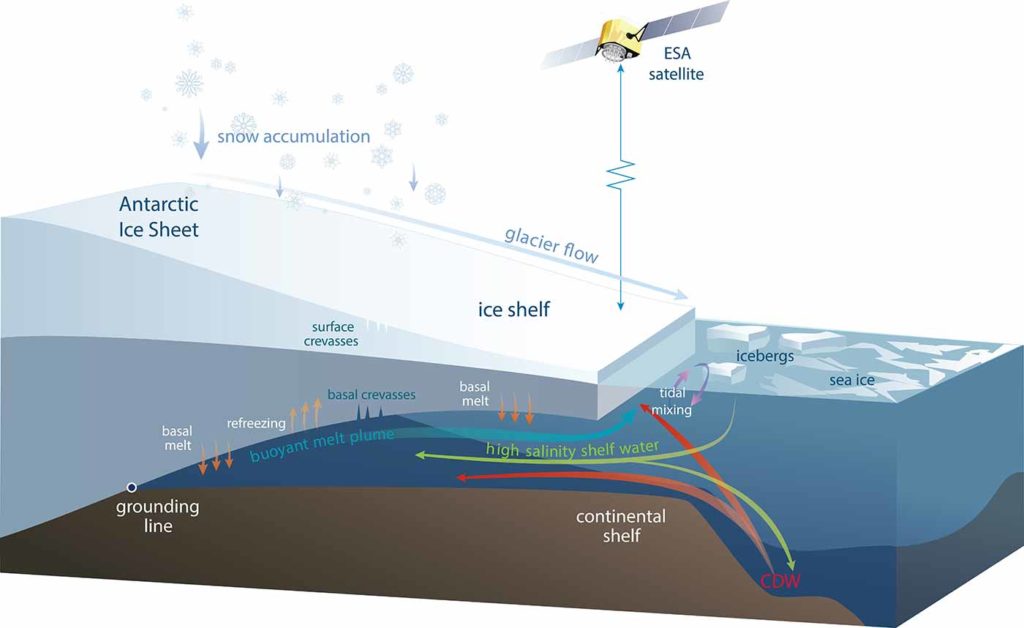
Ice shelf diagram. Credit: Prof Helen Fricker, Scripps Institution of Oceanography, UC San Diego.
Carbon Brief caught up with lead author Dr Fernando Paolo at the Fall Meeting of the American Geophysical Union last month. Paolo is a postdoctoral scholar at NASA’s Jet Propulsion Laboratory at the California Institute of Technology.
Paolo starts out by explaining that their research concentrates only on the year-to-year variability of the ice shelves – not the general declining trend which has seen West Antarctica’s ice shelves thin in response to human-caused warming. He tells Carbon Brief:
“In our previous work, we focused more on the trends. In this work, we actually remove the trends of the ice shelves and are more interested in this interannual variability of ice shelf height.
The study finds a “very clear link” between the El Niño-Southern Oscillation (ENSO) and year-to-year fluctuations in the height and mass of the ice shelves, says Paolo.
El Niño is a natural phenomenon that originates in the Pacific Ocean. Every five years or so, a change in the winds in the equatorial Pacific causes a shift to warmer than normal ocean temperatures, which has knock-on impacts on weather conditions around the world. ENSO also has a cold phase, known as “La Niña”, which brings cooler temperatures to the Pacific Ocean and also affects weather conditions more widely.
These impacts extend to affecting wind patterns in the West Antarctic. This stems from how ENSO influences a low-pressure weather system called the Amundsen Sea Low (ASL), which tends to sit off the West Antarctic coast.
The air pressure of the ASL tends to be higher during El Niño years and lower in La Niña years. Paolo explains what impact this has on the ice shelves in the region:
“During El Niño we have an increase in snowfall that means we have more mass being added on top of the ice shelf. The same wind patterns also control ocean circulation locally. In particular, it promotes the upwelling of warm Antarctic deep water onto the continental shelf and pushes it underneath the ice shelf. That water is warmer than the water the lies closer to the surface. Therefore, it promotes melting of the ice shelves at the base.”
(The continental shelf is the area of seabed immediately surrounding a land mass, where the sea is relatively shallow compared to the open ocean beyond it.)
This means there are two opposite processes going on at once, says Paolo, so the next question to ask was: which one wins?
The answer is two-fold. On the one hand, the height the ice shelf gains from the additional snowfall is greater than the ice that is lost from beneath. So the ice shelf gets thicker during an El Niño event.
But, on the other hand, the fluffy snow that the ice shelf gains is not as dense as the solid ice it loses. This means that, overall, an El Niño causes the ice shelf to lose mass, explains Paolo:
“It turns out that the ocean removes more mass than the snowfall is able to add on top – just because these two mass changes have different densities.”
So, during an El Niño event, the ice shelves gain height, but lose mass.
La Niña
The opposite happens during a La Niña event, the research also finds. The top of the ice shelf receives less snow, but the ice shelves also lose less mass from melting on their undersides. So, overall, the ice shelves of West Antarctica gain mass during a La Niña event.
The graphic below illustrates this. The upper chart shows the fluctuations in average ice shelf height in the Amundsen Sea region of the West Antarctic (blue line) throughout the four satellite missions.
You can see how ice shelf height mirrors the “Oceanic Niña Index” in the black line in the lower chart. This index is a main indicator of ENSO events; a positive index (shaded red) indicates a warm El Niño event, while a negative index (shaded blue) indicates a cool La Niña event.
Many of the peaks in ice shelf height occur during El Niño events – and the troughs during La Niña.

Map (top) shows the portion of Antarctic that faces the Pacific Ocean (black outline) and the Amundsen Sea region (blue). The black horizontal bars beneath denote the time period of each satellite mission. The upper chart shows a 12-month running average of ice shelf height in the Amundsen Sea region (blue line, with the uncertainty range in dotted blue line) and a combined index of the ONI and ASL (red line). The lower chart shows the ONI, with moderate-to-very-strong El Niños (red) and La Niñas (blue) as defined by NOAA. Both the ONI/ASL and ONI lines lag the ice shelf height plot by six months to make it easier to see the similar pattern. Source: Paolo et al. (2018).
Amundsen Sea
The research identifies that the impact of ENSO is greatest in the ice shelves in the Amundsen Sea sector of the West Antarctic – particularly the Dotson and Sulzberger shelves – but it also finds a smaller impact outside this area.
This is not particularly surprising, says Paolo, considering that the Amundsen Sea region of the Antarctic directly faces the Pacific Ocean, where El Niño and La Niña events develop.
You can see this in the map and charts below. The map shows the main ice shelves along the West Antarctic. The bigger the squares and the darker the shading, the larger the impact of ENSO on that ice shelf.
The charts to the right of the map compare the fluctuations in ENSO with the variations in height of six ice shelves (Pine Island, Dotson, Getz, Nickerson, Sulzberger and Ross) and an average for Amundsen Sea region (“AMU”).
As with the earlier chart, you can see how the ice shelf fluctuations predominantly mirror the pattern of El Niño and La Niña events. (Remember, these charts only show the year-to-year variability in ice shelf height, with the long-term declining trends removed.)
The grey shaded line picks out a particular period in the late 20th century where a very strong El Niño (1997-98) was closely followed by an extended La Niña (1998-2001). All of six of the ice shelves show an increase in height during the El Niño and a decrease in response to the subsequent La Niña.

Map (left) shows the size of the impact of ENSO on ice shelf height (larger squares and darker shading indicates a larger impact). Charts (right) show running averages of ONI (top chart) and heights for six ice shelves Pine Island (PIG), Dotson (DOT), Getz (GET), Nickerson (NIC), Sulzberger (SUL) and Ross (ROS). The second chart from the top (AMU) shows combined ice shelf anomalies for the Amundsen (AMU) ice shelves. The ONI lags the ice shelf height plots by six months to make it easier to see the similar pattern. Source: Paolo et al. (2018).
Warming world
As global temperatures rise, research suggests that extreme El Niño events will become more frequent – even doubling under just 1.5C of warming above pre-industrial levels.
This means the short-term variability in the height and mass of West Antarctica’s ice shelves may also increase in the future, says Paolo:
“Since we saw the mass of the ice shelves fluctuate – and that can be affected by fluctuations in El Niño – then in the future we should expect a higher fluctuation.”
This increase variability will need to be taken into account in how scientist project changes in the ice shelves as the world continues to warm, the study concludes.
Dr Bethan Davies – a lecturer in physical geography at Royal Holloway, University of London, who was not involved in the research – stresses the importance of having a complete understanding of what affects the gains and losses of Antarctica’s ice shelves.
The new study is “a thoughtful, original piece of work” and “very interesting indeed”, she tells Carbon Brief:
“These factors may influence ice shelf sensitivity to climate change in the future, so understanding controls on ice shelf surface mass balance is of imperative importance.”
Paolo, F. (2018) Response of Pacific-sector Antarctic ice shelves to the El Niño/Southern Oscillation, Nature Geoscience, doi:10.1038_s41561-017-0033-0
-
El Niño causes West Antarctica’s ice shelves to gain height yet lose mass