Factcheck: What Greenland ice cores say about past and present climate change
Zeke Hausfather
03.05.19Zeke Hausfather
05.03.2019 | 3:26pmA misleading graph purporting to show that past changes in Greenland’s temperatures dwarf modern climate change has been circling the internet since at least 2010.
Based on an early Greenland ice core record produced back in 1997, versions of the graph have, variously, mislabeled the x-axis, excluded the modern observational temperature record and conflated a single location in Greenland with the whole world.
More recently, researchers have drilled numerous additional ice cores throughout Greenland and produced an updated estimate past Greenland temperatures.
This modern temperature reconstruction, combined with observational records over the past century, shows that current temperatures in Greenland are warmer than any period in the past 2,000 years. That said, they are likely still cooler than during the early part of the current geological epoch – the Holocene – which started around 11,000 years ago.
However, warming is expected to continue in the future as human actions continue to emit greenhouse gases, primarily from the combustion of fossil fuels.
Climate models project that if emissions continue, by 2050, Greenland temperatures will exceed anything seen since the last interglacial period, around 125,000 years ago.
Ice cores as climate ‘proxies’
Widespread thermometer measurements of temperatures only extend back to the mid-1700s. Scientists investigating how temperatures have changed prior to the invention of thermometers need to rely on a variety of climate “proxies”, which are correlated with temperature and can be used to infer, with some uncertainties, how it has changed in the past.
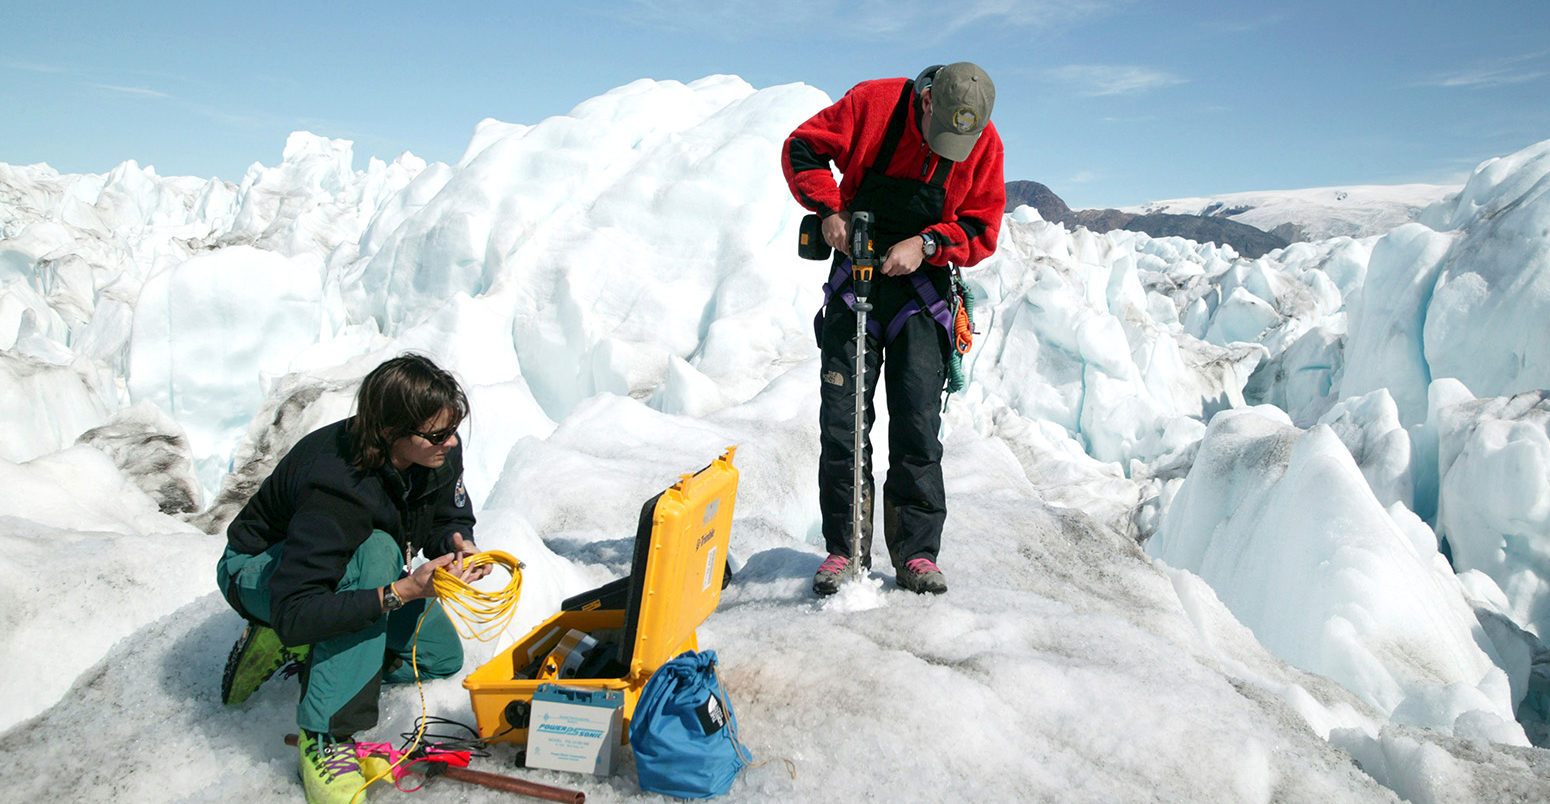
Climate proxies can be obtained from sources, such as tree rings, ice cores, fossil pollen, ocean sediments and corals. Ice cores are one of the best available climate proxies, providing a fairly high-resolution estimate of climate changes into the past.
Since scientists cannot directly measure temperatures from ice cores, they have to rely on measuring the oxygen isotope – 18O – which is correlated with temperature, but imperfectly so.
Odyssey of errors
A temperature reconstruction using the Greenland Ice Sheet Project 2 (“GISP2”) ice core was first published by Prof Kurt Cuffey and Dr Gary Clow in a 1997 paper published in the Journal of Geophysical Research: Oceans. Prof Richard Alley of Penn State University also used the record in a 2000 paper. Neither of these papers provided a comparison of GISP2 record with current conditions, as the uncertainties in the ice core proxy reconstruction were too large and the proxy record only extended back to 1855.
The GISP2 ice core record was used in a number of papers in the late 1990s and 2000s that examined changes over the last ice age and the start of the current warm era – the Holocene – around 11,000 years ago. Around 2009, it caught the attention of Dr J Storrs Hall of the Foresight Institute, a technology-focused nonprofit group, who wrote a blog post suggesting that it disproved the idea that “human-emitted CO2 is the only thing that could account for the recent warming trend”.
That post was republished on a climate sceptic blog called Watts Up With That, which followed up with its own version of a GISP2 graph in late 2010 by Dr Don Easterbrook, an emeritus professor of geology at the Western Washington University. Easterbrook’s graph, shown below, was shared widely across the internet by climate sceptics and is still frequently seen – with many small variations – to this day in discussions on Twitter, blogs and news article comment threads.
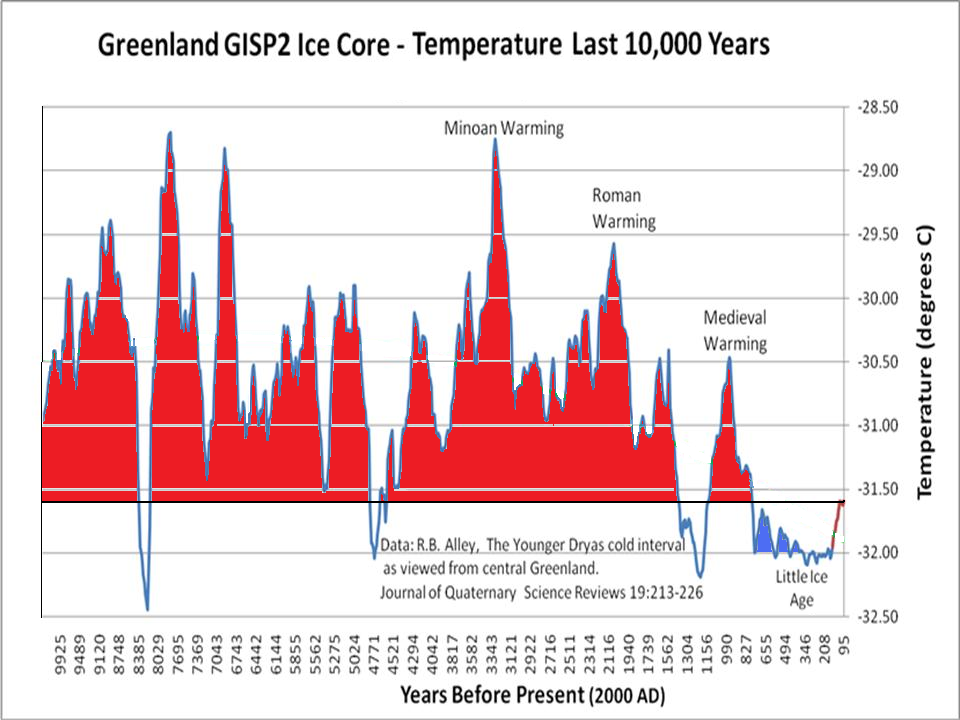
This graph is misleading for a number of reasons.
First, the x-axis is mislabelled. In fact, it should say “Years before 1950”, rather than “Years before present (2000 AD)”. The GISP2 ice core only extends up to 1855 – 95 years before 1950. This means that none of the modern observational temperature period overlaps with the proxy reconstruction. (Easterbrook’s graph shows the uptick in the final 100 years or so of the record – shown in red – incorrectly indicating that it is the observational temperature period.)
The figure was also featured in another post on the same blog, which conflated Greenland with global temperatures. Any individual location will have significantly more variability than the globe as a whole. A single ice core is also subject to uncertainties around elevation changes and other perturbations to the ice core over time.
As Prof Alley told then-New York Times journalist Andrew Revkin back in 2010:
“The data still contain a lot of noise over short times (snowdrifts are real, among other things). An isotopic record from one site is not purely a temperature record at that site, so care is required to interpret the signal and not the noise.”
The GISP2 reconstruction is fairly old and more recent research has questioned the assumptions made in changing the relationship between temperature and 18O during the Holocene and how to best account for elevation change of the ice sheet at the GISP2 site. The GISP2 reconstruction changes the relationship between 18O and temperatures by a factor of two during the Holocene, while more recent reconstructions keep it constant. Similarly, elevation change influences 18O records. The old GISP2 reconstruction did not take elevation changes into account.
Scientists reconstructing past Greenland temperatures now use estimates from many different ice cores, which reduces the uncertainties associated with any single one and gives a more accurate picture of changes over Greenland as a whole.
Alley made this point explicitly, telling Revkin:
“So, what do we get from GISP2? Alone, not an immense amount. With the other Greenland ice cores… and compared to additional records from elsewhere, an immense amount… Using GISP2 data to argue against global warming is, well, stupid, or misguided, or misled, or something, but surely not scientifically sensible.”
Multi-core reconstructions
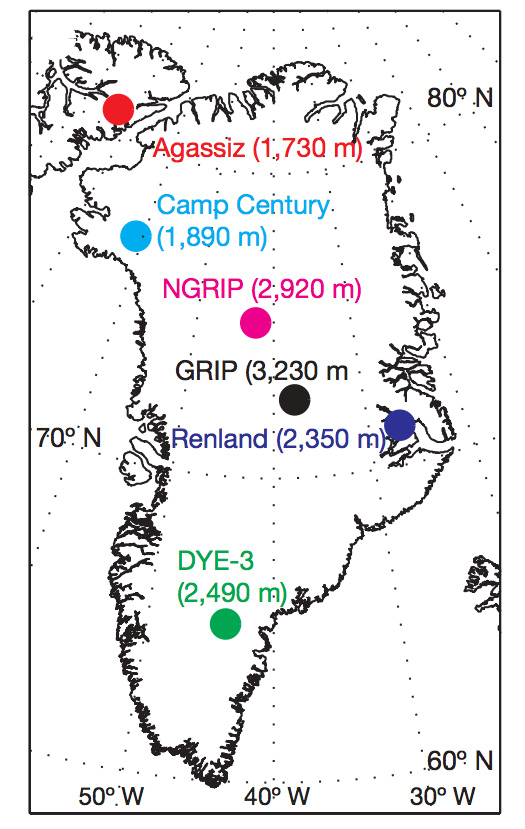
A more modern Greenland temperature reconstruction, based on six different ice cores, was published by Prof Bo Vinther of the Niels Bohr Institute at the University of Copenhagen and colleagues in Nature in 2009.
Speaking to Carbon Brief, Vinther suggests that this multi-core Holocene reconstruction provides a number of advantages over the old GISP2 series, using ice core 18O data corrected for past elevation change and “tuned” to fit ice core borehole temperatures at four locations.
The six ice core sites used by the reconstruction are shown in the figure below.
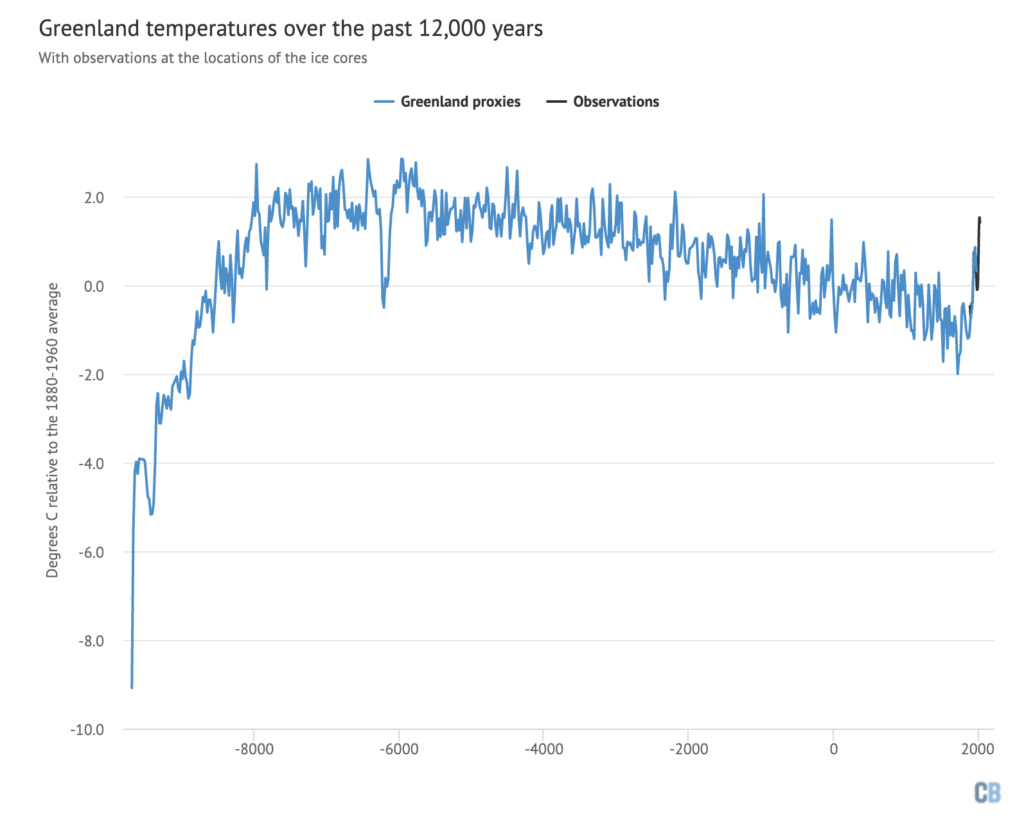
The temperature reconstruction produced using data from all six ice cores is shown by the blue line in the figure below, and spans the period from 9690BC to AD1970. It has a resolution of around 20 years, meaning that each data point represents the average temperature of the surrounding 20 years. So, the end of the record – 1970 – shows the average temperature between 1960 and 1980.
The ice core data cannot be extended all the way through to present because, as Alley tells Carbon Brief, the snow that falls on the ice sheet needs time to form into solid ice. He explains that “it isn’t quite enough to measure the snow as it falls…because there is a bit of post-depositional isotopic exchange and smoothing, so you’d want cores”.

To extend this dataset up to the present day, Carbon Brief has taken observational temperature data from Berkeley Earth at the location of each of the ice cores and used a 20-year locally weighted smoothed (“LOWESS”) average of all the sites. This is a statistical approach that provides an estimate of long-term changes in the timeseries.
The black line in the figure below shows the observational record between 1880 and 2018. It is fitted to the ice core reconstruction during the period of overlap from 1880 through to 1970.
Showing instrumental temperature observations alongside climate proxy records is often challenging in practice. As Alley tells Carbon Brief: “The question of how to join palaeoclimatic data to instrumental data is one of the oldest in this field and remains challenging.”
Prof Vinther explains that showing proxy data and observations side-by-side is appropriate as long as the data both have the same “temporal resolution”. In other words, because each point in both datasets represents an average of the 20 years of surrounding data, they can be more accurately compared. Because ice cores provide relatively high resolution temperature estimates, it is easier to compare them to observed temperatures than other proxy reconstructions that may only have one value in a century or more.
Recent temperatures in Greenland are still likely below those experienced in the early Holocene. This is similar to what is found in global Holocene temperature reconstructions, such as the one published by Prof Shaun Marcott and colleagues in Science in 2013, which suggested that “current global temperatures of the past decade have not yet exceeded peak interglacial values, but are warmer than during ~75% of the Holocene temperature history”.
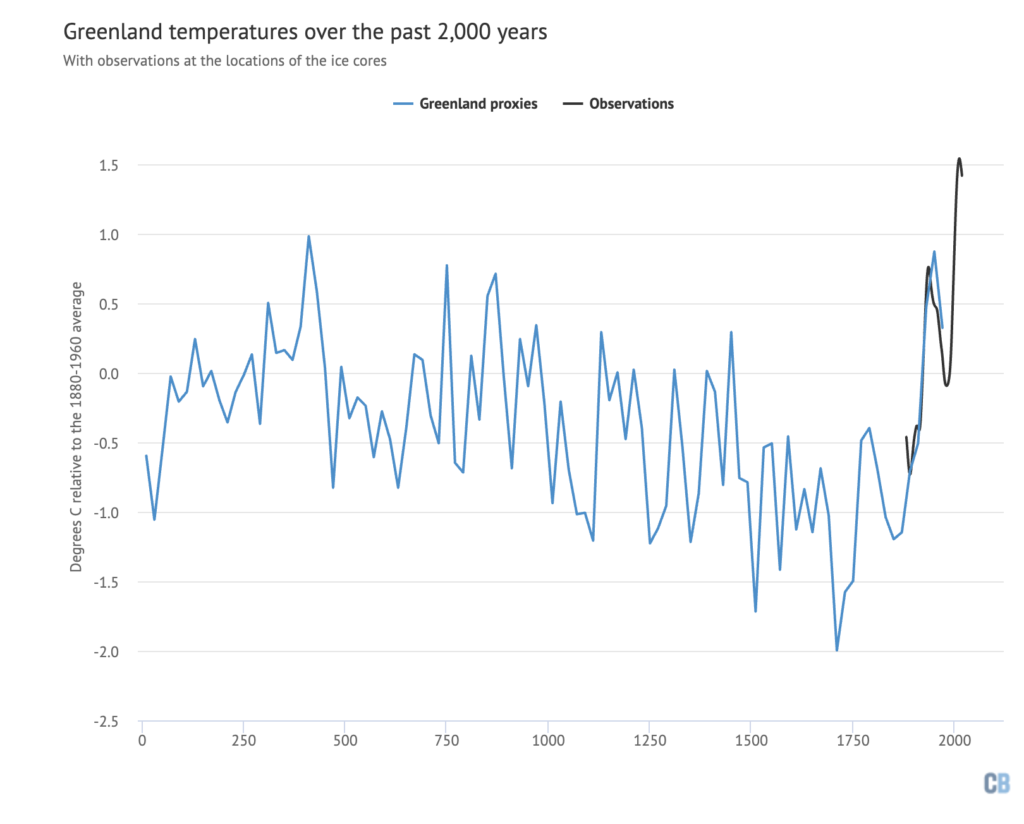
Recent temperatures are clearly higher than any seen in Greenland over the past two millennia. The figure below shows the ice core and observational temperature data zoomed in on the period from AD1 through to the present day.
Looking into the future
While periods during the early Holocene – 7,000-11,000 years ago – may have been warmer in Greenland than the present day, if the present rate of warming continues, the Earth should pass well beyond any temperatures experienced in Greenland during the Holocene by 2050.
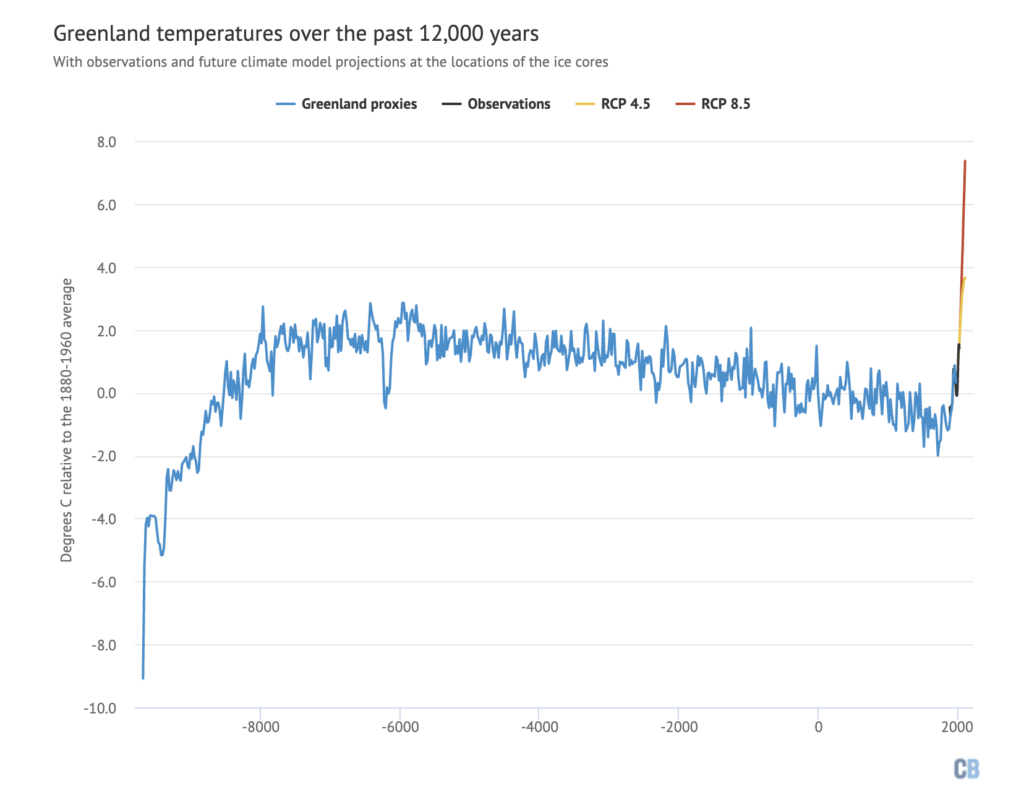
To examine how future Greenland warming might compare to what has happened in the past, Carbon Brief has looked at the average of the CMIP5 climate models used in the Intergovernmental Panel on Climate Change (IPCC) fifth assessment report. Future projections from these models are taken from the locations of the six ice cores used by Vinther and colleagues.
Two future scenarios, known as “Representative Concentration Pathways”, are used: representative concentration pathway RCP4.5, a modest mitigation scenario where global temperatures warm to nearly 3C above pre-industrial levels by 2100, and RCP8.5, a very high emissions scenario where global temperatures warm nearly 5C by 2100.
Climate models show faster warming in the Arctic than the rest of the world – a phenomenon known as arctic amplification – and similar to what has been observed over the past few decades. By 2100, these models have the area above the Greenland ice core locations warming by nearly 4C in RCP4.5 and more than 7C in RCP8.5.
The figure below shows a 20-year LOWESS smoothed average of the models from 2000 through to 2100 added on to the end of the observational temperature data. Temperatures clearly exceed any experienced in Greenland during the Holocene by 2050 and are much warmer by 2100.
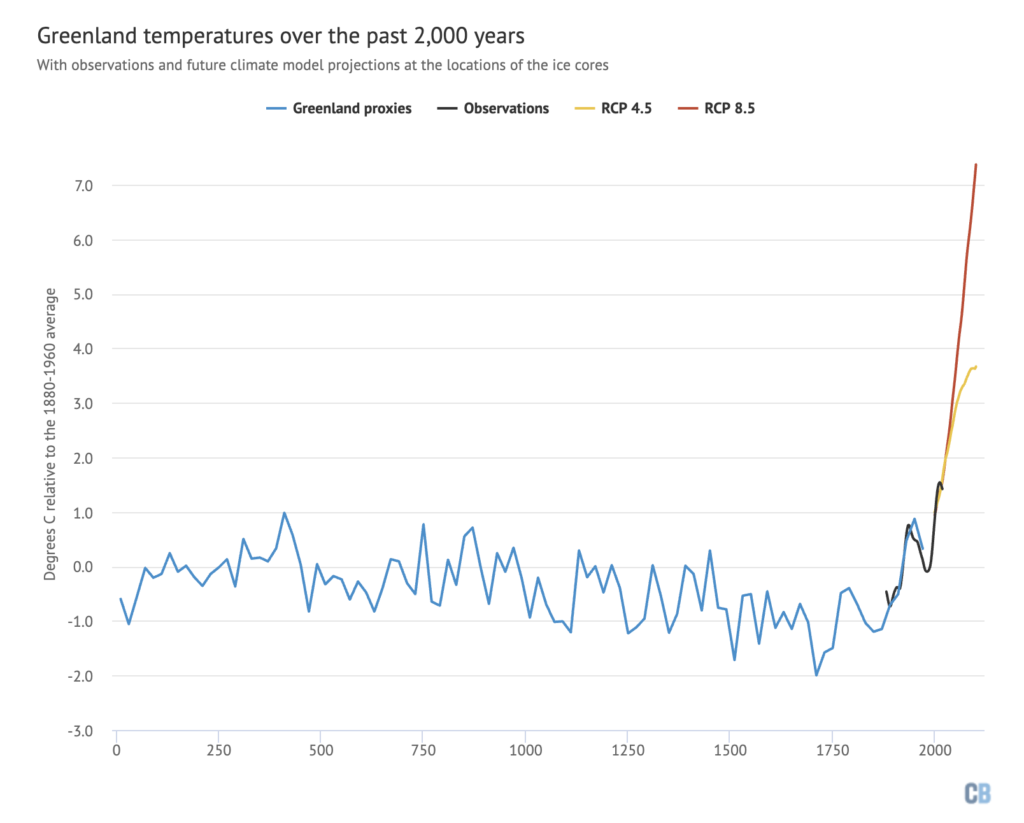
Just looking at the past 2000 years – and next 100 – shows a similar rapid rise at the end of the record. The rate of warming over the next century is projected to be far faster than anything seen since the end of the last ice age.
Conclusion
Greenland ice cores provide a high-quality high-resolution estimate of past changes in temperatures, allowing more precise comparisons with observed temperature records than most other climate proxies. While current temperatures are likely still below the highs in the early Holocene around 7,000 years ago, they are clearly higher than any temperatures experienced in Greenland over the past 2,000 years.
Greenland is just one location and temperature variations seen in ice core records may not be characteristic of global temperatures. However, global proxy reconstructions have tended to show similar patterns, with current temperatures lower than the early Holocene maximum.
Unless greenhouse gas emissions cease in the near future, warming will continue and, by the middle of the 21st century, Greenland – and the world as a whole – will likely experience temperatures that are unprecedented at least since the last interglacial period 125,000 years ago.
References
Cuffey, K. M., & Clow, G. D. (1997). Temperature, accumulation, and ice sheet elevation in central Greenland through the last deglacial transition. Journal of Geophysical Research: Oceans, 102(C12), 26383–26396. http://doi.org/doi:10.1029/96JC03981
Alley, R. B. (2000). Ice-core evidence of abrupt climate changes. Proceedings of the National Academy of Sciences, 97(4), 1331 LP-1334. http://doi.org/10.1073/pnas.97.4.1331
Vinther, B. M., et al. (2009). Holocene thinning of the Greenland ice sheet. Nature, 461, 385. https://doi.org/10.1038/nature08355
-
Factcheck: What Greenland ice cores say about past and present climate change