Guest post: Arctic warming is causing a 60-fold increase in permafrost landslides
Dr Antoni G. Lewkowicz is a professor in the department of geography, environment and geomatics at the University of Ottawa. He is president of the Canadian Permafrost Association and a former president of the International Permafrost Association.
One of the principal concerns of a warming Arctic is the thawing of carbon-rich permafrost, which could release CO2 and methane into the atmosphere and accelerate climate change.
However, the thawing of these perennially frozen soils also risks making a mark on the land surface itself, causing landslides known as “retrogressive thaw slumps”.
When I first studied retrogressive thaw slumps on Banks Island in the Canadian Arctic in the 1980s, global climate models were in their infancy and the magnitude of human-caused climate warming was still being understood.
We now have a much better idea of the scale of future warming and its amplification in the Arctic. And in our new study, published in Nature Communications, my co-author Dr Robert Way and I show how warmer summers are causing more landslides, which is having a profound impact on the Arctic landscape and ecosystem.
Landslides
A retrogressive thaw slump (RTS) is a landslide that can occur only in permafrost areas. It develops when the ice within the soil melts rapidly, leaving the soil weakened and unstable. Where this happens on a slope, the instability can result in a landslide.
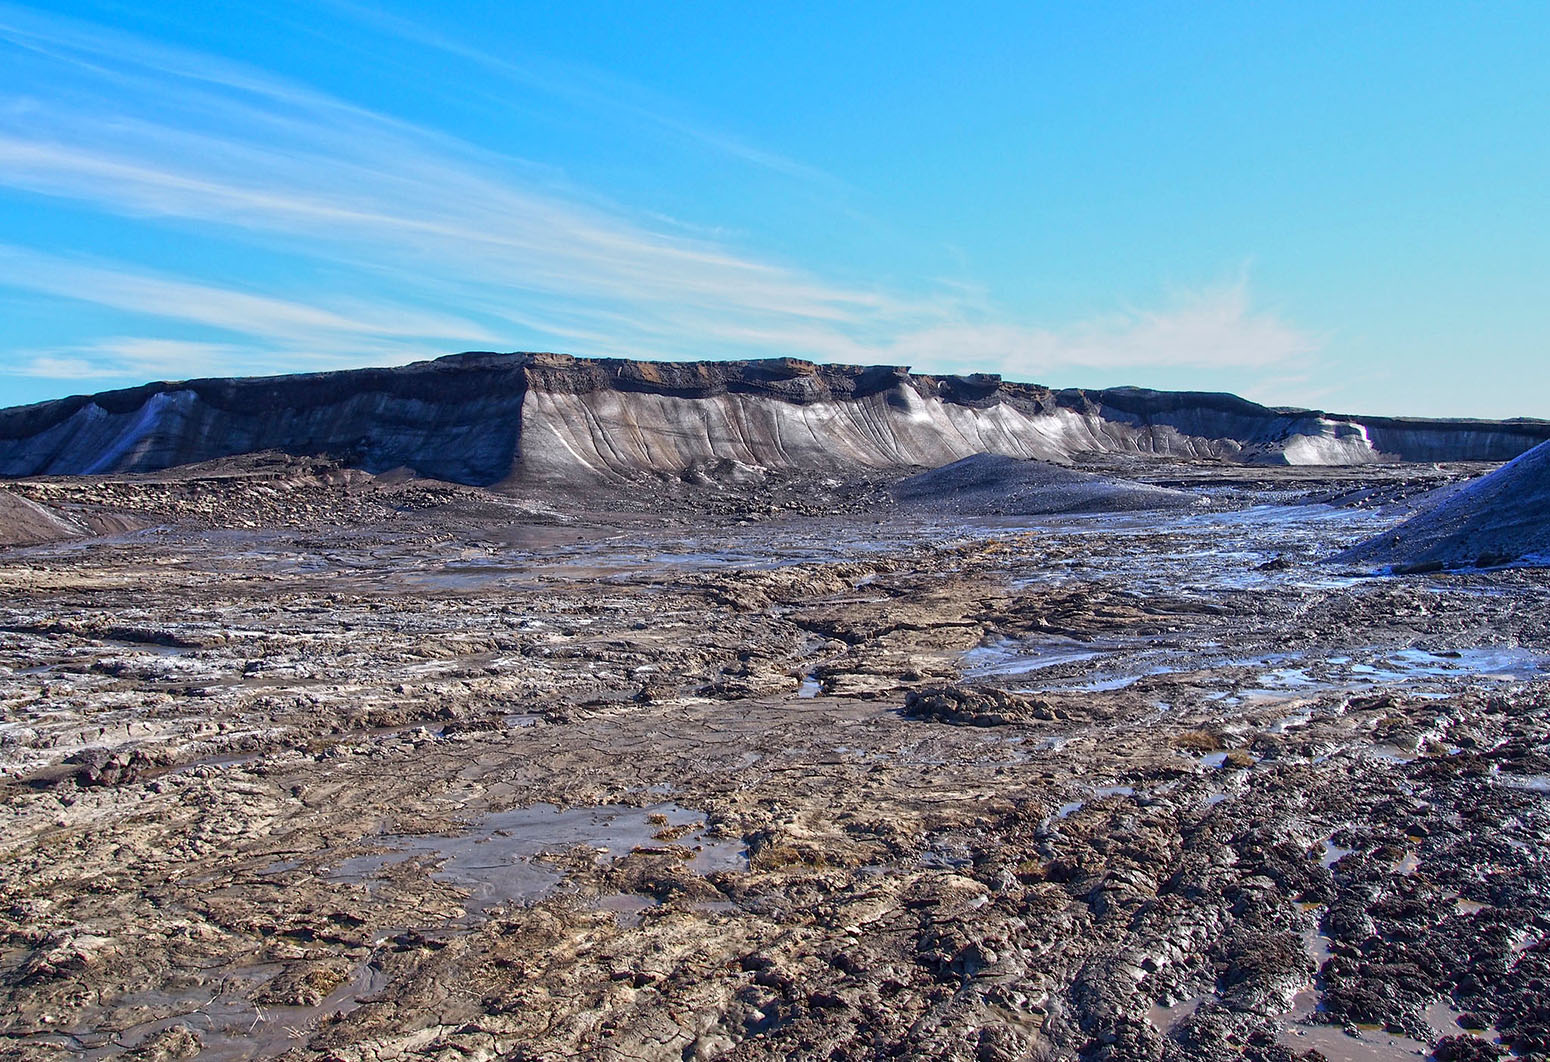
We call these landslides “retrogressive” because the headscarp – the steep exposed soil face at the top of the landslide – progressively retreats upslope after the initial slumping. They are “thaw” slumps because they are caused by the thawing of ice in the permafrost. And they are “slumps” because that’s the term most commonly used for bowl-shaped landslides.
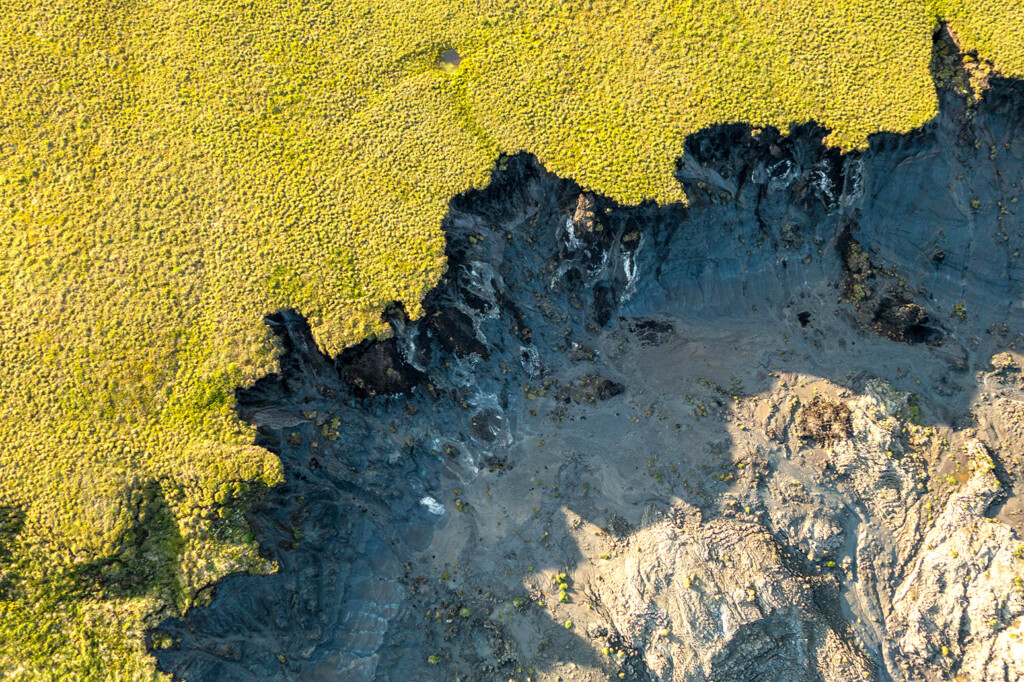
An RTS resembles a sand pit dug out of a slope, with melting ice present around its upper edge, which constantly collapses. Mud and water then collects in the bottom of the landslide “pit”, making a mud slurry that eventually flows away into rivers, lakes or the ocean. Once started, an RTS can remain active and grow in size for many years as the headscarp progressively moves upslope. The video below shows this in action.
Back in the early 1980s, the focus of my research was on understanding environmental controls on the enlargement of RTSs, which represent some of the most rapidly developing geomorphic features affecting permafrost areas.
In the field, my colleagues and I measured the rate of retreat of the headscarp – which can be up to 15 metres in a year – as well as the energy melting the ice, which comes mostly from direct sunlight, but also heat transfer from warm air. We also mapped how many RTSs were present near our camp along the southwest coast of Banks Island.
While we were investigating one tiny corner of the Canadian Arctic, in the skies overhead, satellites such as Landsat 4 and 5 silently collected images of Banks Island and the rest of the world.
In late 2016, a small part of the wealth of satellite images collected were assembled into the “Google Earth Engine Timelapse” dataset. This is a “global, zoomable video that lets you see how the Earth has changed over the past 32 years”, explains Google. It is composed of a mosaic of more than five million satellite images, providing one cloud-free image per year for each location on land from 1984-2016.
One of the benefits of using this dataset is that landscape change can be looked at on a computer screen as a timelapse movie without specialised software or hardware. You can try the Timelapse viewer below, which shows a section of the eastern coastline of Banks Island.
Observations
Around the same time, several papers were published that showed numbers of RTSs had increased on Banks Island as well as in other parts of the western Canadian Arctic. However, these studies were based on specific timeslices corresponding to the images available, so the links to climate were not entirely clear.
Shortly after the Timelapse dataset was published, I gave undergraduates at the University of Ottawa a class assignment to use it to observe and record visible changes to the landscape of Banks Island.
The observations, though not always comprehensive, were staggering. Parts of the island were changing dramatically due to RTS development.
After redoing and verifying the observations, it turned out that in 1984 when I was in the field, only 63 RTSs were active on the entire island and 10 of those were near our camp. By 2013, there were more than 4,000 on the island – a 60-fold increase. The area covered by active RTSs grew from one square kilometre (sq km) to 60 sq km in 2015 – the area of the Island of Manhattan – and was increasing by five sq km per year.
More than 250 lakes also changed colour due to sediment being deposited into the water – resulting in some river valleys being visibly choked with sediment. These changes to the land surface and the loss of ice associated with the slumping are irreversible.
Long-term consequences
Our analyses allowed us not only to evaluate the increase in the number and area of RTSs – but also when the increases occurred.
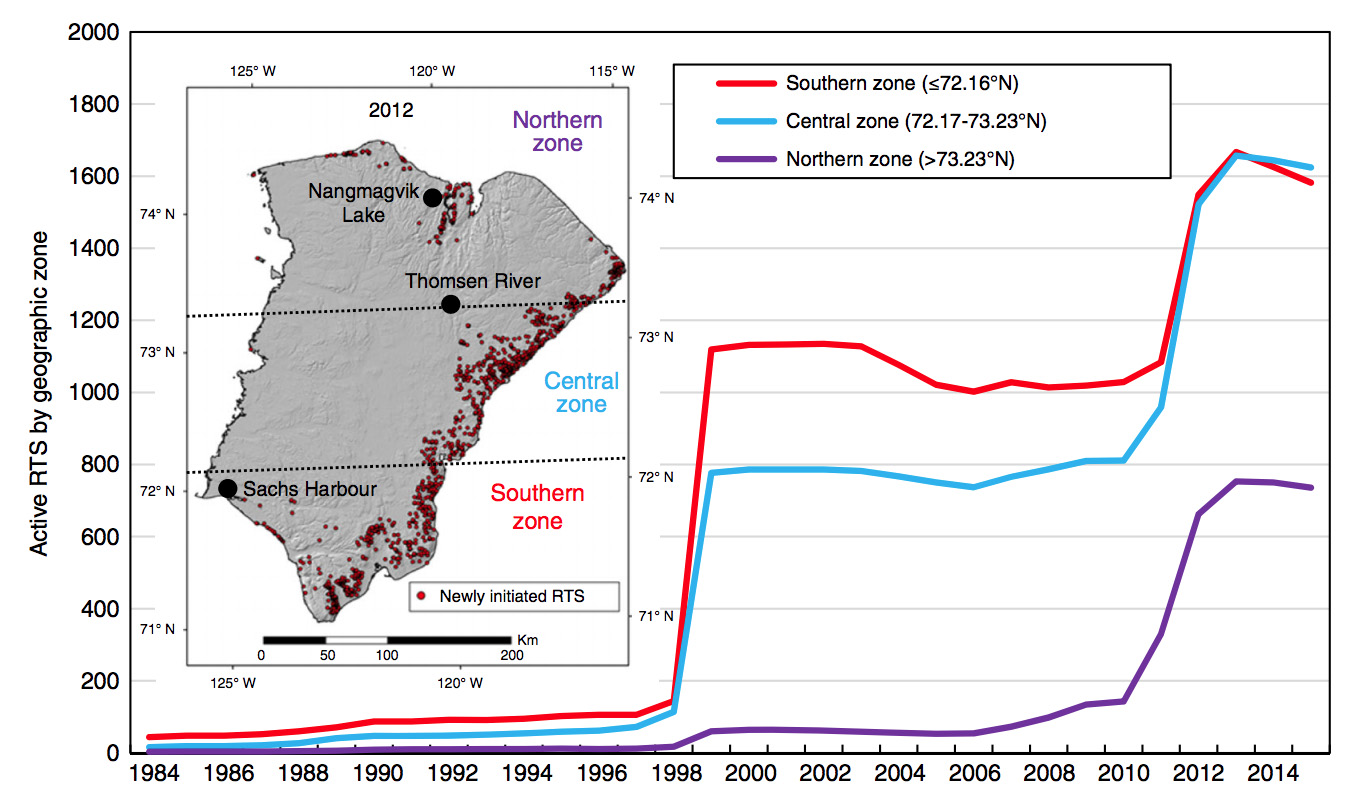
More than 85% of these slumps became visible after four particularly warm summers: 1998, 2010, 2011 and 2012. You can see this in the chart below, which shows the number of active RTSs in the northern (purple line), central (blue) and southern (red) zones of Banks Island since 1984.
We were also able to calculate the longevity of RTSs and found that half of them remain active for 30 years or more, meaning that a single event has long-term consequences.
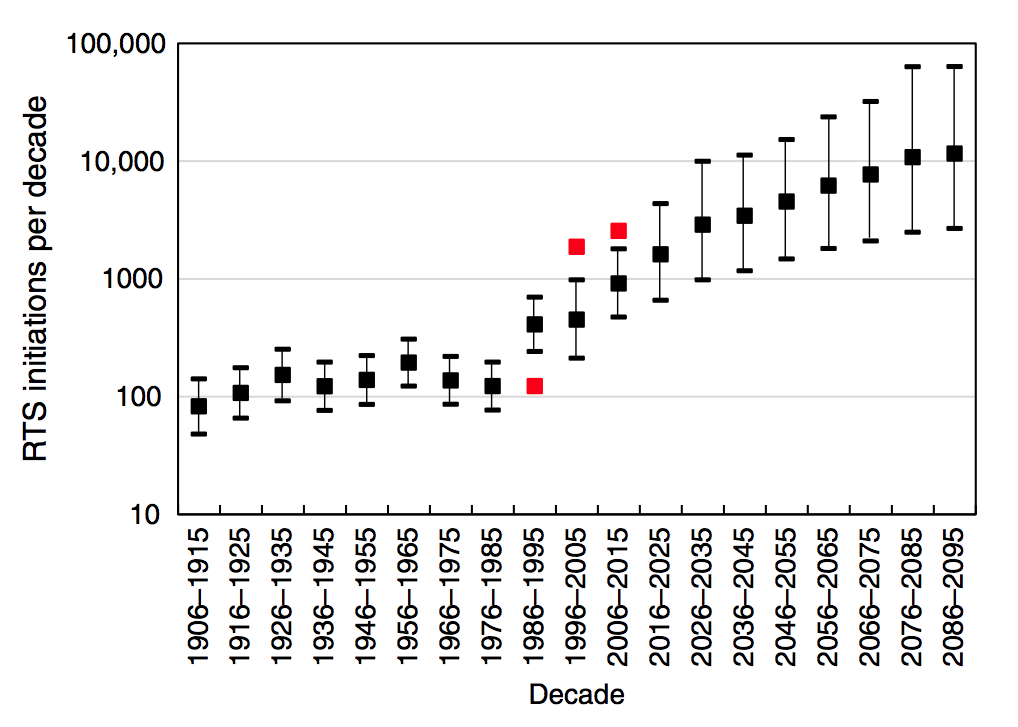
Our research showed that it was possible to predict the initiation rate of slumps using a combination of the weighted average of the previous and current year’s July-August air temperature. This allowed us to “hindcast” past activity in the 20th century – which was largely very low – and forecast future activity using the “RCP4.5” moderate global warming scenario.
Our model simulations suggest that more than 10,000 RTSs will be initiated per decade by 2076. You can see this in the chart below, which shows hindcasts for the 20th century and projections for the 21st. Estimates are shown as black squares with error bars showing the range of uncertainty. The red squares show the observed estimates made using the Google Timelapse images.
Ecological impacts
Despite the advances we have made, an important question remains regarding RTSs – what is the significance of the increase in thaw slumps for the wider environment other than terrain change?
In terms of ecological impacts, we don’t have a clear answer from our study because there is little baseline data on aquatic ecosystems on Banks Island.
Elsewhere, concentrations of RTSs have been linked to changes in river chemistry, including the release of mercury. We also know that thaw slumps export organic material that was previously frozen in the permafrost. Its subsequent breakdown by bacteria to form CO2 or methane is expected to contribute additional greenhouse gases to the atmosphere.
It is important to underline that not all the Arctic will react like our study area, and indeed there are big spatial differences in RTS distribution even on Banks Island.
The triggering of RTS can occur only where permafrost contains large amounts of ice close to the land surface and, fortunately, this is not the case everywhere. In fact, analysis of changes from 1999-2015 in large transects in Siberia, eastern Canada and Alaska revealed only a fraction of the RTS concentrations that we observed.
However, we also know that Banks Island is not unique. The undergraduate class this past semester used Timelapse data to examine northwest Victoria Island and again found hundreds of new RTSs. Furthermore, we showed in our study that summer warmth spread farther northwards on Banks Island in the 2010-2012 period compared to 1998 – causing entirely new concentrations of RTS to develop in the same region.
We, therefore, infer that there may be colder regions in the Canadian Arctic Archipelago that will develop RTSs in the future as the climate warms.
During my working lifetime, parts of Banks Island have changed dramatically. Our projections show that my younger colleagues and students will see even more change during their careers.
We’ve added to the evidence that even areas of cold permafrost are vulnerable to climate warming, and demonstrated in particular the importance of extreme summer temperatures. Our conclusion is that this part of the Arctic will never again be the way it was just two decades ago.