
Guest post: G7 climate laws ‘cut emissions by 1.3bn tonnes in 2019’
Multiple Authors
06.08.21Multiple Authors
08.06.2021 | 11:15amClimate laws implemented by the G7 group of major economies cut their collective carbon dioxide (CO2) emissions by 1.3bn tonnes (GtCO2) in 2019.
That is the result of our new analysis for Carbon Brief, ahead of the G7 leaders summit on 11-13 June, based on research we published last year.
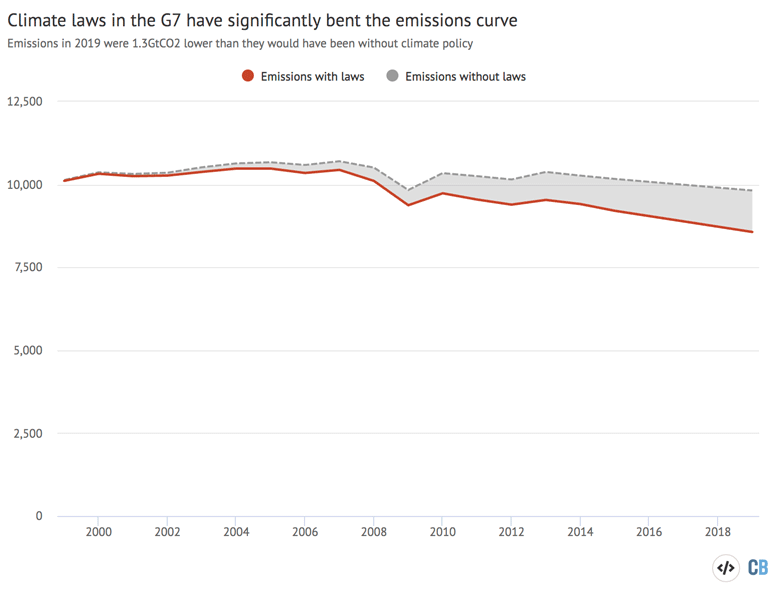
The 1.3GtCO2 saving means CO2 emissions from the G7 countries in 2019 were 12% lower than they would have been, if no climate laws had been put into place.
The results run counter to the idea that wider socioeconomic changes and market forces have driven down emissions, for reasons that have little to do with climate policy. They suggest that climate policy has, in fact, been a notable factor in the peaking of G7 emissions overall.
Although, relative to the world’s Paris targets, the impact of policy so far remains critically insufficient, our work shows that climate laws have successfully “bent the curve” of emissions.
Legal force
There are now more than 2,000 national climate change laws in place around the world, representing at least a 20-fold increase over the past 20 years.
With global emissions continuing to rise stubbornly almost every year, however, it is reasonable to ask if these climate laws have actually had any effect.
In research published last year in Nature Climate Change, we looked at the statistical relationship between the passing of each new climate law and changes in national emissions for 133 countries.
We found that, on average, each law reduced the carbon intensity of GDP – the CO2 associated with each unit of GDP – by 0.8% in the first three years and by 1.8% over longer time periods.
The findings suggested that climate laws take a few years to reach their full effect.
In total, the laws we analysed had reduced the world’s cumulative carbon emissions between 1999 and 2016 by about 38GtCO2, or about one year’s worth of global carbon output.
Global to G7
On 11-13 June, the G7 is holding its annual summit in Cornwall in southwest England. The official G7 website says a “greener, more prosperous future” is a priority for the meeting. It says:
“Prime minister Boris Johnson will use the UK’s G7 presidency to unite leading democracies to help the world fight, and then build back better from coronavirus and create a greener, more prosperous future.”
The communiqué of the G7 environment ministers, who met ahead of the leaders’ summit, contains a strong, if carefully calibrated commitment to cutting emissions. It says:
“We will help set the world on a nature positive and climate-resilient pathway to bend the curve of biodiversity loss by 2030 and to keep a limit of 1.5C temperature rise within reach by making our 2030 ambitions consistent with the aim of achieving net-zero emissions as soon as possible and by 2050 at the latest.”
Are these words matched by action? G7 leaders may point to the fact that their emissions peaked some time ago. In the UK, the ratio of greenhouse gas emissions to GDP has fallen by a factor three since 1990. Critics may counter that much of the fall was due to socioeconomic factors and had little to do with climate policy.
For example, falling US CO2 emissions are partly due to shale gas, which is cleaner than the coal it replaced. In the UK, coal was squeezed by market liberalisation, leading to a “dash for gas”.
To find a numerical answer to the question of G7 progress on emissions, we adapted our previous work to estimate the effectiveness of their climate laws, relative to wider socioeconomic changes.
To do so, we have to assume that the overall relationship between carbon emissions and climate legislation, which holds globally, also holds in individual countries.
This assumption is not unproblematic. Each country has its own socio-political idiosyncrasies and not all climate laws are the same.
We attempted to minimise this problem by relying on the statistical relationships in OECD and EU member countries, where socioeconomic and political structures are more homogeneous.
Once we know the statistical relationship between emissions and legislation, we can create counterfactual emissions paths showing what would have happened without each new law.
The result is a hypothetical emissions trajectory, in a world without any climate policy at all.
For the G7 overall, our new analysis suggests that climate policy has been a notable factor in the peaking and subsequent decline of emissions.
Compared to emissions in 1999 of 10.1GtCO2, the G7 was responsible for 8.6GtCO2 in 2019, a reduction of some 1.5GtCO2 (15.3%). Our results suggest the large majority of this reduction, some 1.3GtCO2 (12%), was due to climate policy, rather than wider socioeconomic changes.
Most of the effect kicked in after 2009, when important laws like the UK Climate Change Act or the EU 2020 package came into force, as shown in the chart below.
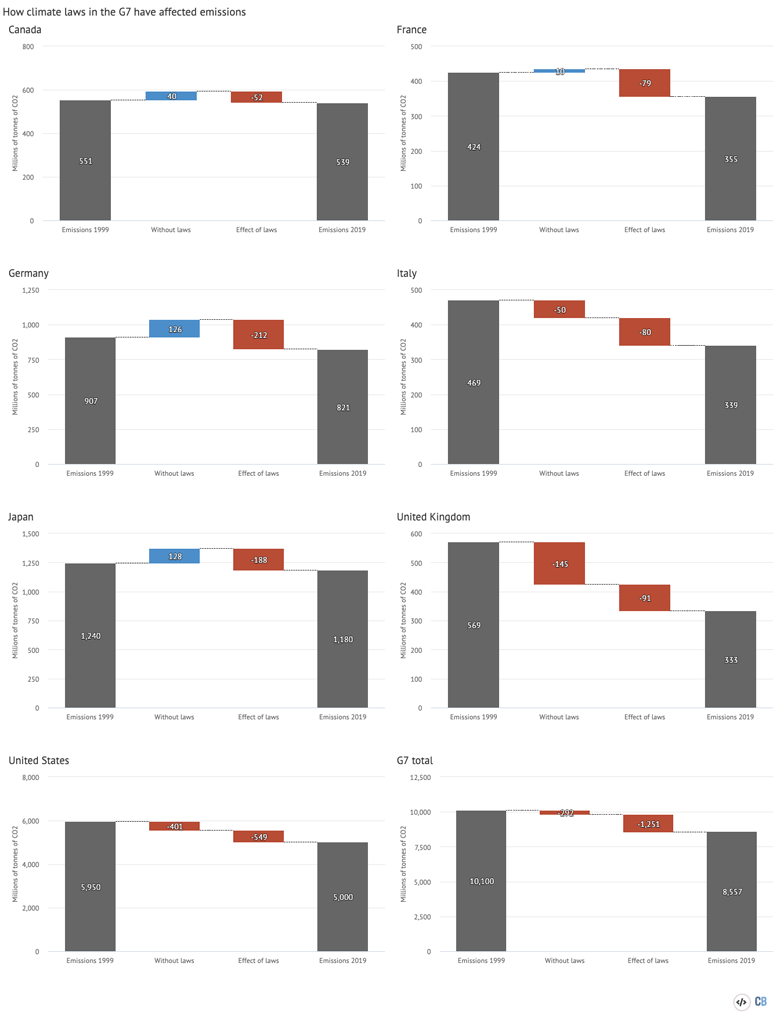
Within this G7 total, there are some interesting variations between countries in terms of the relative impact of climate laws versus other changes, as shown in the table below.
| CO2 in 1999 (MtCO2) | Change in CO2 without laws (1999 to 2019, %) | Policy-induced change (1999 to 2019, %) | Carbon emissions in 2019 (in % of 1999) | |
|---|---|---|---|---|
| Canada | 551 | 7.3% | -9.5% | 97.8% |
| France | 424 | 2.4% | -18.7% | 83.7% |
| Germany | 907 | 13.9% | -23.4% | 90.5% |
| Italy | 469 | -10.6% | -17.1% | 72.3% |
| Japan | 1,240 | 10.3% | -15.1% | 95.2% |
| UK | 569 | -25.4% | -16.1% | 58.5% |
| United States | 5,950 | -6.7% | -9.2% | 84.0% |
The UK is the host nation of both the G7 and the COP26 climate summit in November and sees itself as a world leader in terms of reducing emissions.
At 42% since 1999, the UK’s fall in CO2 emissions is easily the largest among the G7. Canada, Germany and Japan have seen their emissions fall by less than 10% over the same period.
However, well over half of the drop in UK emissions, or 25 percentage points, was due to socioeconomic factors rather than deliberate climate policy. By some distance, the UK has benefited most from such external trends, although they also mattered in Italy and the US.
The UK de-industrialised significantly over the earlier part of this period and the notable fall in power sector emissions was driven by market factors – the dash for gas, an ageing coal fleet – and air pollution regulation, as much as it was by climate policy.
In contrast, wider economic factors – and associated policy decisions – have offset most of the climate policy gains in Canada, Germany and Japan. Put another way, these countries would have seen their emissions increasing rather than decreasing, if they had not had climate laws in place.
In the case of Canada, wider factors included the sharp ramp up of oil production. In Germany and Japan, emissions have been affected by changing attitudes toward nuclear energy.
The German estimates are particularly striking. Were it not for the wider context, Germany would be the clear leader in emissions abatement, with a policy-induced drop in emissions of over 23% since 1999, as shown in the chart below.
Germany’s performance, like that of the other European G7 countries, was boosted by the climate policies of the EU. With policies including the EU Emissions Trading System and mandatory renewable energy targets, the EU has had a noticeable impact on the emissions of member states. (In our modelling, we added EU laws to the tally of each member state).
Our analysis suggests that national climate policy has been least effective in Canada and the US, with policy-induced emissions reductions of less than 10%.
However, the statistics are difficult to interpret, since much of their emission reduction effort has been spearheaded by subnational entities, whereas our analysis only covers federal laws.
The US emissions cuts are the largest in absolute terms, accounting for more than 40% of the G7 emissions savings, as shown in the chart above. This is the indicator that matters most for the remaining carbon headroom in the atmosphere.
Overall, our results show that climate laws do work. In the most successful countries, climate legislation has bent the emissions curve by at least 15% and sometimes over 20%.
Some of this success has been undone by badly-aligned policies in other areas. If global goals are to be met, climate policy will need to become not just tighter, but also more joined up.