Guest post: How extreme weather conditions could last longer due to climate change
Intensifying heat
In 2018, Europe experienced a particularly severe and long-lasting heat-drought event extending over the whole summer, which would have been “virtually impossible” without climate change. This year, two successive European heatwaves in June and July broke temperature records by large margins, though they were shorter than the 2018 event. The persistent stress from heat and dry weather during the 2018 heatwave had severe impacts on the environment, even though temperatures were not extreme during all that time. At the end of the summer, wheat production losses of 15% had been recorded for Germany. And the levels of the River Rhine were too low to provide sufficient cooling water for power plants or enough depth in its waterways for shipping traffic. The resulting water deficit has carried over well into 2019 in parts of Central Europe. This is leading to a continuation of heat-drought conditions, with severe impacts on forests through increased risks from fire and vermin. There is an ongoing discussion about the different contributions to the observed intensification of heatwaves. First, there is the simple warming effect: the increase in average temperatures results in more hot days and thereby increases both the frequency and duration of heatwaves. Second, local effects such as the “soil-moisture feedback” could also contribute to more severe heat waves. This occurs when soils dry out as temperatures rise, resulting in less evaporative cooling during warm periods and amplified local warming. Further, changes in atmospheric circulation may contribute to more favourable conditions for heat waves in some places. Summer “storm tracks” in the northern hemisphere have already been observed to have weakened, with further change projected. Since summer storms bring periods of moist and chilled air that interrupts heatwaves and droughts, this slower movement can favour longer warm and dry periods. While the direct warming effect on heatwave occurrence is undisputed, this alone cannot explain the very rapid rise in heatwaves observed in a region such as Europe. This means the other mechanisms must also be playing a role. Thus far, however, it is unclear whether soil-moisture feedbacks or circulation changes are the more important contributor. In our new study, we have deployed a novel approach, specifically focusing on the persistence of extremes and their potential drivers.Persistent weather
To that end, we analyse the persistence of specific weather conditions. For example, we look at how warm days cluster together throughout the northern hemisphere. More specifically, we are interested in the probability that a warm period persists for longer than, say, two weeks – and whether this exceedance probability changes with global warming. To test this, we use large “ensemble”, or collection, of climate model simulations from the HAPPI project to look at local weather persistence in a 2C and a 1.5C warmer world – the temperature levels referenced in the Paris Agreement’s long term temperature goal. We then compare these findings with current climate conditions, which are already around 1C warmer than pre-industrial levels. In order to exclude the direct warming effect of climate change on heatwaves from our study, we define “warm” days as those being warmer than the summer average for each scenario (such that there are always 50% warm days and 50% cold days). We also analysed changes in the persistence of dry and rainy periods. In contrast to warm persistence, we use fixed thresholds to define days with rain (above 5mm precipitation) or dry (below 1mm precipitation). Similarly to temperature, changes in precipitation persistence can be due to circulation changes in the atmosphere, feedbacks or simple thermodynamics. For example, a warmer atmosphere can hold more water, leading to more intense precipitation events and therefore to more heavy rain days in our metric. To illustrate the practical significance of the persistence metrics we studied, the figures below shows two examples of periods with extended heat, dry, combined “dry-warm” and rain, relating to extreme weather in Berlin in summer 2018 (left) and Paris in 2016 (right). In each figure, the top chart shows temperatures (grey line) and temperatures relative to the daily average (anomalies, red line). The middle chart shows precipitation, with rainy days highlighted blue and dry days orange. The bottom chart then shows persistent periods with above-average heat (red bars), extended dry or dry-warm periods (orange and purple) and rainy periods (blue).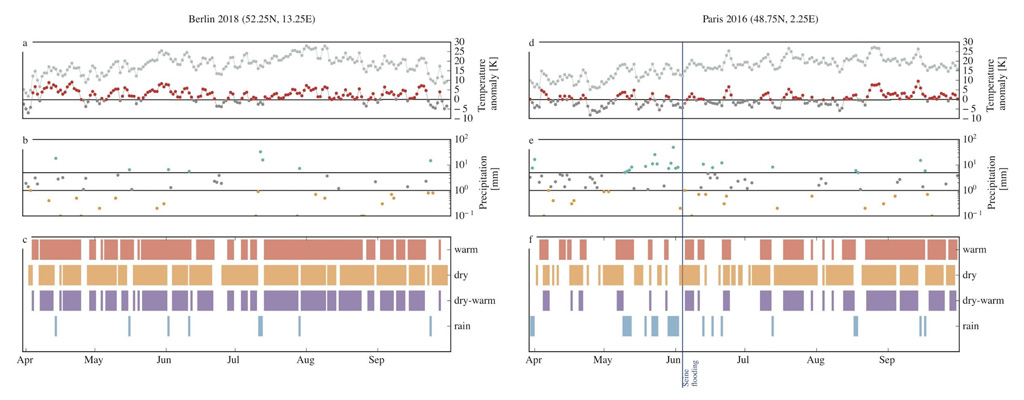
Extended extremes
Our results show that summer warm periods are projected to become more persistent in the northern hemisphere mid-latitudes – such as Europe or North America – in the 2C scenario as compared to a present day climate with roughly 1C of warming. Relating back to the 2018 heatwave in Europe, the probability of finding a three-week warm period in central Europe in any given year would relatively increase by 4%. This small but significant increase means that above-average “warm” days will cluster together for longer periods in future. This increase also acts on top of the impact on heatwave durations already expected from the thermodynamic contribution of overall warming, which could be identified by looking at days exceeding a single fixed temperature threshold in all climate conditions. We find that dry and rainy periods are also projected to become longer if warming reaches 2C. In central and eastern North America, for example, two weeks without rain are projected to become about 13% more likely, and in central Europe the probability of finding seven consecutive days of heavy precipitation relatively increases by about 18%. We have also looked into compound warm-dry periods and found that their persistence increases by up to 20% in eastern North America. The figure below summarises our results, showing that many parts of the northern hemisphere will see persistent extreme weather becoming more likely (shades of purple) if warming reaches 2C. For each region, the boxes shows the relative change in likelihood for periods of persistent warm (upper left quadrant), dry (upper right), dry-warm (lower left) or rain (lower right). Purple shading indicates an increased likelihood of up to 50% while green shading shows decreased likelihood. Where mechanisms responsible for the change in likelihood could be identified, these are indicated with symbols for storm tracks, soil moisture or rainy-day frequency.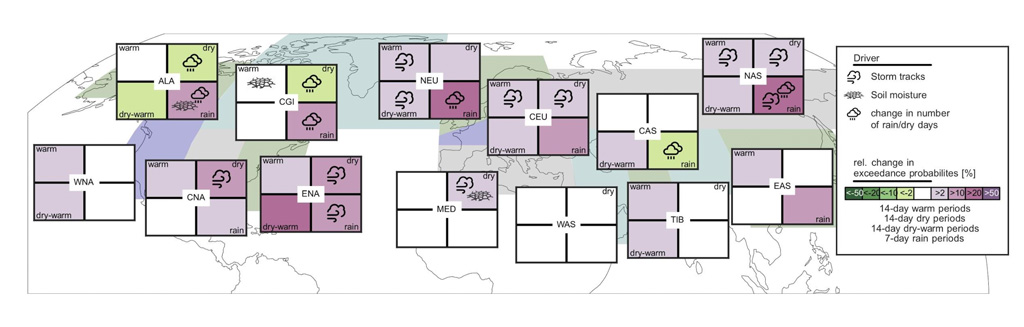
Storm tracks
Our results suggest that a summer slowdown in the “jet stream” plays an important role in the extended persistence of dry and warm periods, as the chart above shows. The jet stream is a band of fast-flowing air, high up in the atmosphere, that steers weather patterns and storm tracks. We find that warm and dry periods tend to persist longer in months with low storm track activity. In regions affected by the North Atlantic storm track, the increase in dry and warm persistence can be linked to the decreased storm track activity. In some regions, it might also contribute to increased rain persistence. The fact that a warmer atmosphere can hold more water partly explains the increase in rain persistence projected for the high latitudes, such as northeast Europe. In most mid-latitudinal areas, however, we find that this effect plays only a minor role – and in regions such as central Europe, rain persistence increases even though the number of rain days decreases We find soil moisture feedbacks to be important in some regions. For example, we identify a decrease in soil moisture in the Mediterranean as a driver of longer dry periods in the region in the future. This does not mean that soil moisture feedbacks are not contributing to extreme weather events in other regions – they often are. Instead, we were not able to clearly identify this mechanism as a driver of increased persistence, separate from other contributions. Overall, our findings suggest that global warming will lead to more persistent local weather conditions in northern hemisphere summers. Averaged over the mid-latitudes and in many individual regions, warm, dry and rainfall extremes are projected to become more persistent if warming reaches 2C above pre-industrial temperatures. Added to the intensification already expected from generally hotter summer temperatures and heavier precipitation as the world warms, this increased persistence scales up the potential risks from future weather extremes. In contrast, our results show that most of the increases in persistence could be avoided – along with the related risks – if the world stays below the 1.5C limit of the Paris Agreement.Article information
Pfleiderer, P., Schleussner, C.-F., Kornhuber, K. and Coumou, D. (2019) Summer weather becomes more persistent in a 2C world, Nature Climate Change, doi: 10.1038/s41558-019-0555-0