Guest post: How the Keeling Curve will need to bend to limit global warming to 1.5C

Guest author
01.12.22Guest author
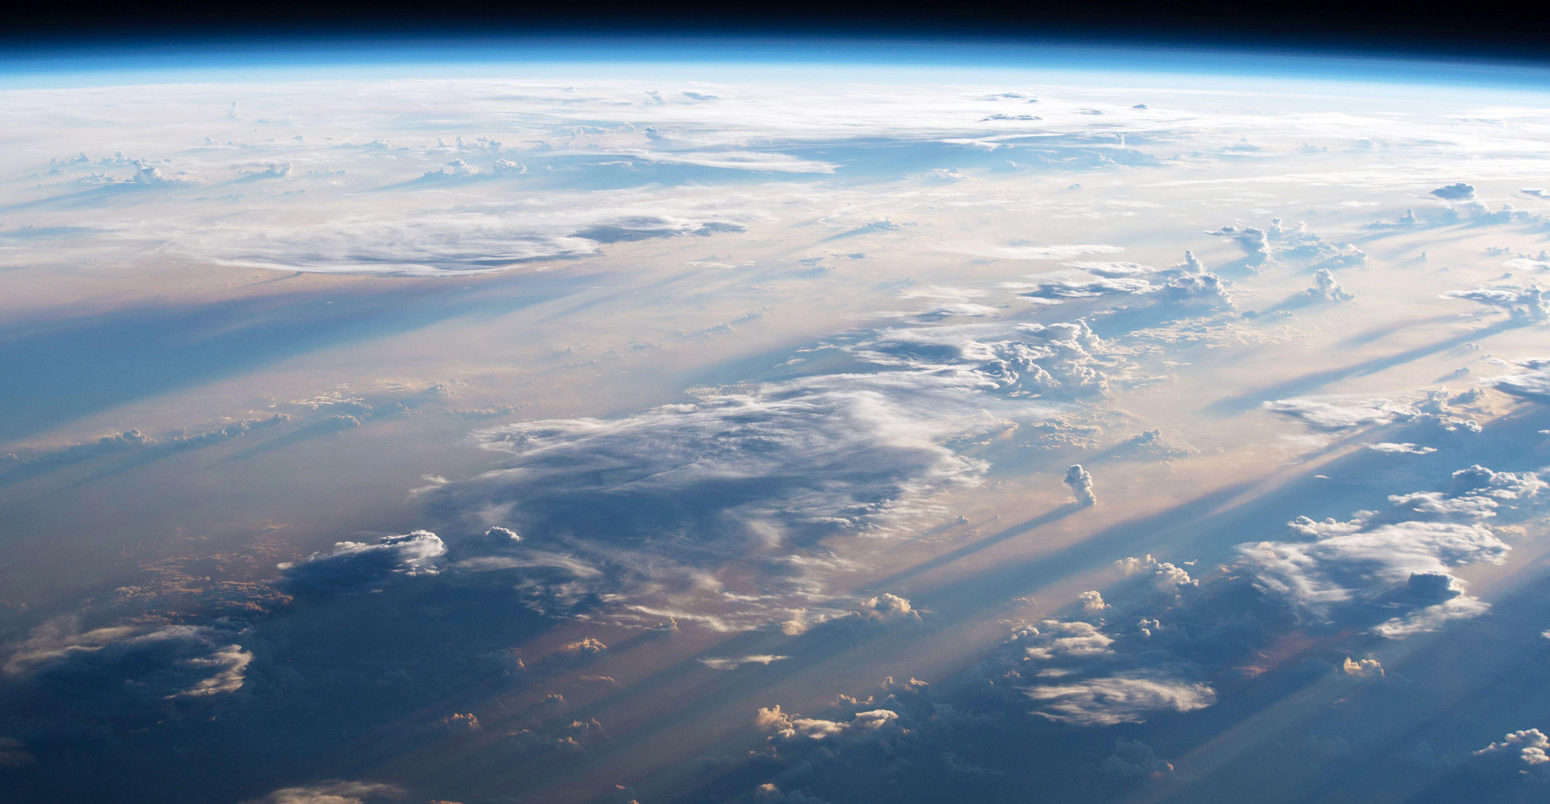
12.01.2022 | 12:01amThe Keeling Curve is an iconic graph showing how levels of carbon dioxide (CO2) have been building up in the atmosphere, driving an increase in global temperatures.
However, if global temperature rise is to be halted, the accumulation of CO2 in the air needs not just to end, but go into reverse. For the Keeling Curve, this would involve a complete change in direction – rising more slowly at first, but then stopping and declining.
If the Paris Agreement target of limiting global warming to 1.5C is to be met, this change in direction needs to begin within the next few years and the curve needs to stop rising before the middle of the century.
Our Met Office forecast for 2022 suggests that the increase in CO2 levels this year will be slightly slower than we’ve seen over the past decade. However, this is down to a temporary strengthening of natural carbon sinks and is likely to be short-lived.
Acceleration
Concentrations of CO2 are building up in the atmosphere because of human-caused emissions from fossil-fuel burning and deforestation. They are now at levels 50% higher than before the Industrial Revolution. Once in the atmosphere, CO2 can remain there for hundreds of years. The huge scale of global emissions means that it is being added to the atmosphere much more rapidly than natural processes can remove it.
Global emissions have steadily increased over the past 60 years, which means that CO2 has been building up in the atmosphere at an accelerating rate.
This can be seen in the figure below, which shows the full record of the Keeling Curve. In the late 1960s, CO2 levels were rising at a rate of about 1 part per million (ppm) per year. By the early years of the 21st century, this rise had accelerated to 2ppm per year, and it accelerated further to nearly 2.5ppm annually in the last 10 years.
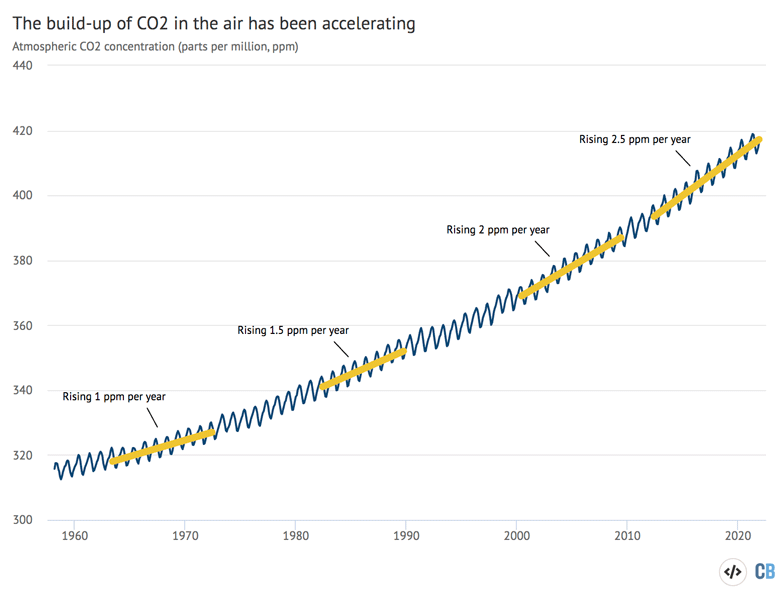
Even though global emissions have been relatively constant over the past decade, CO2 levels in the atmosphere have continued to rise. As mentioned above, this is because the emissions are causing additional CO2 to enter the atmosphere that is only being removed slowly by natural processes.
As the CO2 concentrations build up, this further strengthens the greenhouse effect and causes global temperatures to rise.
If the rise in temperatures is to be brought to a halt, then CO2 emissions need to stop. Alternatively, if emissions are not stopped completely, there needs to be an enhanced removal of CO2 from the atmosphere so that the overall effect is neutral in order to achieve “net-zero” emissions.
The future Keeling Curve for 1.5C
The Intergovernmental Panel on Climate Change (IPCC) has a set of pathways detailing how society – and its emissions – could evolve over this century. One of these pathways, known as SSP1-1.9, sees global warming overshoot 1.5C in the middle of the century, but then drop back down to below 1.5C by the end of the century.
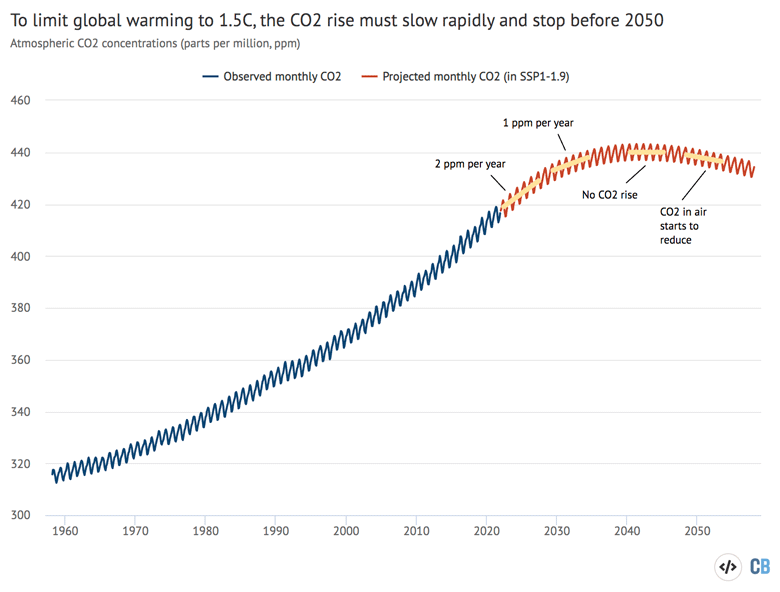
The chart below shows how the SSP1-1.9 scenario would play out for atmospheric CO2 concentrations up until 2058 (red line) – when the Keeling Curve measurements will have been taken for a century.
In this scenario, the build-up of CO2 in the atmosphere slows rapidly in the coming years. In the early 2020s, the rate of CO2 rise slows initially to 2ppm per year and then further to 1ppm per year in the early 2030s. By the early 2040s, the rise has halted – there is no further build-up of CO2 in the atmosphere. From them on, in this scenario, CO2 levels start to fall.
However, it is important to note that, even as CO2 concentrations start to fall, the climate would not be expected to start cooling immediately because the temperature response to CO2 is sluggish. The slight drop in CO2 concentrations merely offsets the warming from past emissions that is still “in the pipeline”, so temperatures will remain high for longer.
Forecast for 2022
Although the long-term rise in CO2 concentrations is driven by human emissions, the rate of rise speeds up and slows down from year to year because of variations in the strength of natural carbon sinks provided by land ecosystems and the oceans.
These variations are driven by climate variability. For example, wetter conditions tend to bring greater large-scale plant growth and hence more uptake of CO2 by the land surface. Conversely, drier conditions might temporarily see a large release of carbon from soils and forest fires.
These variations show a strong correlation with the climate phenomenon the El Niño–Southern Oscillation (ENSO). For example, as we had predicted, the biggest annual CO2 rise on record was between 2015 and 2016, when the large El Niño event caused hotter, drier conditions across much of the tropics, leading to widespread wildfires and an overall lower carbon uptake.
Between 2019 and 2020, despite a large – but temporary – reduction in global emissions associated with societal responses to the Covid-19 pandemic, the build-up of atmospheric CO2 was similar to previous years as a result of mild El Niño-like conditions again causing a temporary weakening of natural carbon sinks.
In 2021, the opposite occurred – mild La Niña conditions led to temporarily enhanced carbon uptake, leading to a slower CO2 rise than the previous few years. With a second “double-dip” La Niña now underway, the Met Office predicts a similar situation in 2022.
We forecast that this year CO2 levels will rise by 2.14ppm (±0.52) compared to last year. This increase is smaller than the average of 2.45 ppm over the last 10 years.
Although this is close to the average rate of rise needed in the early 2020s to be on track with the IPCC 1.5C scenario, it is only happening because of the temporary strengthening of natural carbon sinks, and this is likely to be short-lived.
Once the La Niña event has ended, we would expect the rate of CO2 rise to return to about 2.5ppm per year, unless emissions start to fall substantially.
Is the world on track?
In its influential 2018 report, the IPCC concluded that to limit global warming to 1.5C, global CO2 emissions need to start falling rapidly – declining by half by the 2030s and reaching zero in the middle of this century.
Similarly, as the figure below shows, more recent calculations with various Earth System models suggest that for CO2 to track the SSP1-1.9 scenario, fossil fuel emissions would need to reach zero in the 2050s or shortly afterwards.
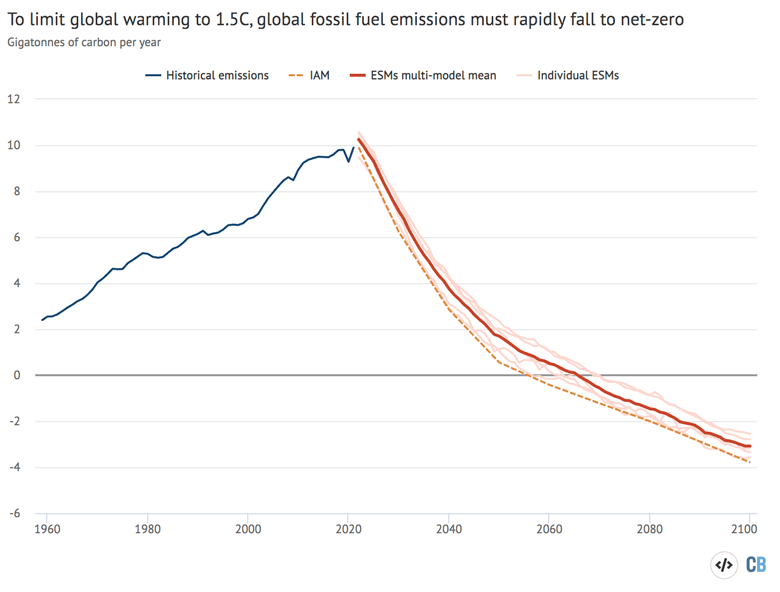
This scenario assumes an expansion of global forests, which acts to take up some CO2 from the atmosphere, but nowhere near enough to offset fossil fuel emissions at current levels. The expansion of forest cover merely delays the date when fossil-fuel emissions need to reach zero, rather than substituting for emissions reductions.
After that, fossil fuel emissions become net negative – with more CO2 being removed from the atmosphere than being added in. Again, this removal is in addition to uptake by enhanced forest cover – it is assuming technological CO2 removal.
The SSP1-1.9 CO2 concentration pathway gives us another useful benchmark to track progress on the international ambition to limit global warming to 1.5C.
While there is growing scepticism around whether the 1.5C target is politically feasible, at the moment it can be argued – from the perspective of the Earth System, at least – that it is still physically possible to “keep 1.5C alive”. Models suggest that warming due to CO2 will cease when total emissions reach net-zero.
However, if the rate of rising atmospheric CO2 does not begin to slow markedly within the next few years, the chances of limiting global warming to 1.5C will rapidly vanish.
-
Guest post: How the Keeling Curve will need to bend to limit global warming to 1.5C