Guest post: How weather forecasts can spark a new kind of extreme-event attribution

Extreme weather events across the world this year have been hitting the headlines at an alarming rate.
To name a few, 2021 has seen flooding in central Europe, China and New York, a record temperature of 49.6C in Canada and wildfires in Siberia, North America and the Mediterranean.
With each tragic event comes the question of whether human-caused climate change made it more severe or more likely. The burgeoning field of climate change “attribution” has stepped up to the challenge. While 10 years ago it might have taken months to fully analyse an individual weather event, scientists are now able to provide an answer in just days or weeks.
Because we cannot make direct observations of a world without human influence on the climate, all attempts to answer this question involve some kind of modelling. However, traditional climate models can struggle to simulate the most extreme weather events. To deal with these compromises, researchers have traditionally relied on comparing results from several different approaches to assess the robustness of their conclusions.
We suggest that a better approach would be to use numerical models that have demonstrated their ability to simulate the event in question through a successful – or at least reliable – weather or seasonal forecast.
In our recent study, published in the Proceedings of the National Academy of Sciences, we demonstrate – for the first time – an attribution study that uses a state-of-the-art operational weather forecast model. We tested our approach by assessing the European winter heatwave of 2019 – an event the model successfully predicted.
We find that the direct impact of the extra carbon dioxide (CO2) that humans have pumped into the atmosphere made the event 42% more likely for the British Isles and at least 100% (two times) more likely for France.
Extreme event attribution
In order to quantify how global warming has affected an extreme weather event, scientists flip the focus of the question to look at what might have happened in a world without any human influence on the climate.
Since there is not an Earth without human influence, we have to turn to global climate models to explore this question. These models incorporate all the physics of what we know about the Earth system and allow us to run these kinds of “what if” experiments.
Using the models, we perform simulations of both the real “factual” world, but also an alternative “counterfactual” world, in which humanity has not emitted hundreds of billions of tonnes of CO2 and other greenhouse gases into the atmosphere.
We then compare the weather in these two simulations to see if – for example – we are seeing more occurrences of the event we are interested in, or if those occurrences are more intense.
In order to have confidence in the results we find, we do not just run the model once – we run these models tens to hundreds of times to build up a full picture of the weather in the two worlds.
However, while climate models are an incredible feat of modern science – worthy of a Nobel Prize – they are not perfect. Climate models have biases and deficiencies – many of which we know about – that affect how much faith we can have in the answers they give us about something as complex as an individual weather event.
For example, we know that many climate models struggle to simulate sufficient numbers and persistence of high-pressure “blocking” weather patterns over Europe. These circulation patterns are often involved in the heat extremes that the continent experiences.
In our paper, we instead turn to a natural alternative to climate models that could provide us with a more robust answer to the same question: weather forecast models.
Numerical weather prediction
Weather forecast models – sometimes called “numerical weather prediction” or NWP models – and climate models are really two sides of the same coin. Some institutions involved in both weather forecasting and climate change projections use different configurations of the same model for seperate weather and climate applications. One example is the UK Met Office’s “unified model”.
However, due to the value of a good weather forecast, NWP models are generally more detailed than their climate model cousins.
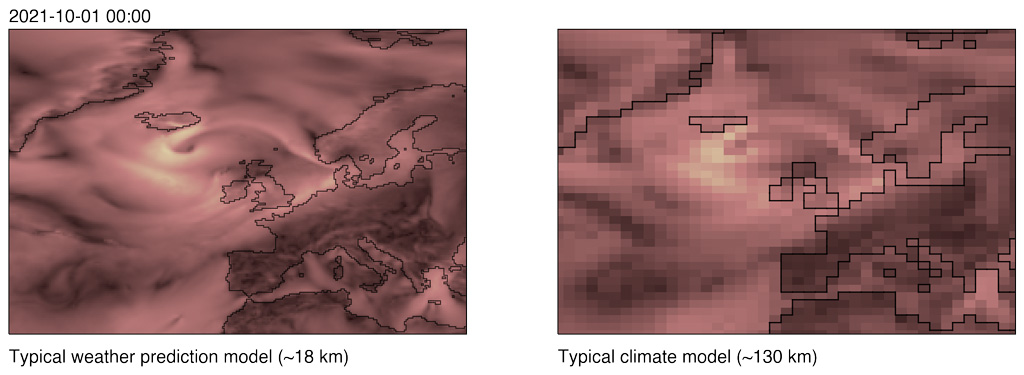
For example, all weather and climate models divide up the Earth’s surface and overlying atmosphere into a giant grid. They then calculate climate variables – such as temperature, humidity and rainfall – for each grid cell. A NWP model is typically run at a much higher “resolution” – that is, it has more, smaller grid cells – allowing it to simulate processes that a climate model cannot. You can see the extra detail in the illustrations below of a typical NWP model (left) and climate model (right) showing Europe and the North Atlantic.
“Nesting” higher-resolution regional models into global climate models is widely used in attribution studies, but cannot address biases in the simulation of large-scale atmospheric flow regimes resulting from inadequate global resolution.
Even a small reduction in resolution often changes the representation of extreme events in numerical models. The additional complexity of NWP models means they have the potential to be more suitable for studying the most extreme events than conventional climate models.
One example of this is the Pacific Northwest heatwave at the end of June this year. Many climate models appear to struggle to simulate events of a similar magnitude – even under significantly higher warming levels. However, the event was successfully predicted by several weather forecast centres around a week ahead. This suggests the NWP models used by these centres evidently do not share the same issues that many climate models appear to have in representing an event of this magnitude.
The next crucial aspect of using weather forecasts is that, since they are run in order to predict the weather, it is easy to demonstrate whether an NWP model is able to capture the processes required to credibly simulate a particular extreme event. Put simply, if they successfully predicted the event then they clearly can capture the processes necessary.
Since climate models are not run in order to simulate a single event, demonstrating the same in a climate model is considerably trickier. Being able to accurately represent the event we are interested in means that we can have more confidence in using the model to examine the impacts of the human influences on it.
In addition, the fact that successful weather forecasts produce simulations of a single specific event mean that we can unequivocally claim to be performing an attribution of the actual sequence of physical events that occurred. In climate models, it is necessary to analyse a mixture of different extreme weather events that share a key feature – for example, that they all produced a heatwave – but the reasons behind why they were extreme could be very different.
There is also a practical argument for using NWP models for attribution – they are run routinely at most weather forecast centres, typically at an hourly or other sub-daily time step. This means that if the scientific community were able to produce a forecast-based attribution methodology that weather forecast centres could implement relatively easily and at a low cost, it could pave the way for an operational attribution system that would be able to provide answers extremely rapidly after the event has occurred – and potentially even before.
European winter heatwave of 2019
As a case study, we tested our approach by assessing the contribution of a specific component of human influence on a winter heatwave that hit Europe in 2019.
Towards the end of February 2019, much of northern and central Europe experienced record-breaking winter temperatures. In particular, the UK observed multiple instances of winter temperatures exceeding 20C, culminating in a new record high temperature for a winter month when 21.2C was recorded at Kew Gardens in London (pdf).
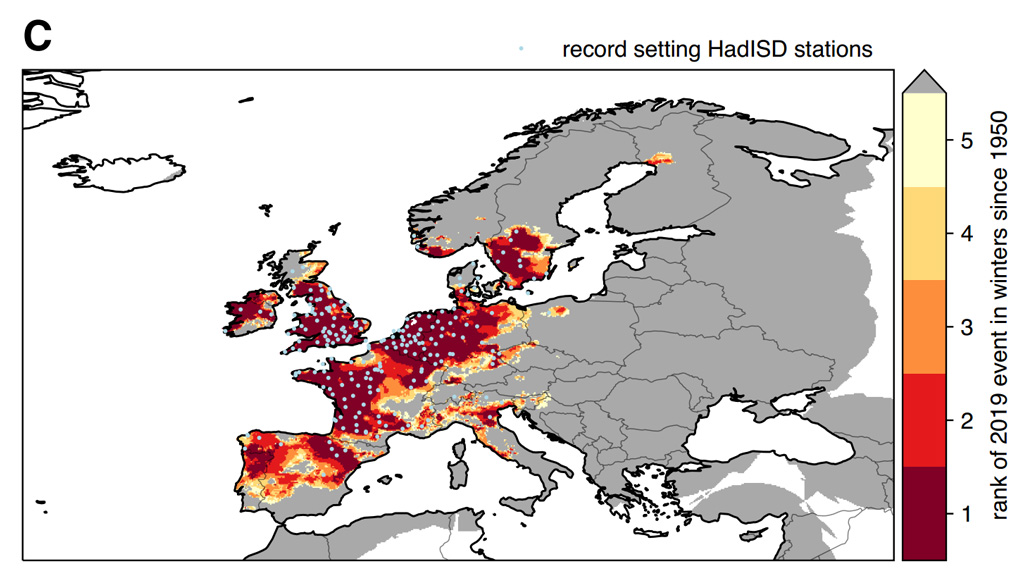
The map below shows how maximum temperatures across Europe during the 2019 heatwave ranked in comparison to all winters since 1950. The darkest red shading indicates locations where a new winter record was set.
Despite the exceptional nature of the heatwave – it was quantified by one study as being expected to occur less than once every 1,161 years in the present climate – it was extremely well predicted by the European Centre for Medium-Range Weather Forecasts around 10 days before it happened.
Within the same NWP model that produced those successful predictions, we reduced the CO2 concentrations back to pre-industrial levels in order to assess what impact this would have on the heatwave. We assume pre-industrial global CO2 concentrations of 285 parts per million (ppm), which compares to around 410ppm in 2019.
There is a key point to note about this experiment design – we are not measuring the complete impact of human influence on the heatwave, just one component of it: the direct warming effect of the additional CO2 in the atmosphere over the forecast lead time.
Although the extra CO2 is a key part of the human contribution to the event, it does not take into account the long-term impact that higher CO2 levels are having on the planet – such as warmer oceans and reduced Arctic sea ice.
In effect, our model simulations of the February 2019 heatwave assume that CO2 levels had dropped to 285ppm the instant the simulation begins. As our forecasts are just days or weeks in length, the atmosphere has only just started to adjust to the dramatic change in CO2 levels. Therefore, the results we obtain for the direct impact of CO2 on the heatwave very much represent a lower bound on the actual impact.
Nonetheless, we found that the direct impact of CO2 had an unexpectedly rapid impact on the heatwave in our forecasts. Even where they started only three days before the heatwave, reducing the CO2 concentrations back to pre-industrial levels made it measurably less intense.
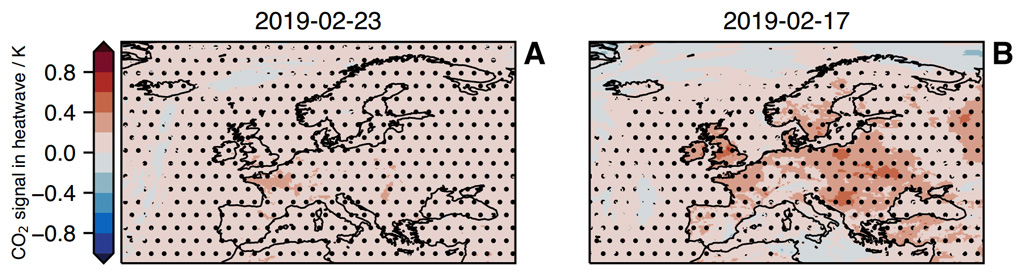
You can see this in the maps below, which show the warming influence (red shading) of the additional CO2 during the heatwave in forecasts initialised three days (left) and nine days (right) before the event.
In order to ensure that our findings were not due to the chaotic nature of the weather – that our perturbations were not simply resulting in different weather being forecast – we also ran an experiment with increased CO2 concentrations of 600ppm, and found that this had the opposite effect.
Overall, we found that reducing CO2 concentrations back to pre-industrial levels reduced the peak of the heatwave by around 0.4C, based on a forecast initialised nine days before the heatwave. Although this is not a huge amount, it is worth restating that this is only one component of the human contribution to the heatwave and so should be considered a very conservative estimate.
Nonetheless, the 0.4C difference would have been enough that significantly fewer temperature records would have been broken during the spell of hot weather.
In addition to being more severe, human-caused CO2 also made the event more likely. In the British Isles, for example, the direct CO2 effect increased the probability of the unseasonable heat in the weather forecast by 42%. For France, it is at least 100%.
What’s next?
Our work so far represents just the first few steps towards an operational forecast-based attribution system.
Our next aim is to try and provide a more complete estimate of the total human contribution to an extreme weather event. In order to do this, we are going to estimate what the initial state that the model starts in would look like without any human influence on the climate.
This will require us to both cool the oceans and make changes to the amount of sea ice to reproduce a more accurate reflection of what the world would like without global warming.
If we begin the weather forecast model from this state without human influence and reduce CO2 concentrations back to pre-industrial levels, then we might be able to create a picture of what this same extreme weather event would have looked like if it had occurred before any human-caused greenhouse gas emissions.
Article information
Leach, N. J. et al. (2021) Forecast-based attribution of a winter heatwave within the limit of predictability, Proceedings of the National Academy of Sciences, doi:10.1073/pnas.2112087118