Guest post: Reviewing the summer of extreme weather in 2021

Guest authors
09.08.21Guest authors
08.09.2021 | 3:15pmFrom heatwaves and hurricanes in the US to flooding in Europe and China, the weather over recent months has frequently hit the headlines.
So, with the summer coming to a close for much of the northern hemisphere, this is an opportunity to look back at some of the extreme weather of the past season and the impacts it has had on the lives of millions of people.
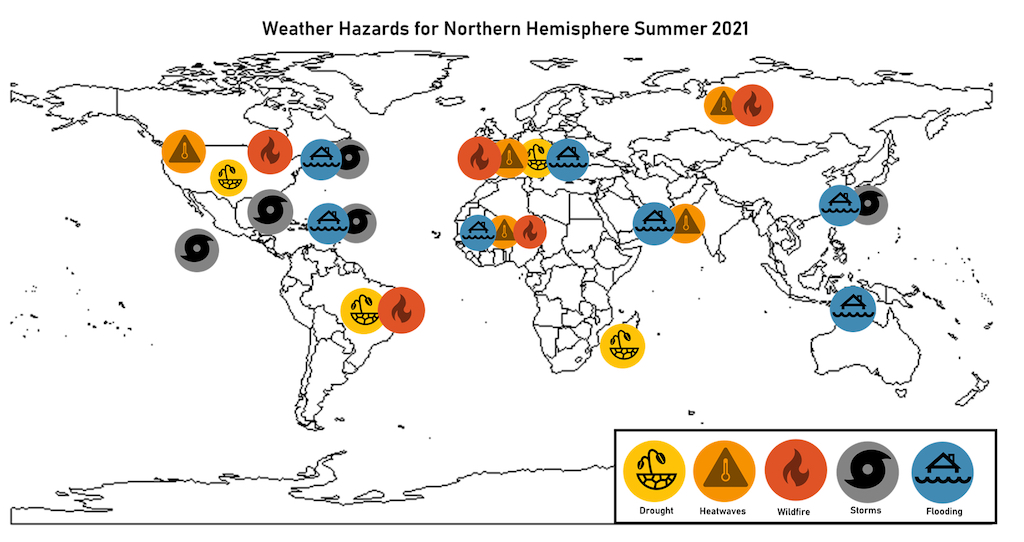
The map below summarises the types of extremes that have struck different parts of the world this summer – including storms and flooding, heatwaves, wildfires and drought. The article will cover them in turn, focusing predominantly on the northern hemisphere.
The latest assessment report from the Intergovernmental Panel on Climate Change (IPCC) – also published this summer – concluded that it is an “established fact” that human-caused warming is causing increases in the frequency and intensity of extreme weather events around the world.
Despite this knowledge, the severe weather seen throughout this summer demonstrates that, globally, much of society still is not prepared for the impacts of a changing climate.
Storms and flooding
More than 50 hurricanes, cyclones and extratropical storms made their presence felt during this year’s northern hemisphere summer.
Hurricane Elsa, in early July, was the first to hit Barbados in more than 60 years. Tropical storm Grace in mid-August brought damage and flooding to Haiti just days after an earthquake. It then continued on to become a hurricane – killing eight people in Mexico.
Also in August, Hurricane Henri was the first tropical cyclone to make landfall in Rhode Island since Hurricane Bob in 1991. (It is rare for a hurricane to travel that far north.) And Hurricane Ida caused devastation from Louisiana – where it made landfall – all the way up to New York and New Jersey in the northeast.
Rainfall from tropical storm Ida gushing into the New York City subway pic.twitter.com/7wBH5qtM1U
— David Begnaud (@DavidBegnaud) September 2, 2021
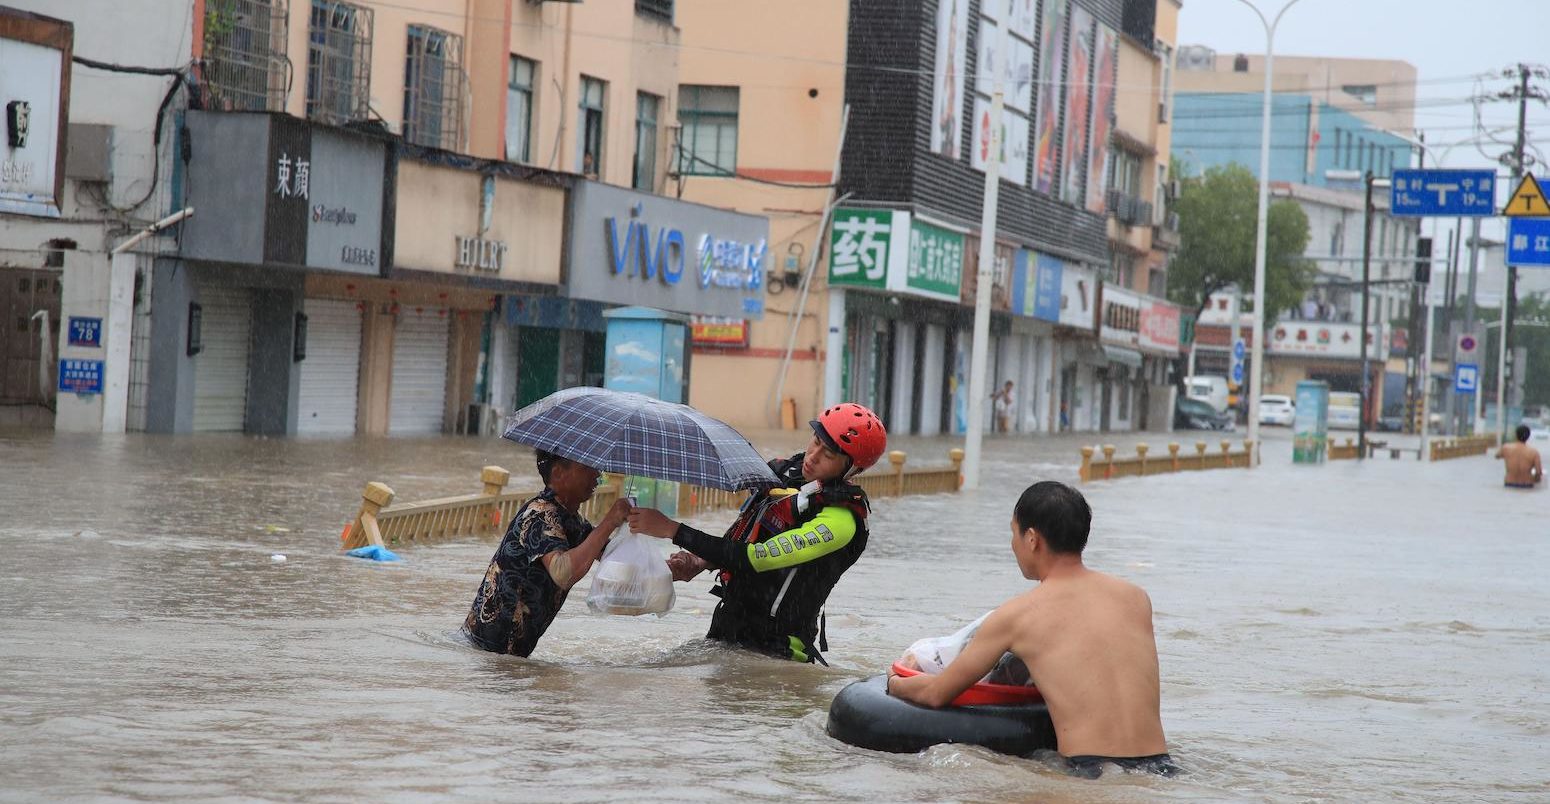
Away from the Atlantic, Typhoon In-fa caused record-breaking flooding in China, forcing as many as one million people to relocate and killing 300.
Elsewhere, there were deadly flooding events unconnected with tropical cyclones. In Nigeria, for example, floods caused a bridge to collapse, killing 21 people. Ghana and Burkina Faso saw crops lost and roads damaged during their monsoon season, while flooding in India caused landslides and at least 180 deaths.
In Europe, heavy rainfall and mudslides in Turkey killed 17 people, while flash flooding in London in July caused water to gush into London Underground stations.
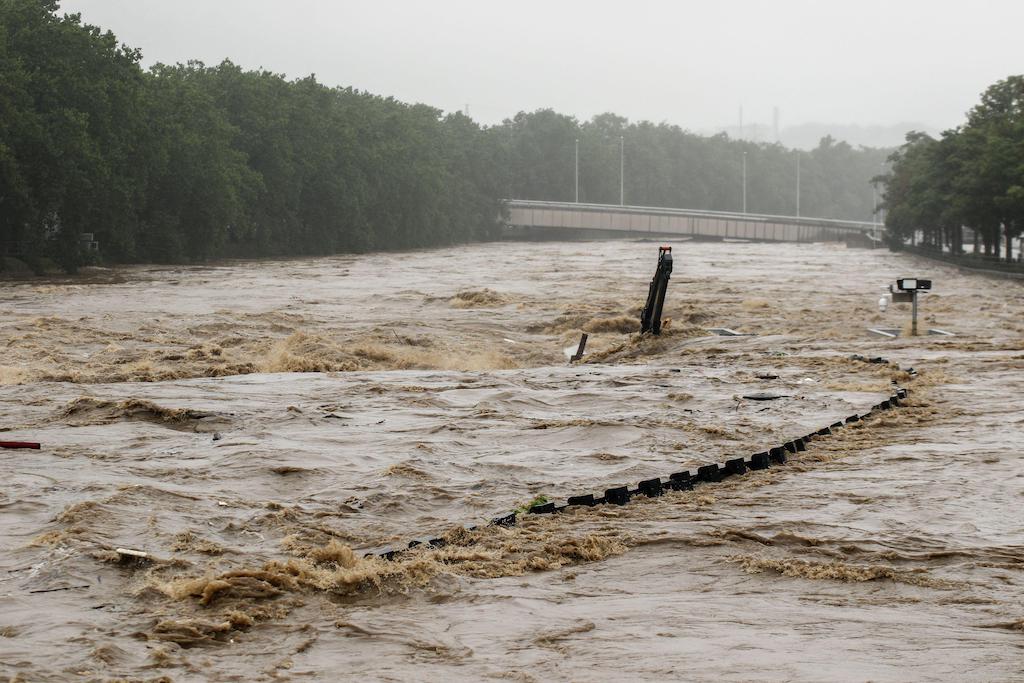
River flooding in Germany, Belgium and the Netherlands in mid-July made headline news across the continent after resulting in more than 180 deaths. The immediate cause of the floods was a slow-moving low-pressure weather system, but a rapid attribution study found that human-caused climate change had made the event up to nine times more likely.
An increase in extreme rainfall events are expected as a result of climate change because a warmer atmosphere can hold more moisture and can also enhance evaporation in some areas. Climate model projections indicate that almost the entire world is expected to see an increase in extreme precipitation as it warms.
Heatwaves
Every region of the northern hemisphere in summer was touched by record-breaking temperatures and extreme heat in 2021 (see map lower down).
Perhaps the most prominent heatwave this summer hit the Pacific north-west at the end of June. Portland, Oregon, broke temperature records on three consecutive days, with the hottest being 46.6C (116F). More than 465 people died in Canada and analysis shows that the heatwave caused more than 600 excess deaths in Washington and Oregon. Other impacts included power shortages and melting homes.
A rapid attribution study found that the event would have been almost impossible without climate change.
Elsewhere, a persistent heatwave in Siberia helped fuel wildfires all summer, with “mind-boggling” temperatures hitting 48C. And Pakistan, northern India and parts of the Middle East also saw heatwaves, where temperatures surpassed 52C in places. (Jacobabad in Pakistan and Ras al Khaimah in the United Arab Emirates are two places where scientists have previously recorded a “wet-bulb” temperature – which combines temperature and humidity – exceeding 35C, which is the limit of what the human body can cope with.)
At the end of July, parts of North Africa and Europe were also hit by a heatwave. This brought record-breaking temperatures to Northern Ireland of 31.4C in County Armagh and saw the first “extreme heat warning” issued in the UK. Preliminary figures from the UK’s Office of National Statistics estimates that the heat resulted in between 400 and 800 excess deaths.
In mid-August, a heatwave across the Mediterranean region caused excess deaths in Spain, Italy and Greece. Record-breaking temperatures were recorded in Spain (47.2C) and for Europe as a whole (in Sicily at 48.4C). Tunisia’s capital city, Tunis, saw record-breaking temperatures of 49C, which brought power failures to the city.
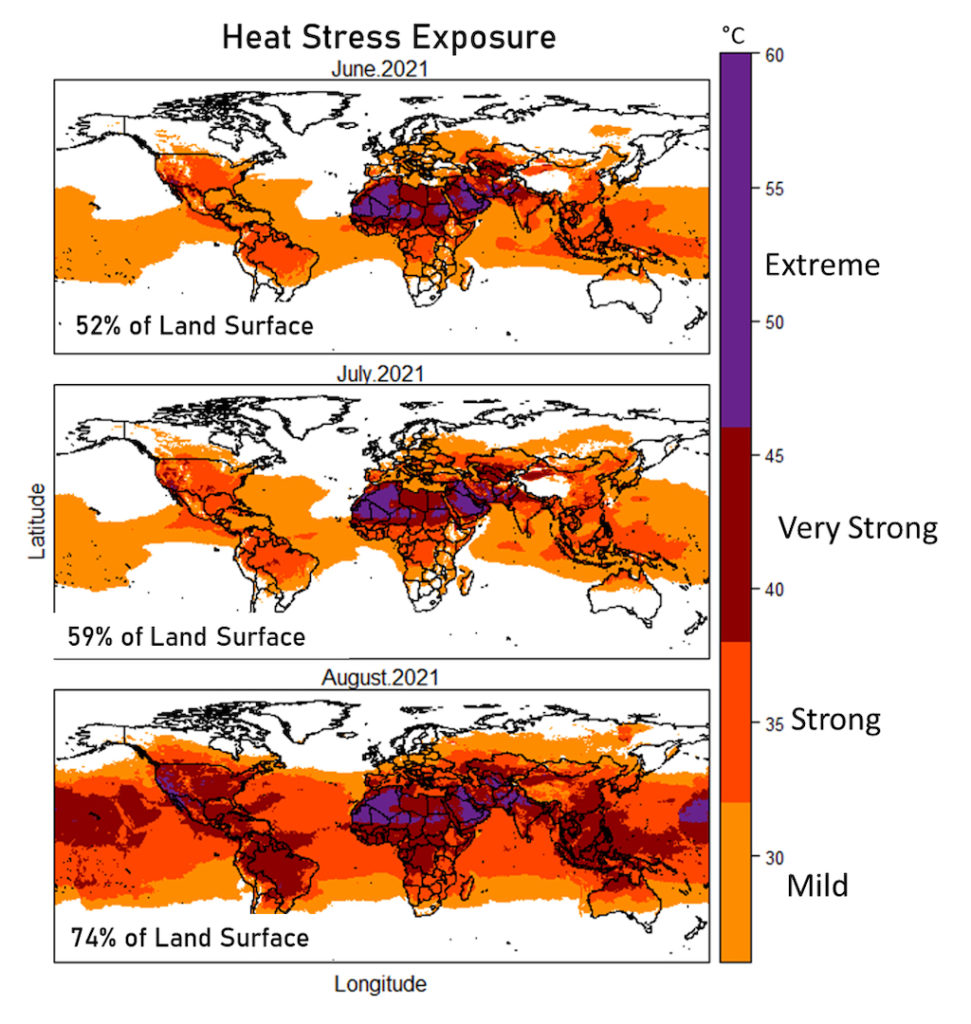
The maps below show how heat stress exposure varied across the world in June (top), July (middle) and August (bottom), with purple shading showing “extreme” conditions. The map shows that August saw heat stress of some kind in 74% of land regions.
Being extremes in temperature, heatwaves are intrinsically linked to climate change and have increased in frequency and duration globally. When baseline temperatures rise this in turn leads to a raised likelihood of extremes in temperature.
Wildfires
Wildfires affected many regions of the world this summer, and often occurred with other hazards during this season. As mentioned above, devastating wildfires took hold across more than 1.5m hectares of Siberia, with the smoke they produced even reaching the north pole 3,000km away. This year’s fires are the largest in Russia’s history.
Huge wildfires also hit much of the Mediterranean. For example, fires killed more than 69 people in Algeria and forced thousands of people from their homes in Greece and Turkey. In Israel, an area of 1,700 hectares was destroyed – the worst fire damage seen in years. In EU countries, more than 180,000 hectares were burned in 2021.
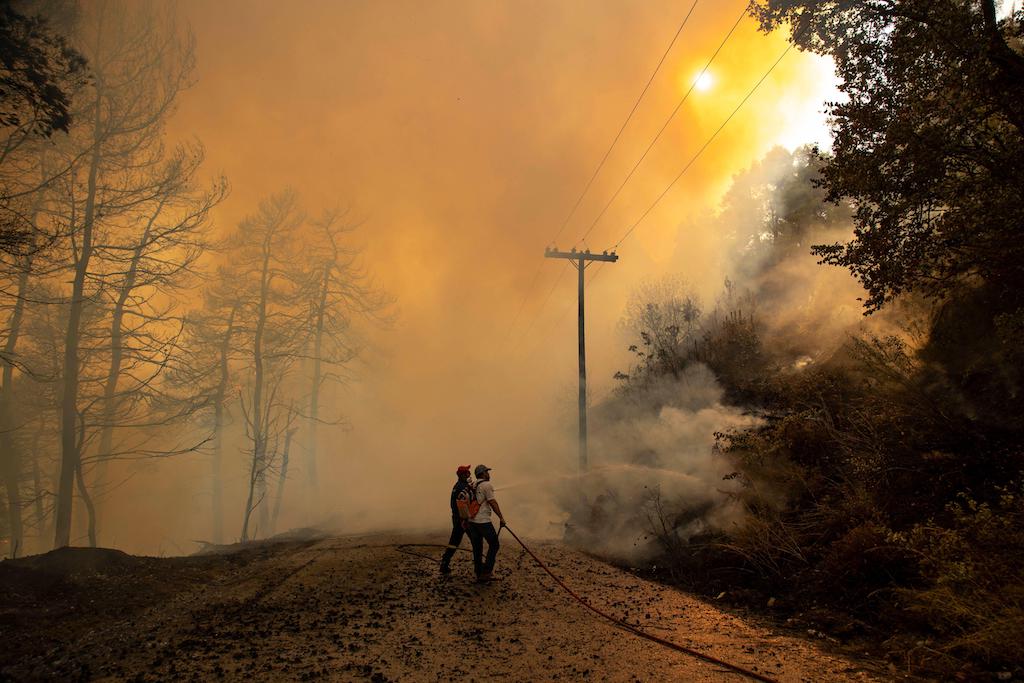
Wildfires also hit North America again this summer. The US has seen around 2m hectares destroyed by fires, while Canada was hit by 300 active fires during July and the whole village of Lytton was burned to the ground in the state of British Columbia.
The hot and dry conditions that lead to wildfires are increasing in some areas as the climate warms, including in the western US, Iberian Peninsula and Brazil. The way that the land is managed also plays a role – for example, forest management techniques can be used to help prevent catastrophic wildfires.
Drought
While drought conditions in a particular region frequently extend beyond a single season, this summer has seen droughts continue and worsen across the world.
The map below shows a global map of drought conditions in August, with the shading red, orange and yellow shading indicating areas that have been drier than normal.
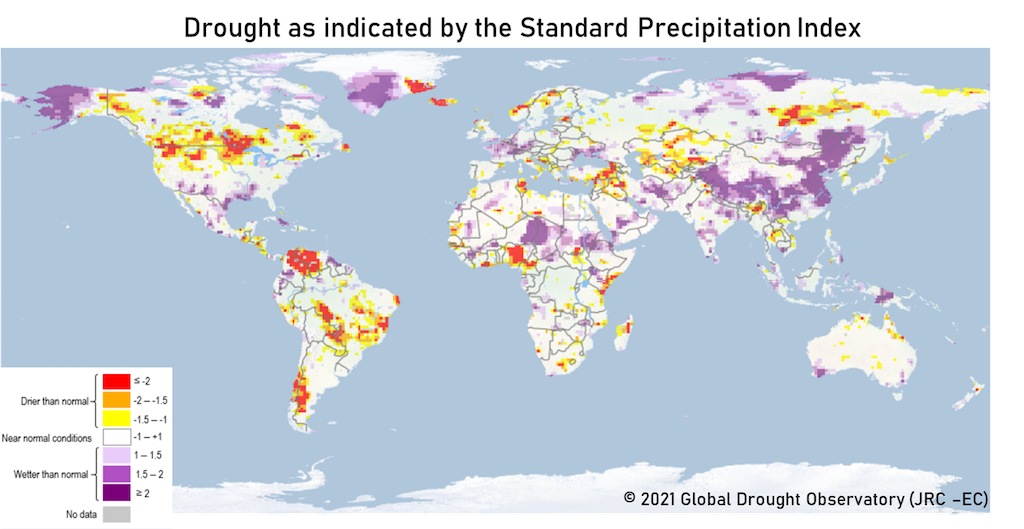
For the northern hemisphere, the map shows that the US and Canada stand out for dry conditions. In June 2021, an ongoing drought covered 39% of the US. At the time, more than 137 million people were affected by drought conditions.
In southwestern US, Lake Mead – the US’s largest reservoir – is currently at its lowest level since it was built in the 1930s, which is also impacting the Hoover Dam’s ability to generate electricity. There has been the first water shortage declaration as a result in the US.
(In the southern hemisphere, the map shows that Madagascar’s drought – described as its worst in 40 years – has continued, and is now causing widespread food shortages. The United Nations said the country is on the brink of experiencing the world’s first “climate change famine”, according to BBC News. Brazil is also having its worst drought in 91 years.)
Drought is yet another type of extreme weather where the influence of climate change can already be seen.