Guest post: Ranking the reasons why the Larsen C ice shelf is melting

Dr Ella Gilbert
04.14.22Dr Ella Gilbert
14.04.2022 | 4:00pmScientists know the surface of the Larsen C ice shelf in Antarctica is melting, making it vulnerable to collapse. For the first time, we can rank the most important causes of melting over the recent past.
In a new two-part paper in Journal of Geophysical Research: Atmospheres, we show how the amount of energy reaching the ice from the sun is the dominant factor, followed by warm winds, clouds and weather patterns. These drivers of melting can interact and overlap to reinforce or counteract each other, so it is a complex picture.
Understanding what is causing melting over Larsen C is vital as it will help predict the future of the ice shelf, which will have knock-on consequences for sea levels worldwide.
In 2002, Larsen C’s neighbouring ice shelf, Larsen B, experienced melting so severe that it eventually caused the shelf to collapse completely.
Vulnerable to collapse
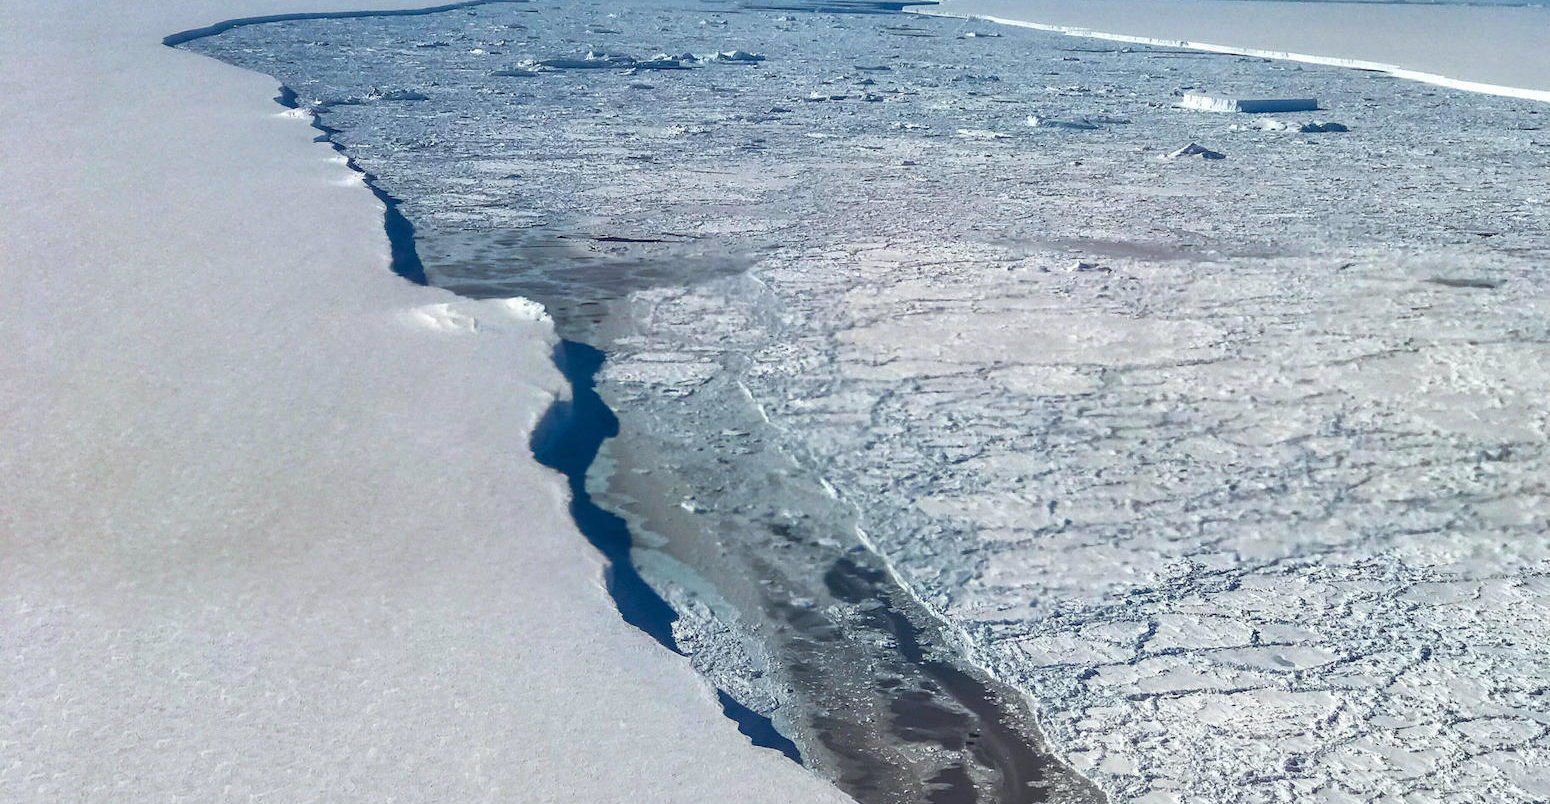
Larsen C is a floating platform of ice on the eastern side of the Antarctic Peninsula, covering an area of 47,000 square kilometres. It is the largest remaining ice shelf on the Antarctic Peninsula, despite losing a chunk of ice the size of the English county of Norfolk in 2017.
Ice shelves are critical for holding back glaciers that would otherwise flow into the ocean and add to sea levels. Larsen C restrains glaciers that contain enough ice to raise global sea levels by around 22mm.
In our previous work, we have identified Larsen C as vulnerable to collapse if warming continues unchecked. This is because of an increased amount of meltwater at the surface, which trickles into crevasses in the shelf and re-freezes. This can trigger a process known as “hydrofracturing“, which caused the collapse of the Larsen A ice shelf in 1995 and Larsen B in 2002 on the Antarctic Peninsula.
However, our understanding of what causes ice shelves to melt is limited by the lack of observations in the region. So we instead turn to numerical models, which are an extremely useful tool to explore melt processes in more depth.
Understanding surface melting
In our two-part paper, we used a sophisticated atmospheric model to examine the processes causing surface melting on Larsen C over two decades (1998-2017).
The animation below shows how our model (left image) is generally able to reproduce the patterns of melting that are observed by satellites (right image).
Most notably, an east–west gradient is visible with higher melt in the western inlets above the ice shelf related to mountain winds. This is superimposed on top of a north–south gradient related to temperature and the amount of sunlight that reaches the ice (more on this below). This similarity gives us confidence that the model is representing the real causes of melt on the Larsen C ice shelf.
Causes of melting: sunshine and wind
Two basic conditions must be met for surface melt to occur.
First, there must be enough energy available – radiated from the sun, clouds or atmosphere for example – and second, the surface temperature must be at the melting point of 0C. However, these conditions can be brought about by any number of weather patterns and processes.
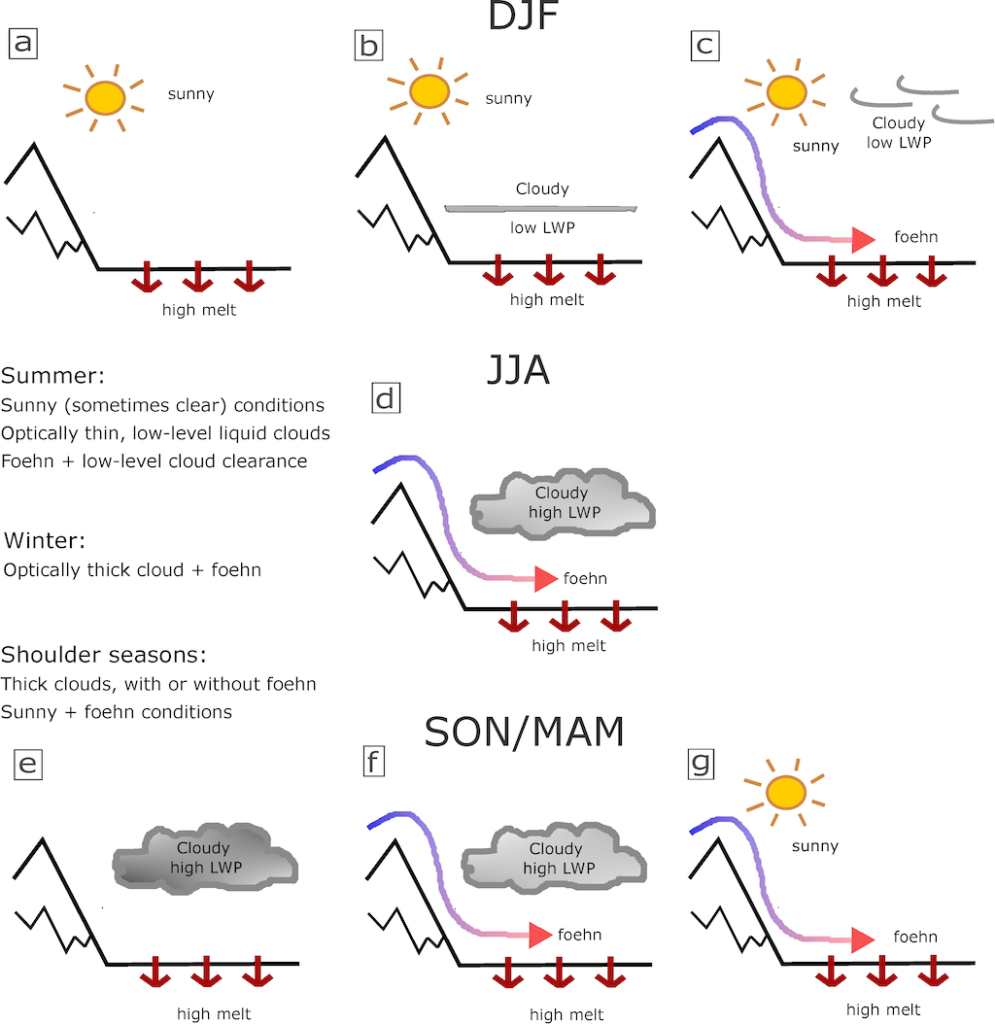
The figure below summarises the most common mechanisms contributing to surface melting on Larsen C in different seasons. The most important factor is the amount of solar energy – or sunshine.
Solar energy drives the majority of melting – especially in summer when the ice shelf receives 24 hours of daylight – because sunny conditions provide lots of energy to melt ice and are often accompanied by warmer temperatures. During sunny conditions (panel a below), the perfect combination to cause melting exists – warmer temperatures plus an abundance of energy.
The second most important factor is winds. “Foehn winds” are warm, dry winds that are formed when air is forced over steep mountains, such as those on the Antarctic Peninsula. When the wind descends on the other side of the mountain it brings in warmer air which can cause melting to occur, even in the cooler seasons of spring and autumn. We have previously shown foehn winds to be very important on Larsen C.
The red shading in the map below shows the percentage of the year when foehn events occur. You will notice that the pattern of foehn occurrence resembles the patterns of surface melting, shown in the first map above. This is because foehn winds often raise temperatures to the melting point and deliver a surplus of energy to drive surface melting.
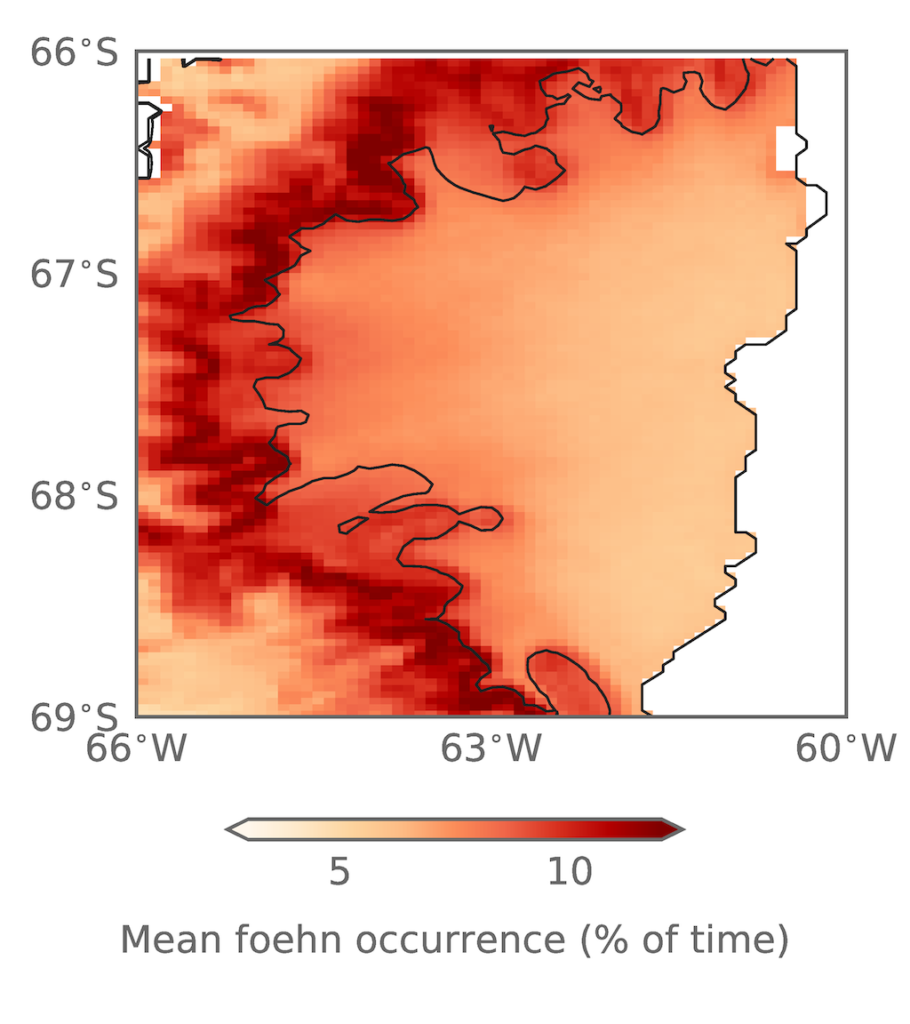
In autumn particularly, foehn winds can account for a large proportion of overall melt.
The autumn of 2016, for example, had an unusually large number of foehn events. Previously, we showed that foehn winds caused melt during the coldest months. In our new paper, we find that they are responsible for over a third of the surface melt that took place in 2016, and nearly 30 times the seasonal average.
Foehn are important elsewhere on the Antarctic Peninsula, too. We show that they were a key component in the collapse of the Larsen B ice shelf – Larsen C’s former neighbour – in 2002, by contributing to the melting that eventually caused the ice shelf to disintegrate.
Another new paper – published today in Communications Earth & Environment – finds that atmospheric rivers (ARs) also played a role in Larsen B’s demise. It finds that these long, narrow bands of intense precipitation are responsible for producing “widespread and intense foehn melt events” on the Antarctic Peninsula, and were a likely trigger of Larsen B’s break up.
For Larsen C, the paper says that calving events – where chunks of ice break off from the edge of the shelf – in early 2005 are “more directly related” to ARs. In fact, Larsen C is “even more sensitive to AR activity than the Larsen A and B”, the paper continues. With further warming, Larsen C “may pass an average temperature threshold and become increasingly vulnerable to AR behaviour like the Larsen A and B ice shelves already have experienced”, the authors warn.
Causes of melting: Clouds and atmospheric circulation
The third factor we consider is clouds. Clouds are crucial in controlling how much energy reaches the surface of Larsen C and, consequently, how much melting occurs.
Over Larsen C, we found that clouds had several important impacts. First, clouds can initiate or sustain melting by trapping outgoing heat, especially in autumn or spring (panel e in the earlier figure). Sometimes this combined with foehn conditions (panel f), even allowing melt in winter (panel d).
Second, clouds can reduce the amount of solar energy reaching the ice, especially in summer.
Crucially, the amount of liquid water contained in the clouds influences how much summertime melting occurs. When clouds extend across most of the sky but contain relatively little liquid water, this usually indicates one of two things.
Either a layer of low-level cloud that is thin enough to permit some solar radiation through but thick and warm enough to trap outgoing energy and reflect it back down towards the surface (panel b above).
Or a thin veil of high-level cirrus cloud, primarily composed of ice, with no cloud at lower levels (panel c). In these cases, most of the sunlight penetrates through the cirrus layer while some outgoing infrared energy is also trapped. This condition can also accompany foehn winds.
In both cases, melting can still occur because there is enough solar and infrared energy reaching the surface, producing an energy surplus that drives melting.
What is interesting about the first case is that this is the same phenomenon that was responsible for the widespread melting observed over the Greenland ice sheet in 2012, 2019 and 2020, when virtually the entire ice cap melted for several days at a time.
As the melting point is reached more frequently and liquid clouds become more prevalent in a warming climate, this suggests that conditions over Larsen C and the Antarctic Peninsula may begin to resemble Greenland more closely.
The final piece in the puzzle is larger-scale atmospheric circulation. While not strictly drivers themselves, broader scale weather patterns frame the big picture of melt conditions. From there, the more localised features outlined above colour in the detail to determine whether we actually see melt or not.
Certain patterns of atmospheric circulation, such as the strength and position of the westerly winds that circle Antarctica – known as the Southern Annular Mode, or SAM – and remote connections to the Pacific (El Niño/La Niña) can either enhance or suppress melting on Larsen C.
For instance, when the SAM is positive and the westerly winds are stronger and closer to the Antarctic Peninsula, that establishes conditions for foehn winds to occur more frequently, driving greater melting. Similarly, melt is enhanced during El Niño conditions and when the low pressure system that usually sits over the Amundsen Sea is deeper and closer to the peninsula.
The future of Larsen C
The causes of melting on Larsen C are complex. Local, regional and large-scale factors such as solar radiation, foehn winds, clouds and large-scale weather patterns all contribute, with different effects in different seasons.
Many of these drivers can happen simultaneously, they can act in the same or opposite directions, and they may have different effects at different times of year.
As the climate warms, the conditions for melting to occur will be met more often on Larsen C. Changing atmospheric circulation patterns will likely produce conditions for foehn winds to occur more frequently and cloud-mediated melting will probably become more commonplace.
We do not know whether Larsen C will follow its former neighbour’s fate, but understanding what is driving the melt in the present will better equip us to predict the future.
Gilbert, E. et al. (2022) A 20-year study of melt processes over Larsen C Ice Shelf using a high–resolution regional atmospheric model: Part 1, Model configuration and validation, Journal of Geophysical Research: Atmospheres, doi:10.1029/2021JD034766
Gilbert, E. et al. (2022) A 20-year study of melt processes over Larsen C Ice Shelf using a high–resolution regional atmospheric model: Part 2, Drivers of surface melting, Journal of Geophysical Research: Atmospheres, doi:10.1029/2021JD036012