
Guest post: Why 2024’s global temperatures were unprecedented, but not surprising
Multiple Authors
06.18.25Multiple Authors
18.06.2025 | 11:01pmHuman-caused greenhouse gas (GHG) emissions in 2024 continued to drive global warming to record levels.
This is the stark picture that emerges in the third edition of the “Indicators of Global Climate Change” (IGCC) report, published in Earth System Science Data.
IGCC tracks changes in the climate system between Intergovernmental Panel on Climate Change (IPCC) science reports.
In doing so, the IGCC fills the gap between the IPCC’s sixth assessment (AR6) in 2021 and the seventh assessment, expected in 2028.
Following IPCC methods, this year’s assessment brings together a team of over 60 international scientists, including former IPCC authors and curators of vital global datasets.
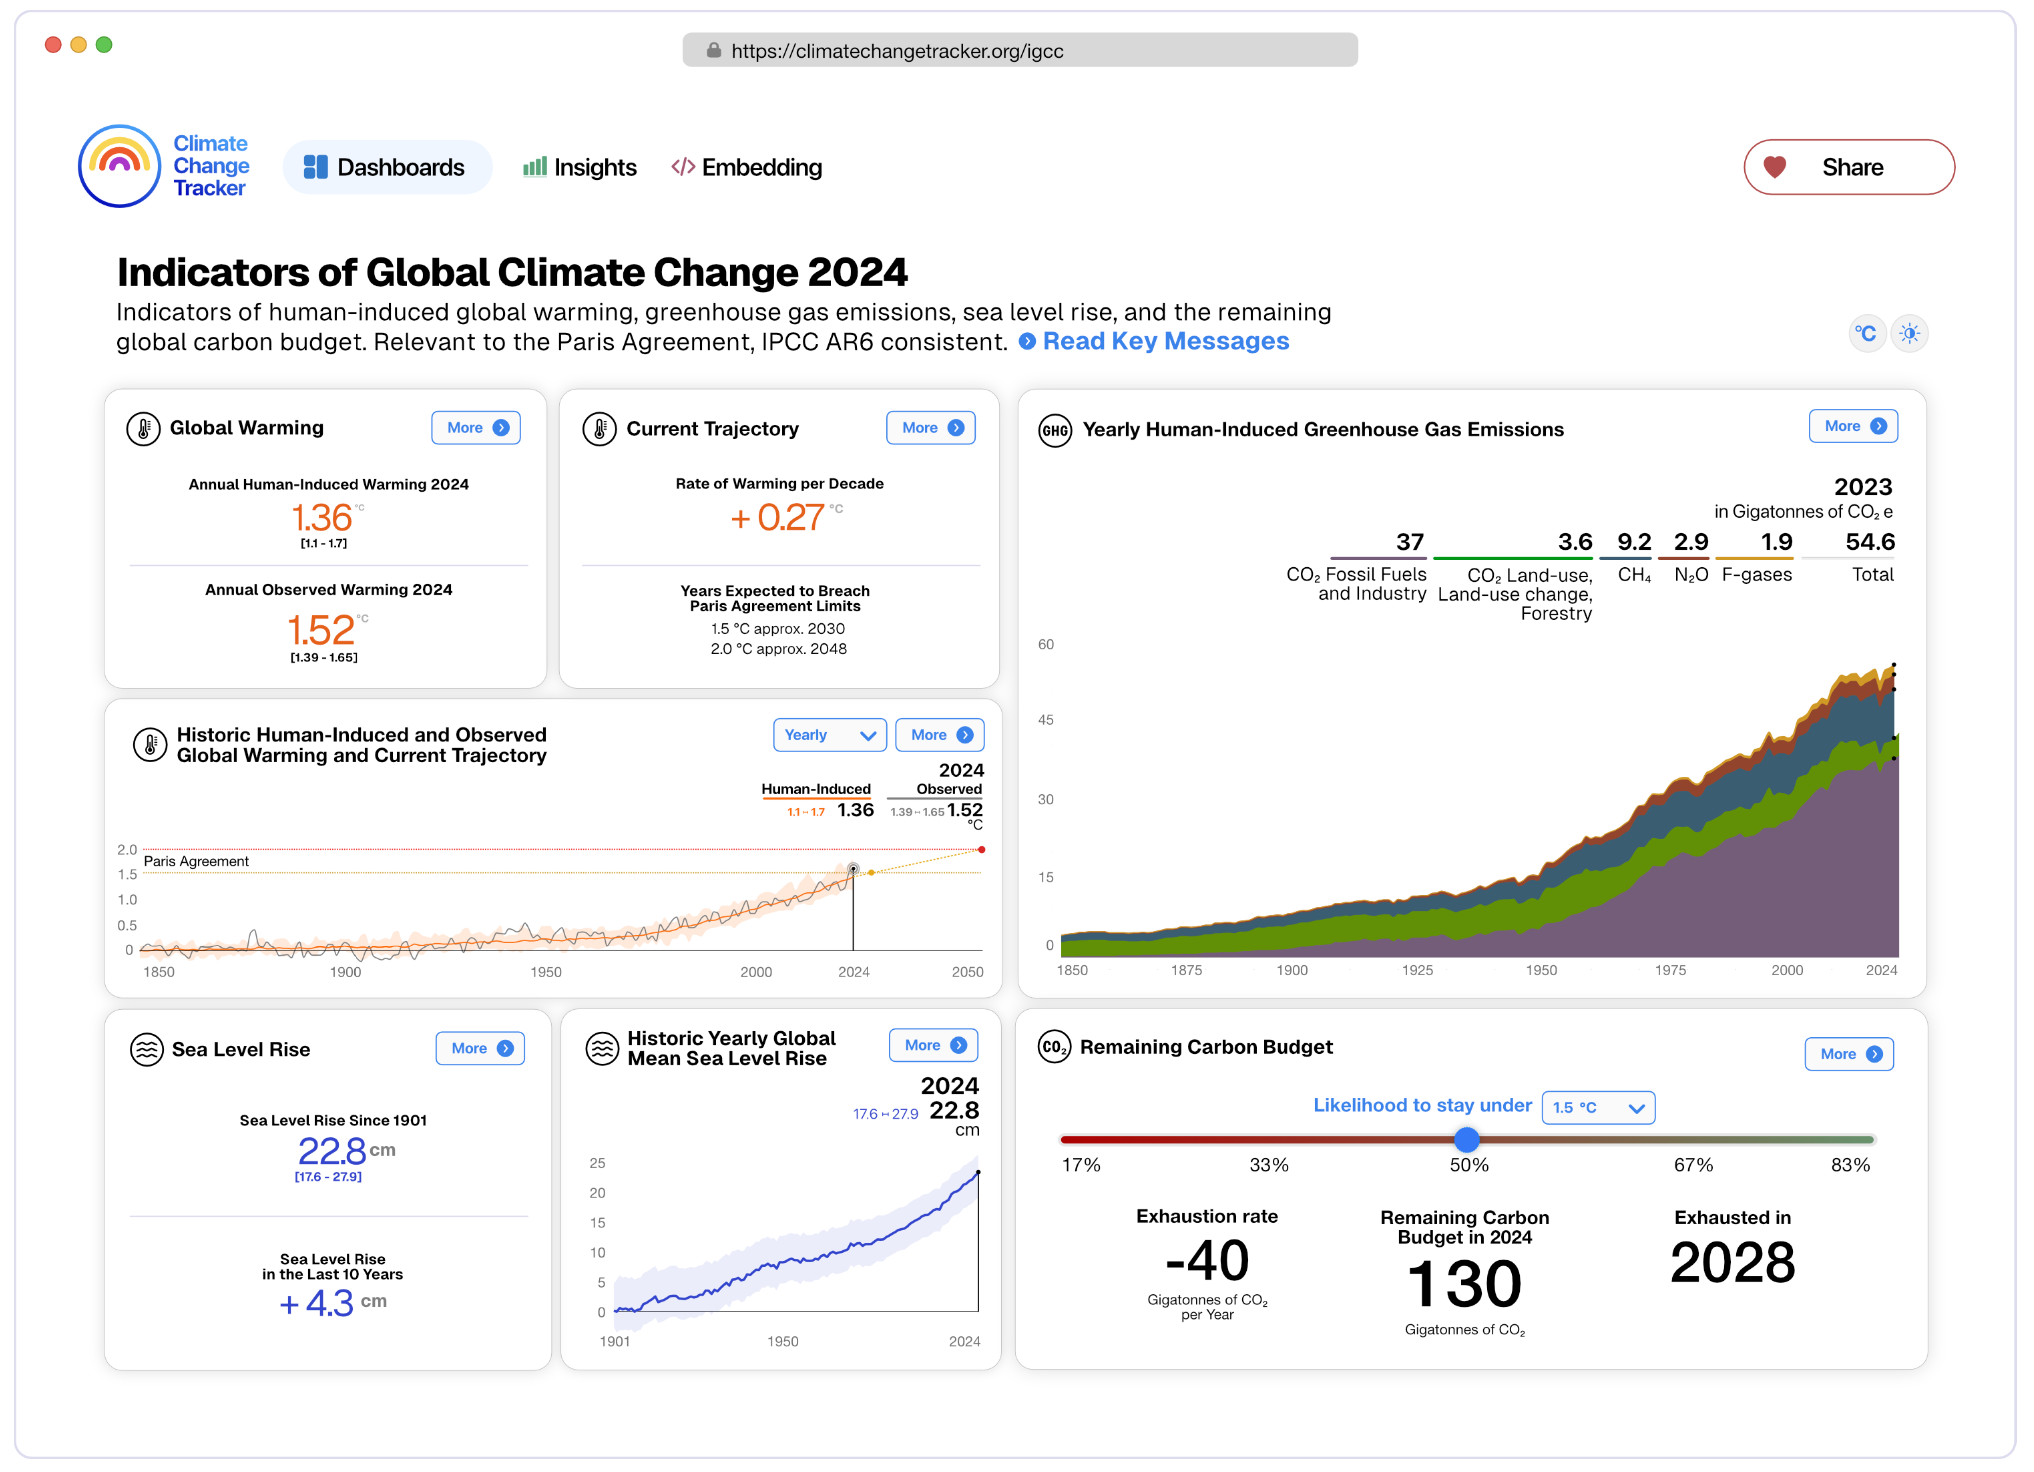
As in previous years, it is accompanied by a user-friendly data dashboard focusing on the main policy-relevant climate indicators, including GHG emissions, human-caused warming, the rate of temperature change and the remaining global carbon budget.
Below, we explain this year’s findings, highlighting the role that humans are playing in some of the fundamental changes the global climate has seen in recent years.
(For previous IGCC reports, see Carbon Brief’s detailed coverage in 2023 and 2024.)
An ‘unexceptional’ record high
Last year likely saw global average surface temperatures hit at least 1.5C above pre-industrial levels. This aligns with other major assessments of the Earth’s climate.
Our best estimate is a rise of 1.52C (with a range of 1.39-1.65C), of which human activity contributed around 1.36C. The rest is the result of natural variability in the climate system, which also plays a role in shaping global temperatures from one year to the next.
Our estimate of 1.52C differs slightly from the 1.55C given by the World Meteorological Organisation (WMO) state of the global climate 2024 report, published earlier this year. This is because they make slightly different selections on which of the available global land and ocean temperature datasets to include. (The warming estimate has varied by similar amounts in past years and future work will aim to harmonise the approaches.)
The height of 2024’s temperatures, while unprecedented in at least the last 2,000 years, is not surprising. Given the high level of human-induced warming, we might currently expect to see annual temperatures above 1.5C on average one year in six.
However, with 2024 following an El Niño year, waters in the North Atlantic were warmer than average. These conditions raise this likelihood to an expectation that 1.5C is surpassed every other year.
From now on, we should regard 2024’s observed temperatures as unexceptional. Temperature records will continue to be broken as human-caused temperature rise also increases.
Longer-term temperature change
Despite observed global temperatures likely rising by more than 1.5C in 2024, this does not equate to a breach of the Paris Agreement’s temperature goal, which refers to long-term temperature change caused by human activity.
IGCC also looks at how temperatures are changing over the most recent decade, in line with IPCC assessments.
Over 2015-24, global average temperatures were 1.24C higher than pre-industrial levels. Of this, 1.22C was caused by human activity. So, essentially, all the global warming seen over the past decade was caused by humans.
Observed global average temperatures over 2015-24 were also 0.31C warmer than the previous decade (2005-14). This is unsurprising given the high rates of human-caused warming over the same period, reaching a best estimate of 0.27C per decade.
This rate of warming is large and unprecedented. Over land, where people live, temperatures are rising even faster than the global average, leading to record extreme temperatures.
But every fraction of a degree matters, increasing climate impacts and loss and damage that is already affecting billions of people.
Driven by emissions
Undoubtedly, these changes are being caused by GHG emissions remaining at an all-time high.
Over the last decade, human activities have released, on average, the equivalent of around 53bn tonnes of CO2 into the atmosphere each year. (The figure of 53bn tonnes expresses the total warming effect of CO2 and other greenhouse gases, such as methane and nitrous oxide, using CO2 as a reference point.)
Emissions have shown no sign of the peak by 2025 and rapid decline to net-zero required to limit global warming to 1.5C with no or limited “overshoot”.
Most of these emissions were from fossil fuels and industry. There are signs that energy use and emissions are rising due to air conditioning use during summer heatwaves. Last year also saw high levels of emissions from tropical deforestation due to forest fires, partly related to dry conditions caused by El Niño.
Notably, emissions from international aviation – the sector with the steepest drop in emissions during the Covid-19 pandemic – returned to pre-pandemic levels.
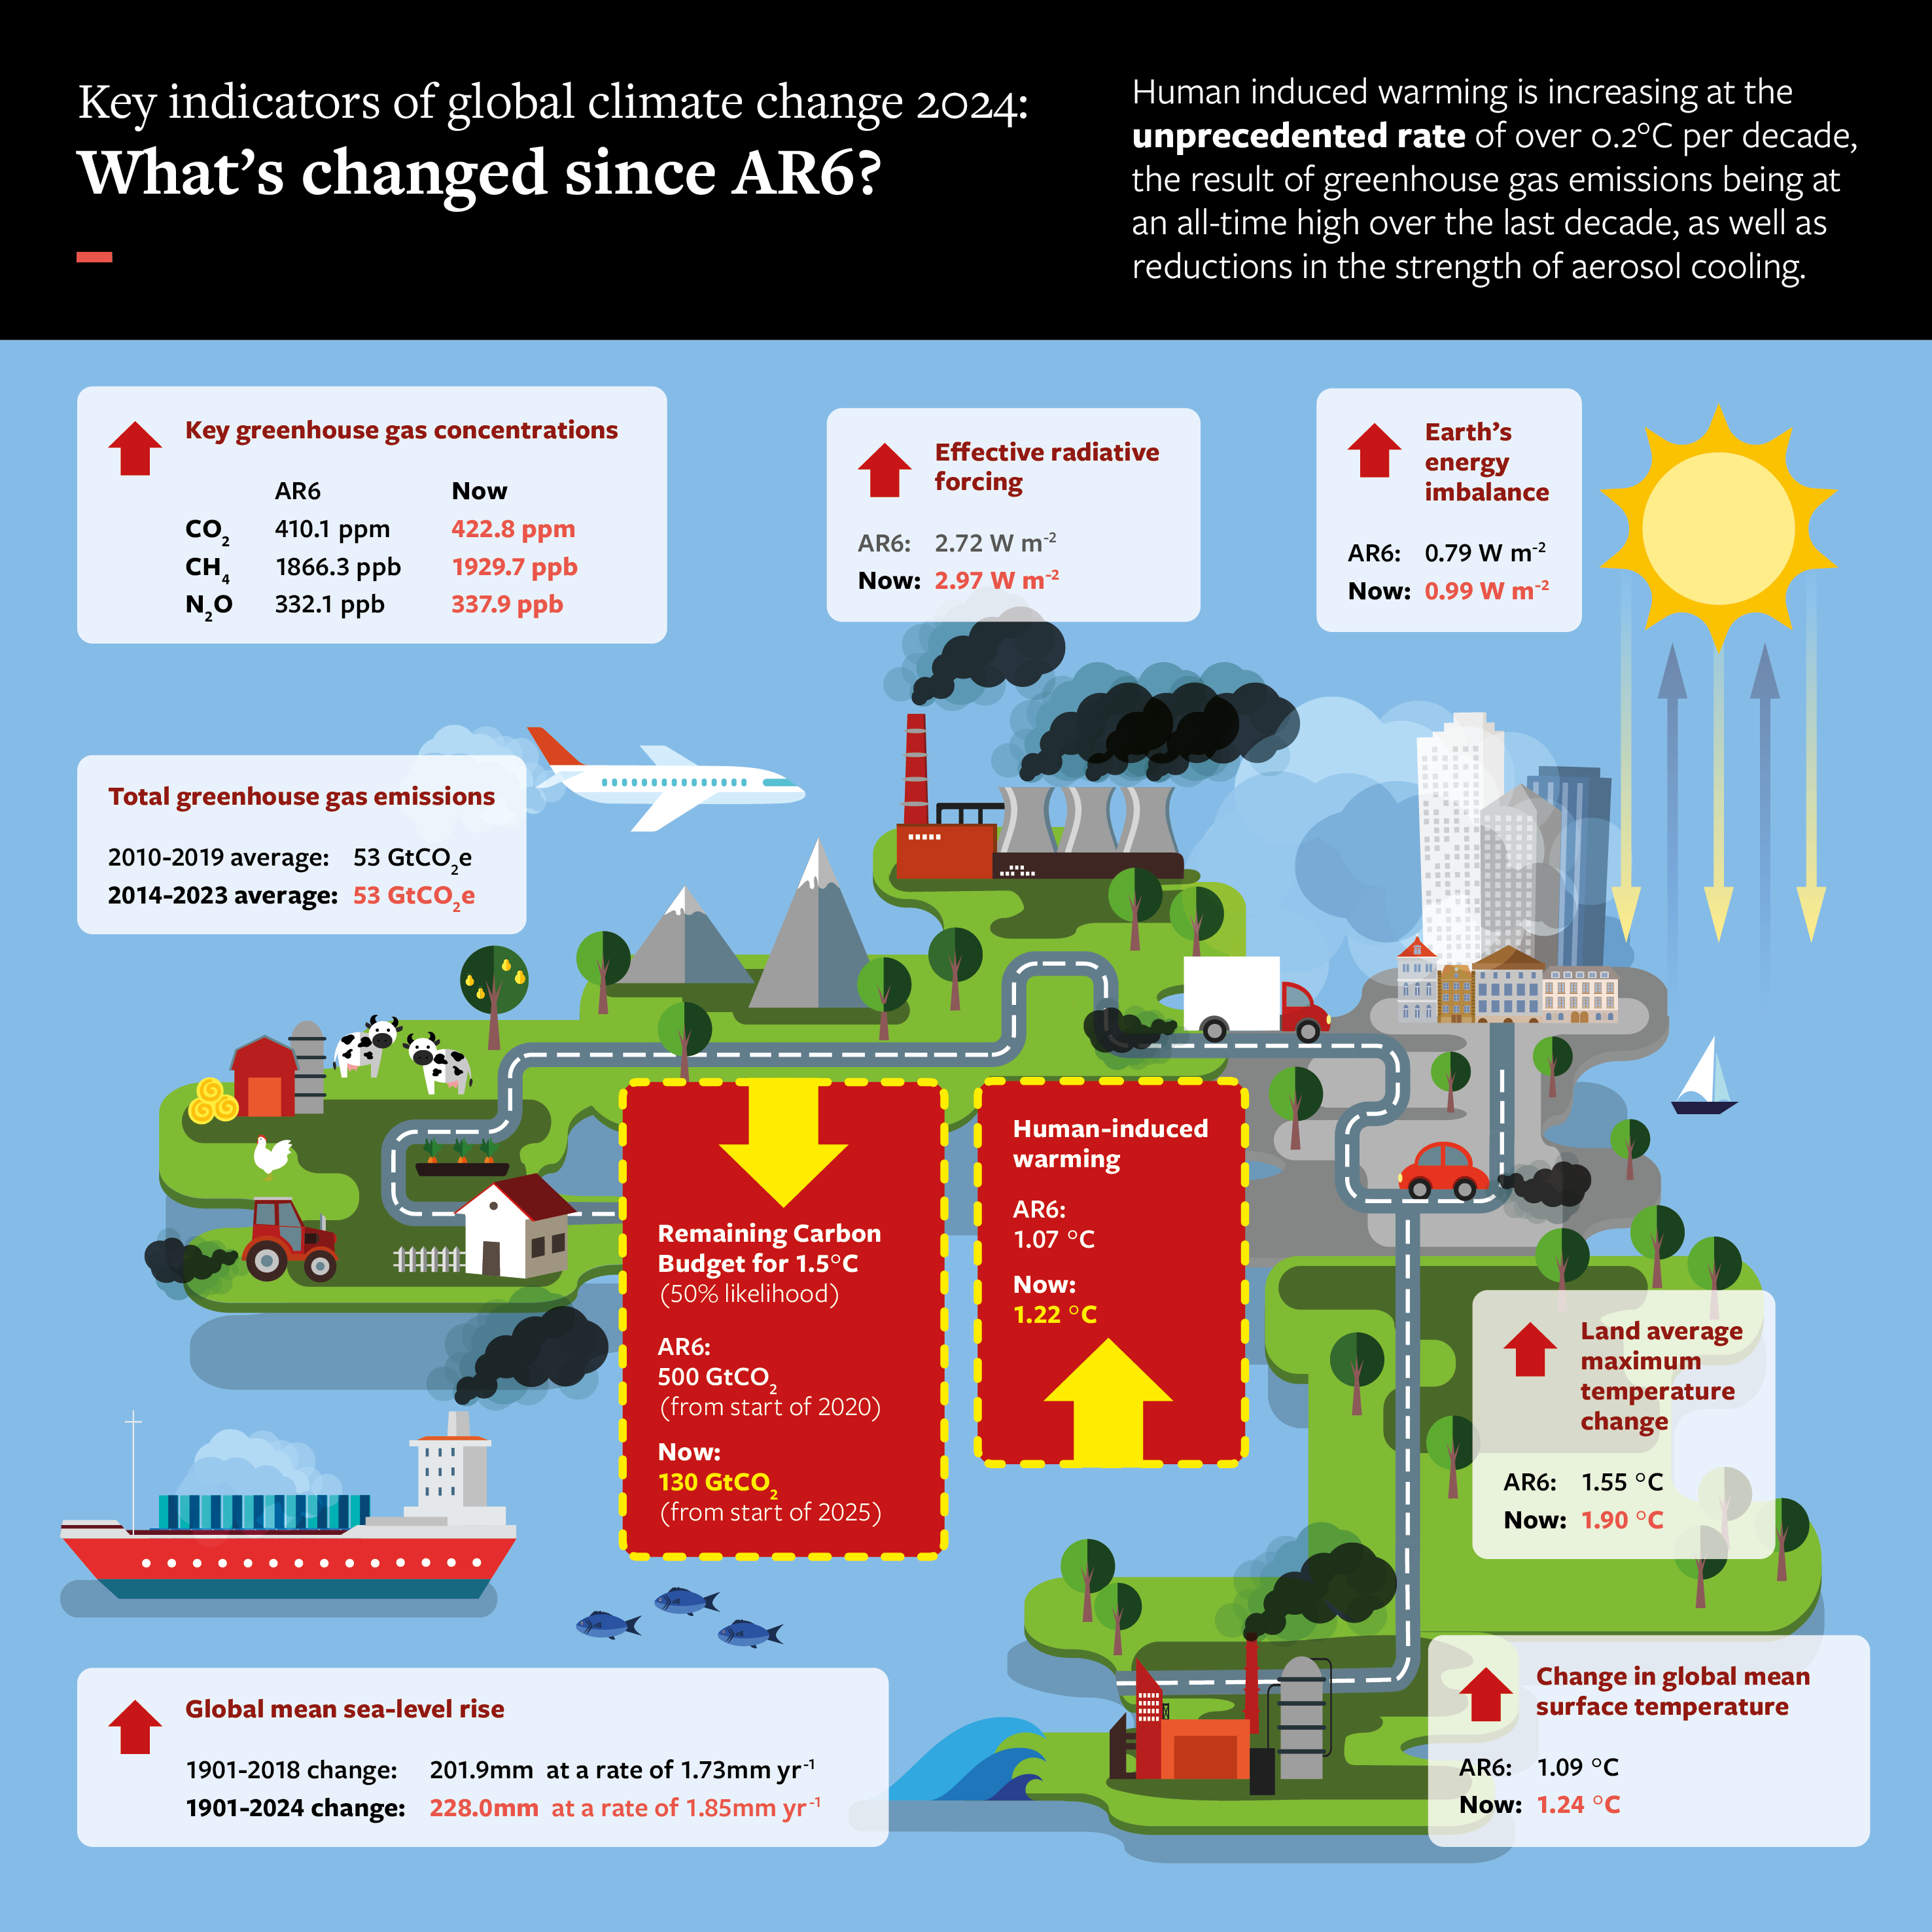
The amount of CO2 in the atmosphere, alongside the other major GHGs of methane (CH4) and nitrous oxide (N2O), is continuing to build up to record levels. Their concentrations have increased by 3.1, 3.4 and 1.7%, respectively, since the 2019 values reported in the last IPCC assessment.
At the same time, aerosol emissions, which have a cooling effect, are continuing to fall as a result of important efforts to tackle air pollution. This is currently adding to the rate of GHG warming.
Notably, cutting CH4 emissions, which are also short-lived in the atmosphere, could offset this rise. But, again, there is no real sign of a fall – despite major initiatives such as the Global Methane Pledge.
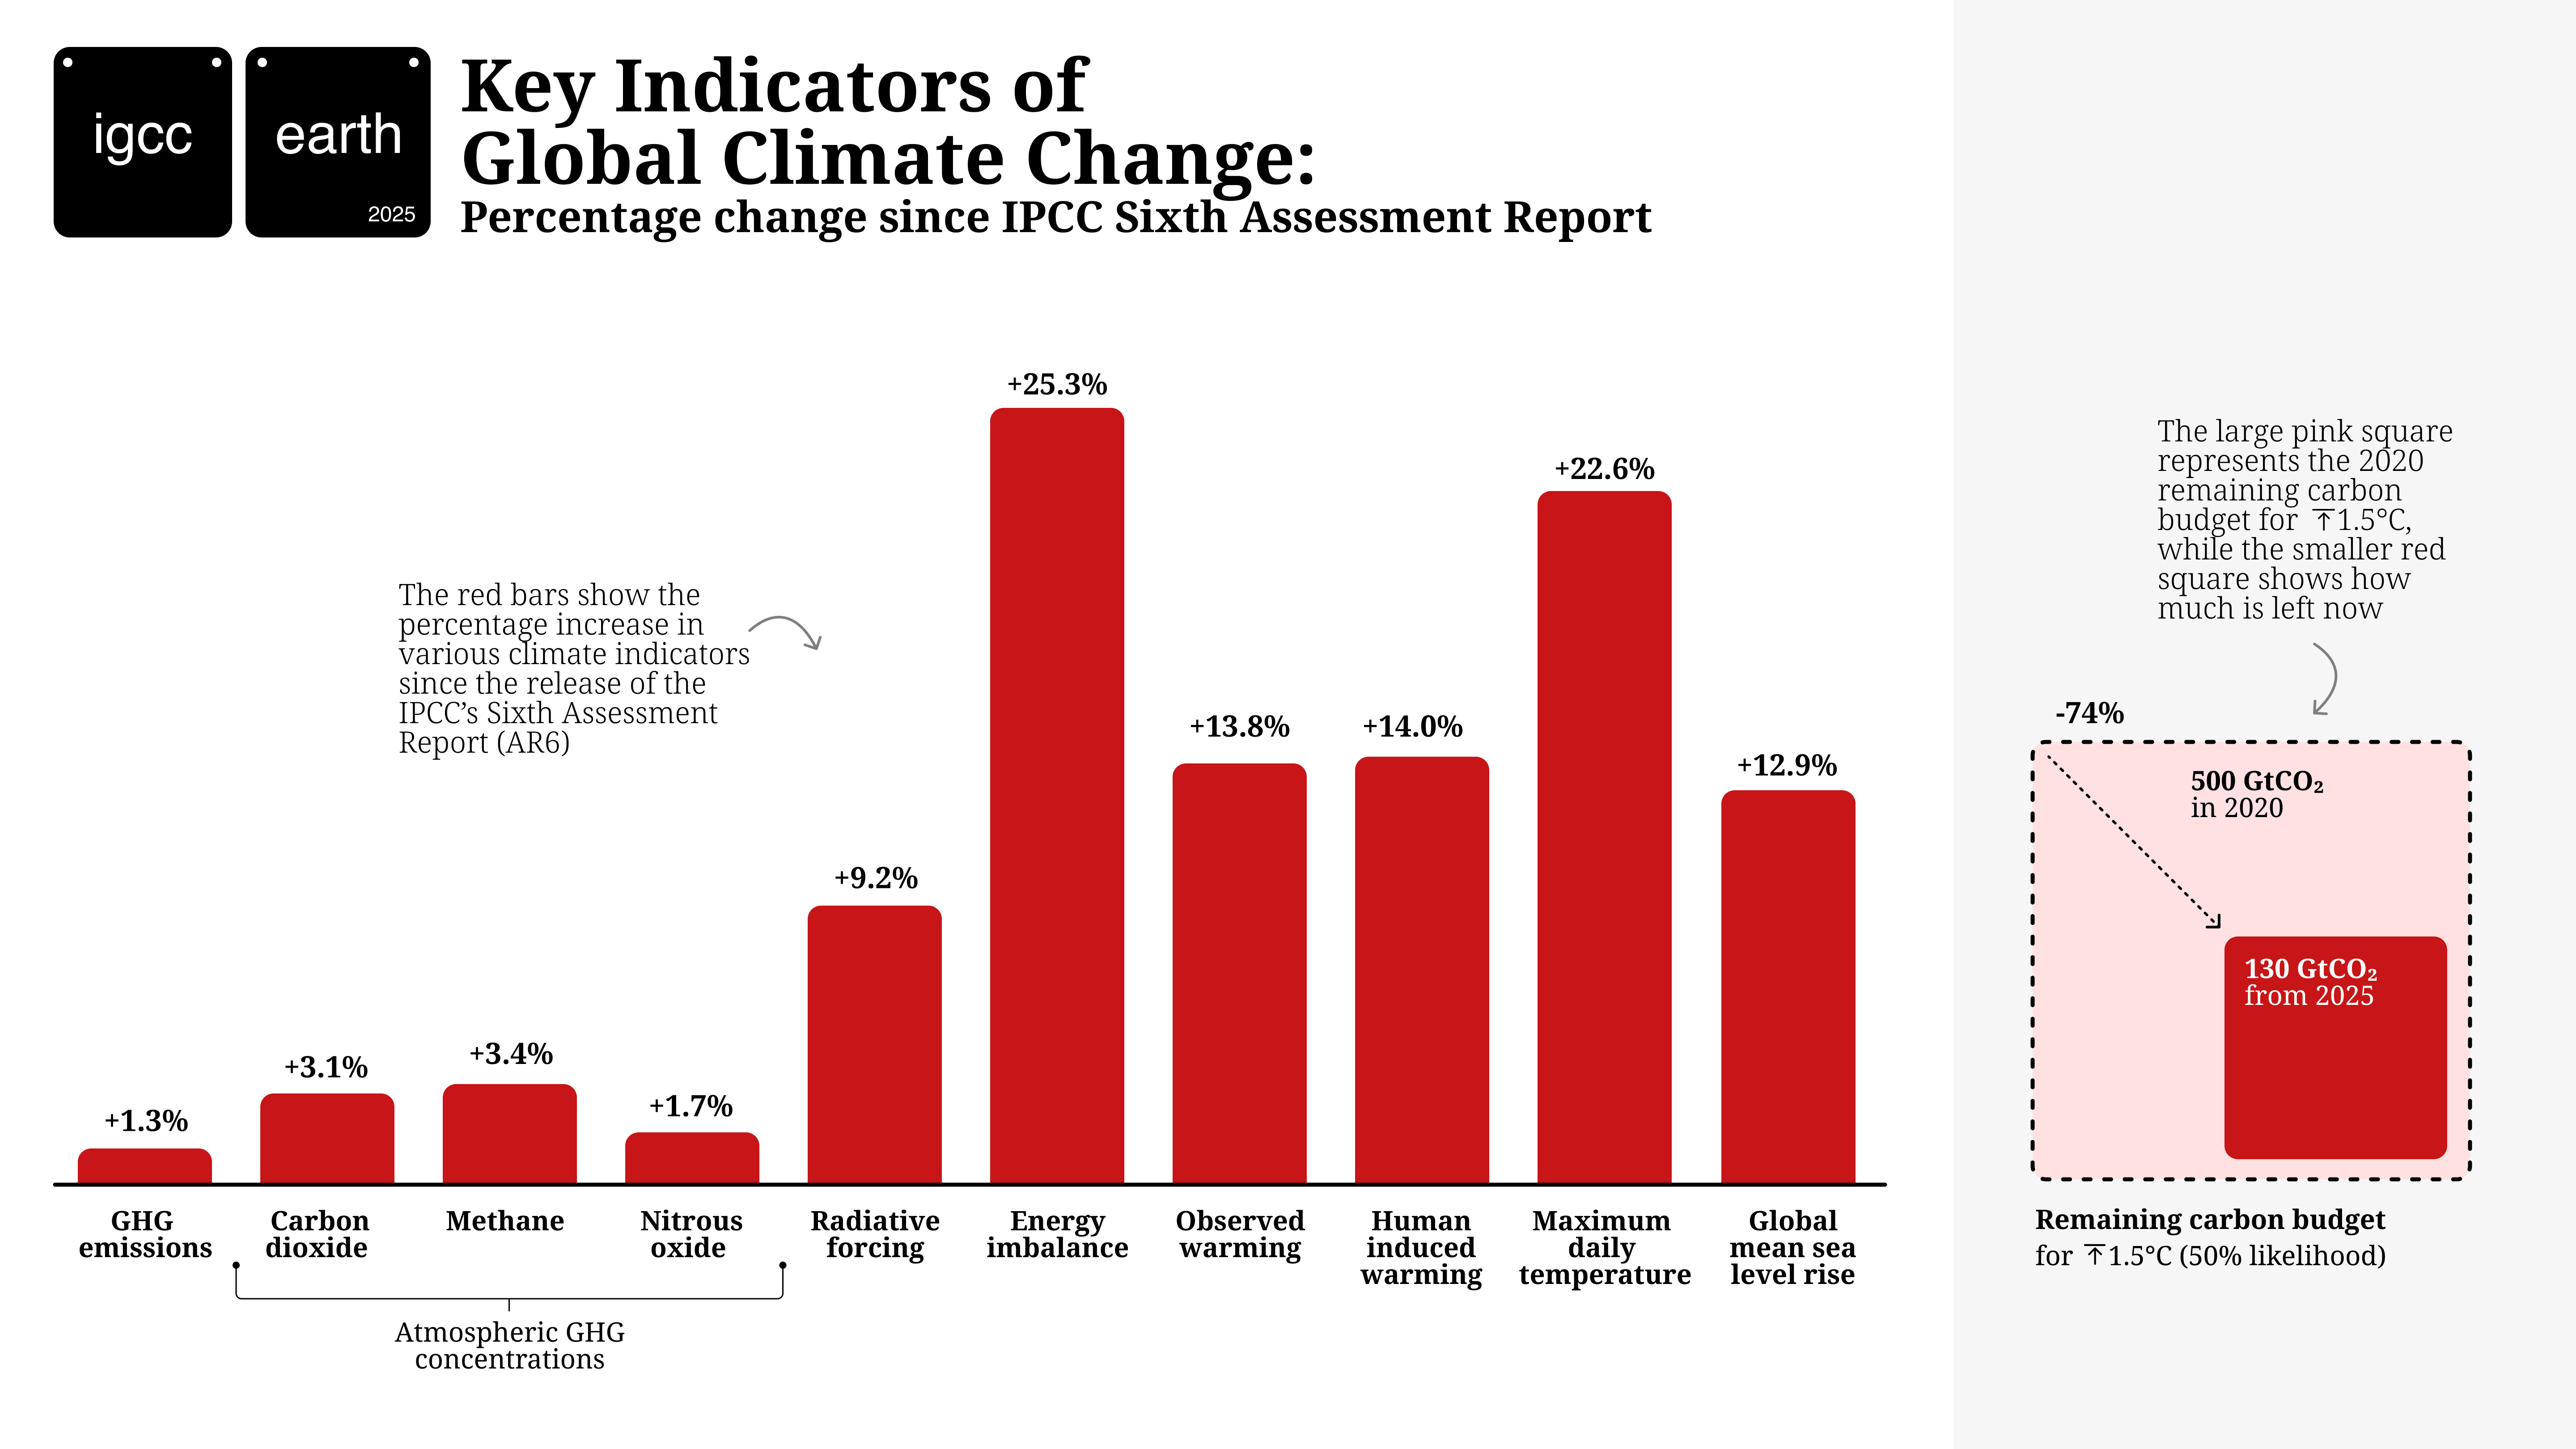
The effect of all human drivers of climate change on the Earth’s energy balance is measured as “radiative forcing”. Our estimate of this radiative forcing in 2024 is 2.97 Watts per square metre (W/m2), 9% above the value recorded in 2019 that was quoted in the last IPCC assessment.
This is shown in the figure below, which illustrates the percentage change in an array of climate indicators since the data update given in the last IPCC climate science report.
Continued emissions and rising temperatures are meanwhile rapidly eating into the remaining carbon budget, the total amount of CO2 that can be emitted if global warming is to be kept below 1.5C.
Our central estimate of the remaining carbon budget from the start of 2025 is 130bn tonnes of CO2.
This has fallen by almost three-quarters since the start of 2020. It would be exhausted in a little more than three years of global emissions, at current levels.
However, given the uncertainties involved in calculating the remaining carbon budget, the actual value could lie between 30 and 320bn tonnes, meaning that it could also be exhausted sooner – or later than expected.
Beyond global temperatures
Our assessment also shows how surplus heat is accumulating in the Earth’s system at an accelerating rate, becoming increasingly out of balance and driving changes around the world.
The data and their changes are displayed on a dedicated Climate Change Tracker platform, shown below.
The radiative forcing of 2.97 W/m2 adds heat to the climate system. As the world warms in response, much of this excess heat radiates to space, until a new balance is restored. The residual level of heating is termed the Earth’s “energy imbalance” and is an indication of how far out of balance the climate system is and the warming still to come.
This residual rate of heat entering the Earth system has now approximately doubled from levels seen in the 1970s and 1980s, to around 1W/m2 on average during the period 2012-24.
Although the ocean is storing an estimated 91% of this excess heat, mitigating some of the warming we would otherwise see at the Earth’s surface, it brings other impacts, including sea level rise and marine heatwaves.
Global average sea level rise, from both the melting of ice sheets and thermal expansion due to deep ocean warming, is included in the IGCC assessment for the first time.
We find that it has increased by around 26mm over the last six years (2019-24), more than double the long-term rate. This is the indicator that shows the clearest evidence of an acceleration.
Sea level rise is making storm surges more damaging and causing more coastal erosion, having the greatest impact on low-lying coastal areas. The 2019 IPCC special report on the oceans and cryosphere estimated that more than one billion people would be living in such low-lying coastal zones by 2050.
Multiple indicators
Overall, our indicators provide multiple lines of evidence all pointing in the same direction to provide a clear and consistent – but unsurprising and worsening – picture of the climate system.
It is also now inevitable that global temperatures will reach 1.5C of long-term warming in the next few years unless society takes drastic, transformative action – both in cutting GHG emissions and stopping deforestation.
Every year of delay brings reaching 1.5C – or even higher temperatures – closer.
This year, countries are unveiling new “nationally determined contributions” (NDCs), the national climate commitments aimed at collectively reducing GHG emissions and tackling climate change in line with the Paris Agreement.
While the plans put forward so far represent a step in the right direction, they still fall far short of what is needed to significantly reduce, let alone stop, the rate of warming.
At the same time, evidence-based decision-making relies on international expertise, collaboration and global datasets.
Our annual update relies on data from NASA and the National Oceanic and Atmospheric Administration (NOAA) and input from many of their highly respected scientists. It is this type of collaboration that allows scientists to generate well-calibrated global datasets that can be used to produce trusted data on changes in the Earth system.
It would not be possible to maintain the consistent long-term datasets employed in our study if their work is interrupted.
At a time when the planet is changing at the fastest rate since records began, we are at risk of failing to track key indicators – such as greenhouse gas concentrations or deep ocean temperatures – and losing core expertise that is vital for understanding the data.


Forster, P. M. et al. (2025) Indicators of Global Climate Change 2024: Annual update of key indicators of the state of the climate system and human influence, Earth System Science Data, doi:10.5194/essd-17-2641-2025