Interactive: How climate finance ‘flows’ around the world
Jocelyn Timperley
12.06.18Jocelyn Timperley
06.12.2018 | 12:31pmClimate finance is one of the bedrocks of negotiations at the United Nations Framework Convention on Climate Change (UNFCCC), including the “COP24” talks taking place this month in Katowice, Poland.
“Climate finance” refers to money – both from public and private sources – which is used to help reduce emissions and increase resilience against the negative impacts of climate change.
Rich countries have promised they will provide $100bn a year in climate finance to poorer nations by 2020. The UNFCCC’s recent biennial assessment found this sum had reached $75bn in 2016, a step forward compared to the $65bn given in 2015.
But what does this climate finance actually look like? How does it “flow” from country to country? Here, Carbon Brief takes a deep dive into a climate finance database collated by the Organisation for Economic Co-operation and Development (OECD).
The project-level data gives key insights not only into country-to-country flows of finance, but also the type of finance different donor countries tend to offer. For example, it shows which countries offer the biggest proportion to adaptation rather than mitigation projects, and whether grants or loans tend to dominate the money given.
Carbon Brief has produced a series of interactive flow diagrams using the data, available together here as a graphical “story” and further explained below.
Key takeaways
- Donor governments gave climate finance totalling $34bn in 2015 and $37bn in 2016, according to OECD estimates (note that this is not a full estimate of money counting towards the $100bn pledge – see below for more).
- Japan was the largest donor, giving $10.3bn per year (bn/yr) on average over the two years. It was followed, in order, by Germany, France, the UK and the US.
- India was the largest recipient on average, receiving $2.6bn/yr. It was followed, in order, by Bangladesh, Vietnam, the Philippines and Thailand
- The single largest “country-to-country” flow was an average yearly $1.6bn from Japan to India.
- The US was the top contributor to the multilateral Green Climate Fund (GCF) in 2016. (However, the US has now ended its support for the GCF).
- Around $16bn/yr went to mitigation-only projects, compared to $9bn for adaptation-only projects.
- Around 42% of the finance consisted of “debt instruments”, such as loans.
Climate finance database
Countries have already agreed that developed countries should be jointly “mobilising” $100bn a year by 2020 to help poorer nations tackle climate change.
However, discussions continue on some of the finer details. For example, how the provision of climate finance should be divided between rich nations, what should be counted as climate finance and how flows of finance should be reported.
Several organisations report on the progress towards this climate finance goal, including the UNFCCC’s recent biennial assessment. This major report found that climate finance either directly given by governments to poorer countries, or raised by them from the private sector, stood at $75bn in 2016, which some analysts said put the world on track to achieving the $100bn goal in 2020. Of this, $57bn was public finance (directly from governments) and the rest private finance.
Others, such as Oxfam, argue that, in reality, far less progress has been made towards the $100bn goal. Its recent report estimates that “climate-specific assistance” was as low as $16-21bn per year in 2015 and 2016.
Here, Carbon Brief presents a comprehensive, project-level view on how countries are giving and receiving climate finance – rather than focusing on the headline total
The OECD, a Paris-based intergovernmental economic organisation, asks its 36 member countries to report on their foreign aid, including climate finance. The data captures climate finance that is both bilateral (country to country) and multilateral (via international institutions) It also gives detailed information about funded projects. (The OECD calls this database “climate-related development finance” rather than strictly climate finance).
The table below allows browsing of the data to select donor and recipient countries. It also allows other filtering, such as whether the money was for adaptation, mitigation or both, and whether it was delivered as a grant or a loan. See below for more details on these different aspects of the finance.
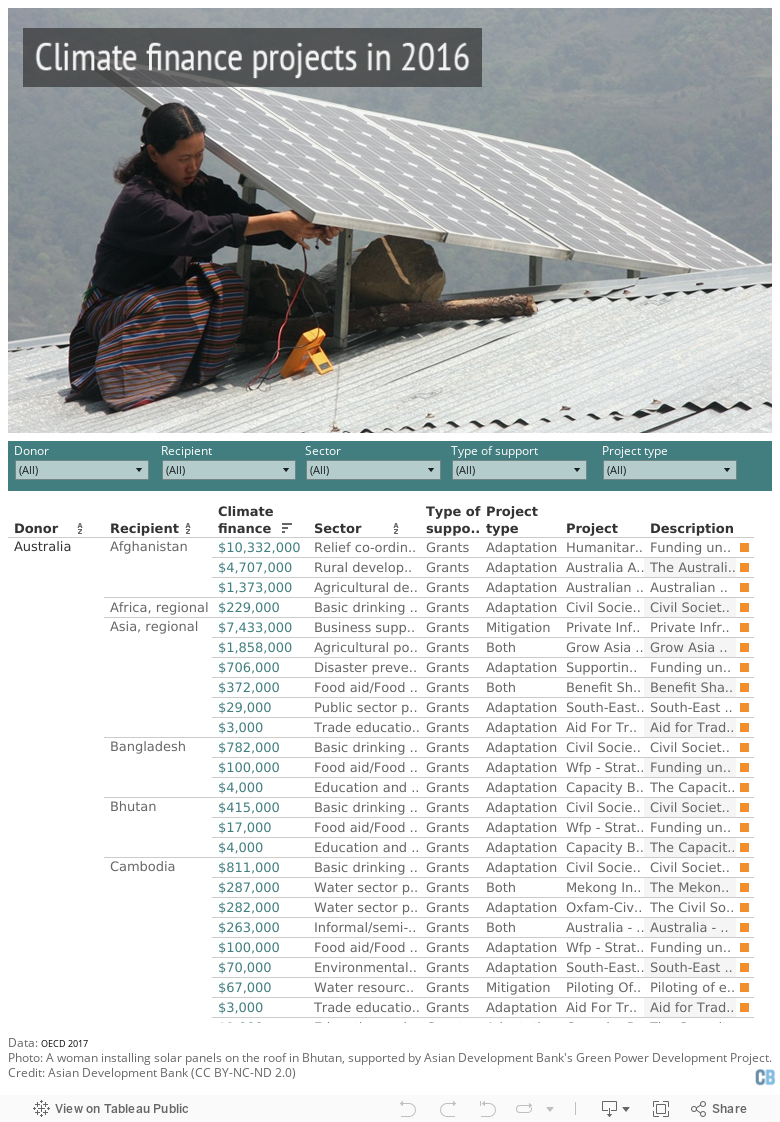
The values represent money committed by governments or agencies on the basis of a firm written obligation and backed by available funds. Therefore, it does not represent pledges.
Browsing the database gives detailed information about many of the projects funded. For example, the “Sector” filter shows that six projects in 2016 labelled by countries as climate finance dealt with coal-fired power plants.
It is important to note that the OECD database does not claim to capture all climate finance counting towards the $100bn. The totals of the data given here add up to $37bn, well below the $47bn the OECD recently estimated in a separate, top-down overview of public climate finance from developed to developing countries in 2016. The OECD also put public climate finance at $55bn in 2017. However, no project-level database for 2017 has been released yet.
The advantage of the bottom-up data is the ability to break it down, in some cases to detailed project level, according to Joe Thwaites, associate in the Sustainable Finance Center at the World Resources Institute (WRI).
This project-level data helps international actors to be transparent about the climate finance they provide, he adds. For example, it can help to ensure there is no “double counting” of climate finance as countries scale it up, he says.
Flow diagrams
Carbon Brief has also created several interactive flow charts – known as Sankeys – which give key insights into how climate finance is being transferred from developing countries to poorer nations. The numbers shown in these charts are an average for 2015 and 2016.
1: Country-country finance

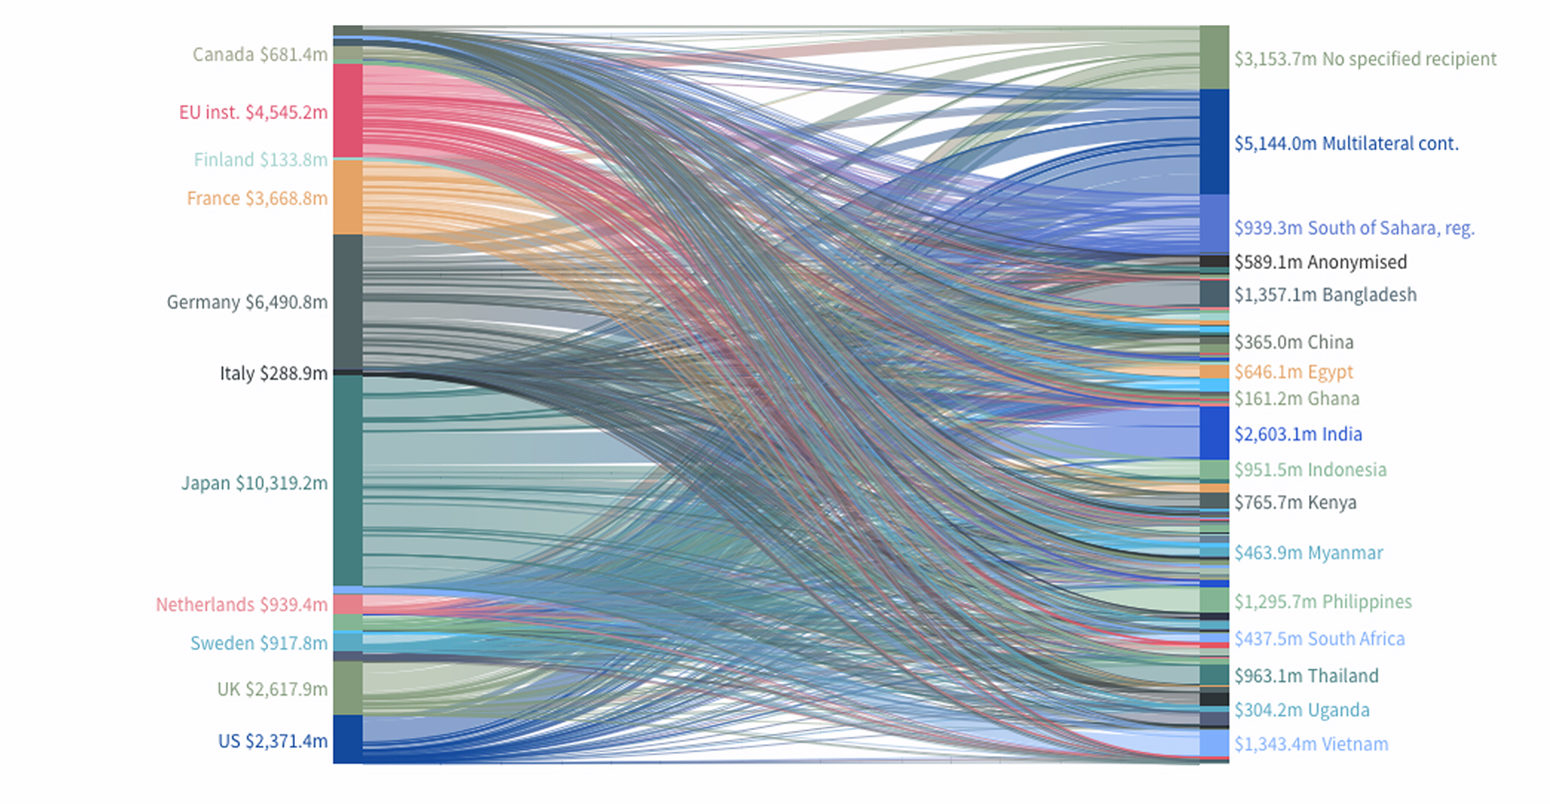
This diagram shows the average yearly amount of climate finance given by each OECD country on average in 2015 and 2016, and where that money went.
Donor countries are listed down the left-hand side of the diagram. The right-hand side shows the amounts which flowed to recipient countries or regions.
It also shows how much went to international bodies, such as multilateral climate funds (“multilateral climate contributions”, see second diagram and below for more), and transfers where the recipient was not specified, often due to projects being split across several countries.
Where the recipient is “anonymised”, the flows represent transactions that do not meet official development assistance criteria or private flows, Guillaume Simon, a climate-related development finance expert at the OECD, tells Carbon Brief. These are considered confidential at the level of individual activities, he says.
The table below shows the top ten donors and recipients, averaged over 2015 and 2016.
| Largest climate finance donors | Largest climate finance recipients | ||
| Country | $m/yr | Country | $m/yr |
| Japan | $10,322 | India | $2,603 |
| Germany | $6,493 | Bangladesh | $1,357 |
| France | $3,671 | Vietnam | $1,344 |
| United Kingdom | $2,618 | Philippines | $1,296 |
| United States | $2,370 | Thailand | $963 |
| Netherlands | $940 | Indonesia | $952 |
| Sweden | $918 | Kenya | $766 |
| Norway | $755 | Turkey | $665 |
| Canada | $682 | Ethiopia | $647 |
| Australia | $480 | Myanmar | $646 |
As the table shows, Japan was by far the largest provider of climate finance, according to this data, followed by Germany, France the UK and the US. Together these five countries provided 70% of all donor finance recorded in the OECD’s detailed figures.
India, meanwhile, was the largest recipient, followed by Bangladesh, Vietnam, the Philippines and Thailand. Together they received for 21% of finance given by donor countries.
The amounts above are reported by countries themselves. However, Simon says that the OECD secretariat conducts regular quality reviews. He adds:
“It has been highlighted in past reviews that marking practices can vary among donors. A Rio markers handbook has been developed to guide…marking and to increase convergence.”
2: Multilateral contributions
As the first chart above shows, not all climate finance goes straight from one country to another. Instead, a sizeable wedge goes via international institutions, such as multilateral climate funds and multilateral development banks (MDBs). The breakdown of the $5.1bn climate share of contributions to these bodies is shown in the second diagram above.
It shows, for example, that the Green Climate Fund (GCF), which was established with a mandate specifically to leverage climate finance towards the $100bn pledge, received an average $1.7bn per year in 2015 and 2016. Japan, the UK and the US contributed the most.
A second set of OECD data, not analysed here, shows climate finance flows from a “recipient” perspective. This focuses on where flows are going rather than where they are coming from. It shows $53bn per year on average being transferred in 2015 and 2016, well above the $36bn average for the “donor” perspective shown here.
The reasons for this difference are complex, Simon tells Carbon Brief. However, it is in part due to the inclusion of extra money leveraged by multilateral development banks (MDBs) from initial donor sums, he says. In addition, inflows and outflows vary for any given year, since funding is not necessarily handed out the same year it is provided.
3: Adaptation vs mitigation
Climate finance reported to the OECD can be tagged as being for mitigation or adaptation purposes, as shown in the third diagram. In cases where it is tagged as both, the OECD does not give details of a split between the two.
Mitigation-only projects received an average 44% of funding in 2015 and 2016, while adaptation-only projects received 24%. Projects with both mitigation and adaptation components sat at 17%, while no information was given for the remaining 14% of projects.
The Paris Agreement says that scaled-up financial resources “should aim to achieve a balance between adaptation and mitigation”. As is shown in the OECD data (and elsewhere) this is not close to being the case, with almost double the amount going to mitigation-only projects compared to adaptation-only ones.
According to Thwaites, however, there are inherently a lot of judgement calls involved in how projects are coded as mitigation or adaptation. He tells Carbon Brief:
“A lot of the time it is judgement based, and especially one of the challenges is that it depends where the coding happens.
“If it happens in a [contributor] country office [in a recipient country], they know the projects better. But they may not be as well aware of what the guidelines are in the Paris Agreement and UNFCCC, and all the rules around that. Whereas, if it happens in the capital [of a contributor country], you’d hope that they will be a bit more aware of the international context and the commitments and the negotiations, but they might not have any clue about the project.”
4: Grants vs loans
This fourth diagram shows the type of climate finance flows, separated into categories (pdf) defined by the OECD: grants, debt instruments (such as loans and reimbursable grants), equity (such as buying of shares) and debt relief.
The total amount given as grants – $19.4bn – is only slightly higher than for projects financed by debt instruments, at $15.5bn. This is despite grants making up the vast majority (98%) of the projects detailed in the database, because debt-funded schemes tend to be much larger.
As the chart shows, some countries, such as Japan and France, deliver the vast majority of their finance as debt instruments. The UK, in contrast, delivered 98% of its finance as grants on average over the two years, while grants also made up 93% of US contributions.
Thwaites tells Carbon Brief:
“One of the things that is interesting is when a country makes an announcement of a number that sounds really big and exciting, then you always have to look below the surface.
“So the effort involved for the UK, which does mostly grant finance, to do every incremental amount of climate finance is more effort politically, for sure, than to be able to approve more loans. So there is a question of how do you credit that.”
One reason the grants-versus-loans balance is important is because accessing private funding for adapting to climate change is expected to be far more difficult than for mitigation projects, Bertram Zagema, policy advisor on food and climate change at Oxfam, tells Carbon Brief. He adds:
“Grant money can go to basic things that communities need to adapt to climate change, for example, and private money will only be invested if there’s a business model.”
The UNFCCC biennial report also notes that grants continue to provide most of the money for adaptation finance.
5: Principal vs significant climate component
This final diagram shows the breakdown of projects labelled in the data as having either a “principal” or “significant” climate component.
This climate element of aid spending is collected using “Rio markers”: tags which donor countries add to reported development finance to give more information about what it will be used for.
The project is scored as having a “principal” objective if it is directly targeting climate mitigation or adaptation, and a “significant” objective where climate change is not the fundamental driver for the project. As the diagram shows, projects with only a “significant” climate-related objective dominate.
While it is justifiable that climate finance is spent on projects where climate is one of many priorities in a broader development project, the way this is accounted for depends exclusively on developed countries’ self-reporting, says Oxfam’s climate finance report. This has “led to the use of disparate and in many instances questionable methods”, Oxfam adds.
In this OECD data, no downwards adjustment is made to “significant” marked activities, Simon tell Carbon Brief. But in some cases, countries themselves adjust down the amount they report to the UNFCCC when a project has only a significant climate component, Thwaites explains:
“Basically, when it’s principal, the idea is that you could probably reasonably count 100% of the value. When it’s significant, it’s only a component of a project. And the OECD members take different approaches to that.
“The UK, literally for every project, they go in and make a judgement on a project-by-project basis, which is a huge amount of effort. I think they deserve quite a lot of credit for doing that.”
In its assessment of climate finance, Oxfam at minimum halved the amount it considered as counting as climate finance for projects where climate was not the primary objective. This is one of the main reasons its climate finance total is lower than other estimates.
Adding up estimates
As noted above, the OECD data is one of several assessments of climate finance, which can vary substantially due to different methods and assumptions. Helena Wright, senior policy advisor at E3G, tells Carbon Brief:
“The OECD data is bottom-up project data, but doesn’t include private finance mobilised by projects, and also may not include all types of projects depending on how these are reported.
“It is important for international actors to be transparent about the climate finance they provide, which is why the project-level data collected by the OECD is useful. More transparent data can help build trust that the $100bn goal is met and that climate finance is being provided and received.”
As noted above, the UNFCCC’s biennial assessment of climate finance flows gives a more comprehensive overview. The latest iteration, which covers 2015 and 2016, was released earlier this month and showed public climate finance from developed to developing countries averaged $58bn in 2015 and 2016.
It draws on several different data sources, including the OECD data, and its topline numbers are signed off by a committee with equal number of developed and developing countries, Thwaites tells Carbon Brief:
“It’s kind of like the IPCC [Intergovernmental Panel on Climate Change] for climate finance. It’s obviously not as high stakes as the IPCC, but everything in the summary and recommendations has been debated very thoroughly by governments, and they’ve gone through every sentence and reviewed it.”
Oxfam’s recent “shadow finance” report, meanwhile, offers a more stringent assessment of progress towards the $100bn climate finance goal, based on both country submissions to the UNFCCC and the OECD data.
It does not include private finance and tries to account for what it regards as an “overstatement” of public support by developed countries.
For example, its assessment includes only the grant element of loans, not their full face value. It also assumes that at most 50% of funds are for climate in projects where climate is only a significant, not principal, objective. It sums up the resulting value as “climate-specific assistance” – which includes only finance which it says makes a “net financial transfer to developing countries in support of climate action”.
Oxfam estimates this “climate-specific assistance” was as low as $16-21bn per year in 2015 and 2016, with just $5-7bn of this going to adaptation. It adds:
“Even if one assumes a large margin of error, [these figures] point to a significant difference between what donors report and net climate-specific assistance.
“A closer look reveals that overall increases in climate finance appear to be largely the result of an upsurge in loans, in particular to middle-income countries. Whilst loans have an important role to play in the right circumstances, it is concerning that loans constitute an estimated two-thirds of public climate finance in 2015-16. Public grant-based support is too low to meet needs, and is rising too slowly.”
Thwaites agrees that there are many questions to ask, but argues there is no one right climate finance solution for everyone. He tells Carbon Brief:
“This all sort of comes back to this philosophical question of whether climate finance is purely a wealth transfer and compensation – and, for sure, some people think it is – or is it a means to enhance the capital stock of developing countries in a way that will help them fight climate change and also improve their economies. And, if it’s in that sense, a grant for certain activities may not be the most economically productive form of transfer.”
Discussions on climate finance are currently ongoing at this year’s climate conference in Katowice, Poland, as part of the Paris “rulebook”. Sticking points include accounting rules and the extent to which developed countries should promise concrete sums of climate finance years ahead of time. Some countries are also pushing for talks to start on a new climate finance goal, due to begin in 2025.
Speaking at the COP24 talks, Zagema tells Carbon Brief that the climate finance debates are “vital outcomes” of this year’s COP:
“Whether the $100bn per year promised to developing countries will be any good for the world’s poor, particularly those living in climate vulnerable situations, depends largely on the accounting rules due to be agreed here in Katowice…
“Robust accounting rules are necessary to show the true net value of developed countries’ contributions to helping vulnerable communities respond to the perils of climate change. They will be essential to ensure that this money actually reaches the people hardest hit by climate change.”
Global climate flows
One further complication is that all of the above numbers assess only public finance from developed to developing countries. This does not account for all of the money going towards tackling climate change, such as private finance, in-country spending or flows from one developing nation to another, such as support being offered by China. This is often referred to as “South-South” finance.
The UNFCCC biennial report gives an estimate that includes all of these flows and puts overall global climate finance at $680bn in 2015 and $681bn in 2016, a 17% increase on 2013-2014 levels. The growth was largely driven by high levels of new private investment in renewable energy, the report says.
A report released in late November by the Climate Policy Initiative (CPI) found global public and private climate finance flows reached a lower level of $472bn in 2015 and and $455bn in 2016. It also estimates that flows reached $510bn-530bn in 2017, based on preliminary data.
For comparison, the World Bank recently said a total of $25-30tn alone is needed to help cities shift towards a low-carbon economy.
Charts produced by Tom Prater using Flourish and Tableau with OECD data.
-
Interactive: How climate finance ‘flows’ around the world
-
Interactive: Where the world’s climate finance comes from