Land-use change has affected ‘almost a third’ of world’s terrain since 1960
Giuliana Viglione
05.11.21Giuliana Viglione
11.05.2021 | 4:00pmCurrent estimates of land-use change may be capturing only one-quarter of its true extent across the world, new research shows.
The paper, published in Nature Communications, revises previous estimates of how much humans change the Earth’s land surface – such as via the destruction of tropical rainforests. It finds that, when accounting for multiple instances of change in the same place, 720,000 square kilometres of land surface has changed annually since 1960 – an area, the authors note, “about twice the size of Germany”.
These new estimates are a synthesis of high-resolution satellite imagery and long-term inventories of land use. Combining these two types of data sources, the authors write, allows them to examine land-use change in “unprecedented” detail.
Despite steadily increasing rates of land-use change over the latter half of the 20th century, the global rate has been decelerating since 2005. The authors attribute this slowdown to the 2007-08 financial crisis, which they hypothesise caused economic shifts in the global north that reverberated around the world.
A ‘careful reconstruction’
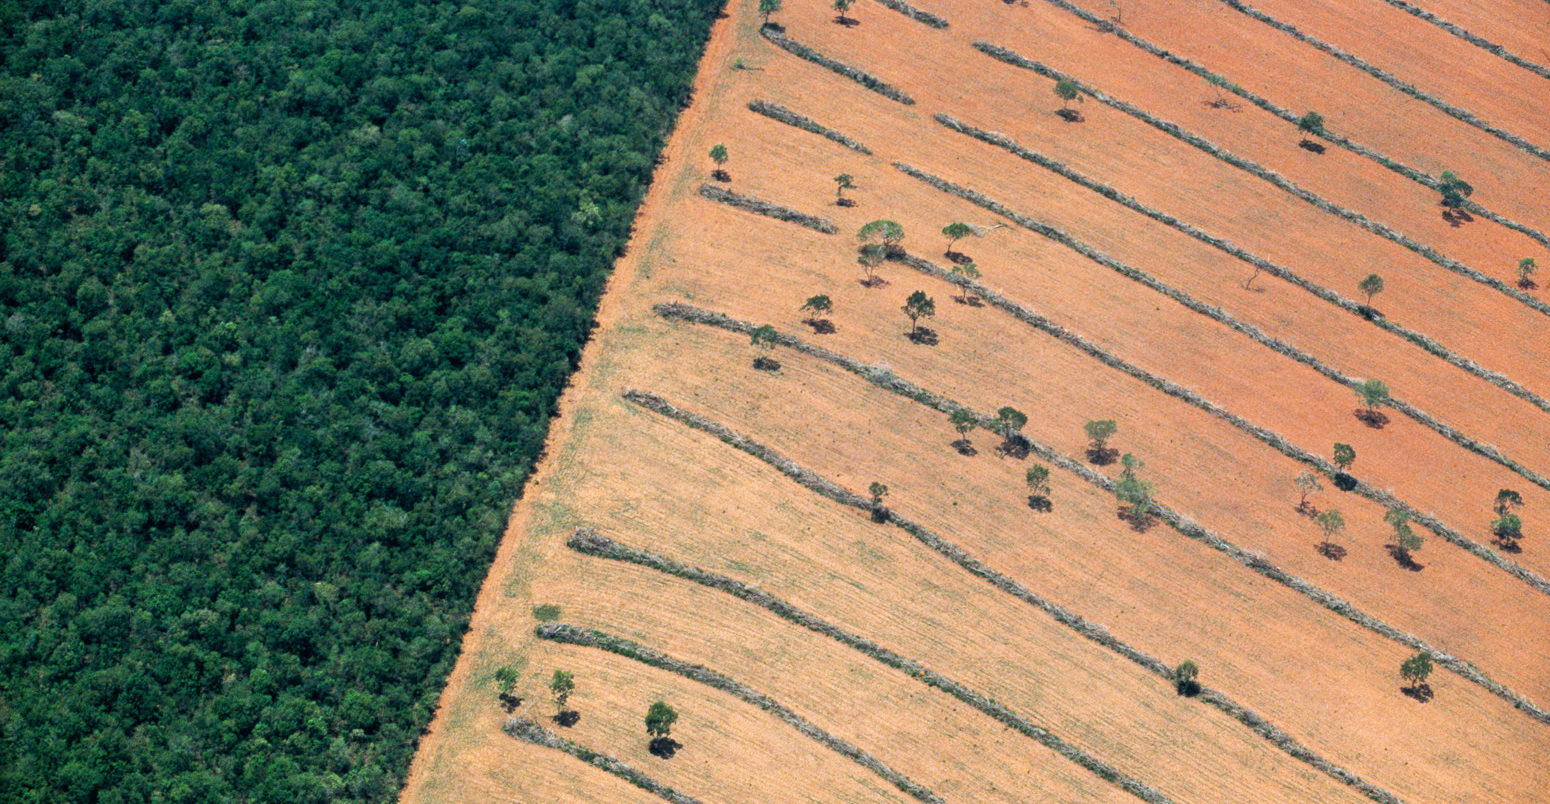
“Land-use change” is any way in which humans modify the natural landscape. Some of these changes are permanent destruction, such as urban expansion. Other changes, such as cropland abandonment and forest restoration, may attempt to repair previous damage. It is a widespread phenomenon – humans have altered “about three-quarters of the Earth’s land surface” in the past millennium, the authors write.
Land use is typically measured in one of two ways: by high-resolution satellite imagery, or by large-scale statistical surveys. But each of these methods has its drawbacks when assessing land-use change, the study says. Satellites can capture land use in high detail, but their records only extend back a few decades. Estimates based on satellite images also tend to miss some nuances of land use – such as the distinction between unmanaged grasslands and those used for grazing.
Statistical methods and surveys, such as those that the UN Food and Agriculture Organization (FAO) has been carrying out since 1961, extend further back in time than the satellite record, but at a much more coarse resolution. And little work has been done to combine these two approaches.
“The information on land and land-use change is very fragmented,” Karina Winkler, the lead author of the study and a PhD candidate in land-system dynamics at the Karlsruhe Institute of Technology and Wageningen University, tells Carbon Brief:
“The idea was to collect as many data [sources] as possible and bring them together.”
Combining all of these disparate data sources, the authors write, also has the advantage of reducing the inconsistencies or limitations of any single dataset.
Winkler and her colleagues brought together more than 20 satellite land-use products and long-term surveys. The resulting dataset, which they termed the “Historic Land Dynamics Assessment plus” (HILDA+, for short), captures annual changes in land use across the globe with a resolution of 1km.
But not all land-use change is permanent. So rather than looking at “net” changes that only capture the overall transformation of an area, HILDA+ captures places where land use has changed multiple times – such as rotation between cropland and pasture. When these “gross” changes are summed up, the total extent of land-use change between 1960 and 2019 is 43m km2 – just under one-third of the total land surface of the Earth.
The map below shows where both single-change (yellow shading) and multiple-change (red) events are occurring around the world. Instances of multiple-change events are dominant across Europe, India and the US, while single change events are widespread across South America, China and south-east Asia.
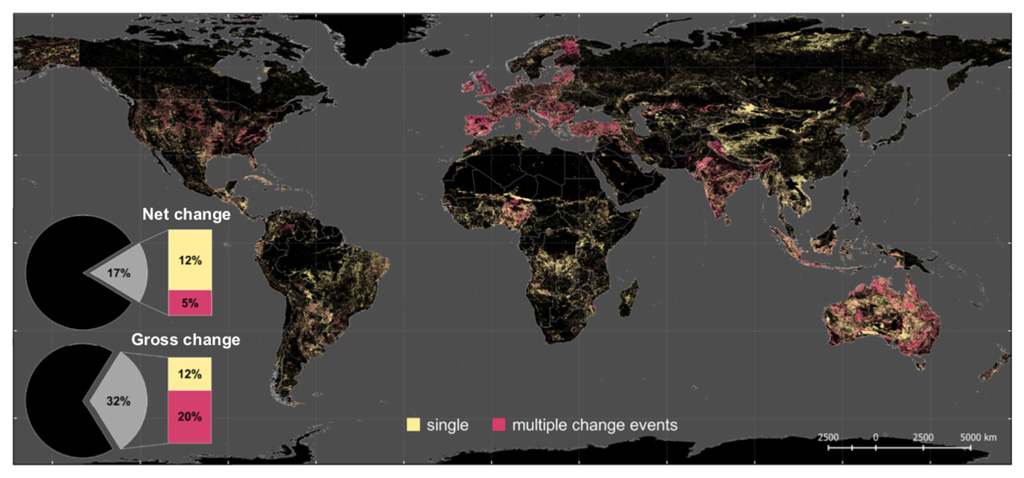
Global land-use change nearly doubles when considering gross change, from 17% to 32% of the Earth’s land surface. And nearly two-thirds of this gross change is due to multiple-change events. Studying land-use change in this way – as an accumulation of all the changes occurring over time, rather than as net change – can help better account for the greenhouse gas emissions associated with land use, Winkler says.
A source and a sink
According to the Intergovernmental Panel on Climate Change’s 2019 special report on climate change and land, nearly one-quarter of total human-caused greenhouse gas emissions between 2007 and 2016 were due to agriculture, forestry and other land use. In total, land use falls just behind electricity and heat production as the world’s second-largest contributor to greenhouse gas emissions.
But land is also a major “sink” of greenhouse gases – for example, through the carbon taken up by forests. This balance of sources and sinks through land-use change, the IPCC report says, is a “key source of uncertainty” in considering the future of the land carbon cycle. Knowing the dynamics of past land-use change in finer detail can help inform the way climate modellers represent these changes, Winkler says.
“Land-cover change is really, really dynamic,” Prof Navin Ramankutty, a land-systems scientist at the University of British Columbia, tells Carbon Brief. Ramankutty, who was not involved in the study, adds:
“If you’re just using net land-use changes over time, you might not actually capture the dynamic of carbon being taken back up by the land.”
The new work on its own cannot provide much insight into how these gross land-use changes might affect the picture of climate change, Ramankutty says. “The devil is in the details,” he explains:
“It’s hard to say what the implications are [for climate change] without actually running [the new estimates] through a carbon-cycle model.”
However, he adds, the updated estimates are “a much more careful reconstruction of how land has changed”. He notes that it “seems more sophisticated than previous work” and that he would recommend using the new dataset.
Patterns of change
Following the definitions used in the FAO’s annual surveys, the researchers separate out six categories of land use: urban areas, cropland, pasture, unmanaged grassland, forest and sparsely vegetated land. Several notable patterns jump out when looking at what types of change are occurring where, the authors say.
For example, about half of the single-change events – or nearly 20% of the total changes – occur due to agricultural expansion, such as deforestation. And 86% of the multiple-change events are agriculture-related, predominantly occurring in the global north and select rapidly growing economies.
Averaged globally, land-use change steadily increased for nearly half a century since the FAO surveys began. But, in 2005, there was a “rather abrupt change” in this trend and land-use change began decelerating worldwide, the authors write.
The charts below depict the differences in land-use change rates between six geographical regions, as well as the worldwide average. The global rates of change can be defined by an acceleration period from 1960 to the early 2000s, followed by deceleration since about 2005.
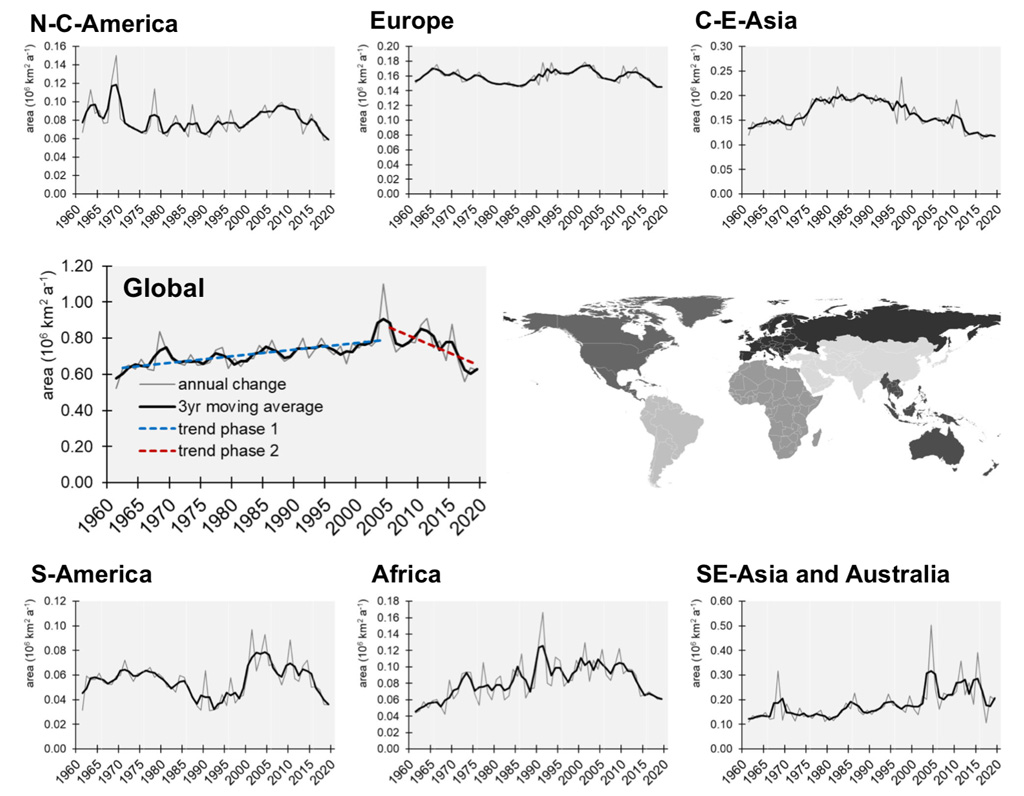
Examining these changes in the context of global political and economic events, the researchers hypothesise that the “rate and extent of global land-use change is responsive to socio-economic developments and disruptions”.
Although it is hard to prove such causation with certainty, they write that “the transition from accelerating to decelerating land-use change is related to market developments in the context of the global economic and food crisis” that occurred in the late 2000s. Increasing globalisation and a fast-growing population drove expanding land use in the 1990s and early 2000s. As oil prices rose rapidly, peaking in 2008, demand for biofuels from the global north – but grown in the global south – rose, too.
However, in the aftermath of the 2007-08 global financial crisis, imports declined and agricultural expansion in the global south slowed as demand for commodity crops dropped off. Since then, reduced foreign investment and land acquisitions have meant the deceleration of land-use change has continued.
This phase shift from accelerating to decelerating land-use change is just one example of a larger pattern of “teleconnections”, whereby economic changes in one region of the world can have far-flung effects on land-use elsewhere, Winkler says:
“Political changes in the global north are driving some land-intensive changes in the global south and these effects have increased since the 2000s or late ‘90s.”
Changes in agricultural land use are more variable than changes in forest cover, the authors note, because agriculture is more responsive to external factors such as geopolitical shifts, extreme weather and global supply-chain disruptions.
In the future, Winkler plans to continue trying to tease out the impacts of socio-economic events on land-use change around the world, but she hopes that many others will take advantage of the new data for their own work. She tells Carbon Brief that the new dataset is “for many different interest groups to use. It’s kind of a playground and a starting point for a new perspective on land-use change.” She adds:
“The most important message is that when we look at the topic of land-use change with a finer lens or more detail…with this harmonising approach, we can track the speed of land-use change in a better way and we can also explore the background of why land-use change happens.”
Winkler, K. et al. (2021) Global land use changes are four times greater than previously estimated, Nature Communications, doi:10.1038/s41467-021-22702-2
-
Land-use change has affected ‘almost a third’ of world’s terrain since 1960