Melting Arctic sea ice linked to ‘worsening fire hazards’ in western US
Ayesha Tandon
11.25.21Ayesha Tandon
25.11.2021 | 4:00pmArctic sea ice melt has driven an increase in “fire-favourable weather” across the western US over the past four decades, according to new research.
The study, published in Nature Communications, finds that low Arctic sea ice levels during July to October have knock-on impacts in the atmosphere that push the jet stream northwards. This tends to bring hotter and drier conditions in the western US over the following autumn, resulting in more frequent and intense fires in the region, the authors find.
They add that this mechanism may strengthen over the coming decades as the Arctic melts further, making the western US “even more susceptible to destructive fire hazards”.
Meanwhile, a separate study published in Nature Climate Change finds that extreme wildfire activity has increased globally over 1979-2020 – mainly driven by decreasing humidity and increasing temperatures.
As the climate warms and fire weather becomes “more extreme”, there may be “more catastrophic fires” stretching across larger regions, the authors warn.
Ice and fire
The impacts of climate change are diverse, affecting different parts of the world in different ways.
The Arctic is warming more than twice as fast (pdf) as the global average, driving rapid sea ice loss. Over the past 15 years, scientists have recorded the 15 lowest Arctic sea ice extents in the satellite record, while September of this year marked the lowest level of “multi-year” Arctic sea ice on record.
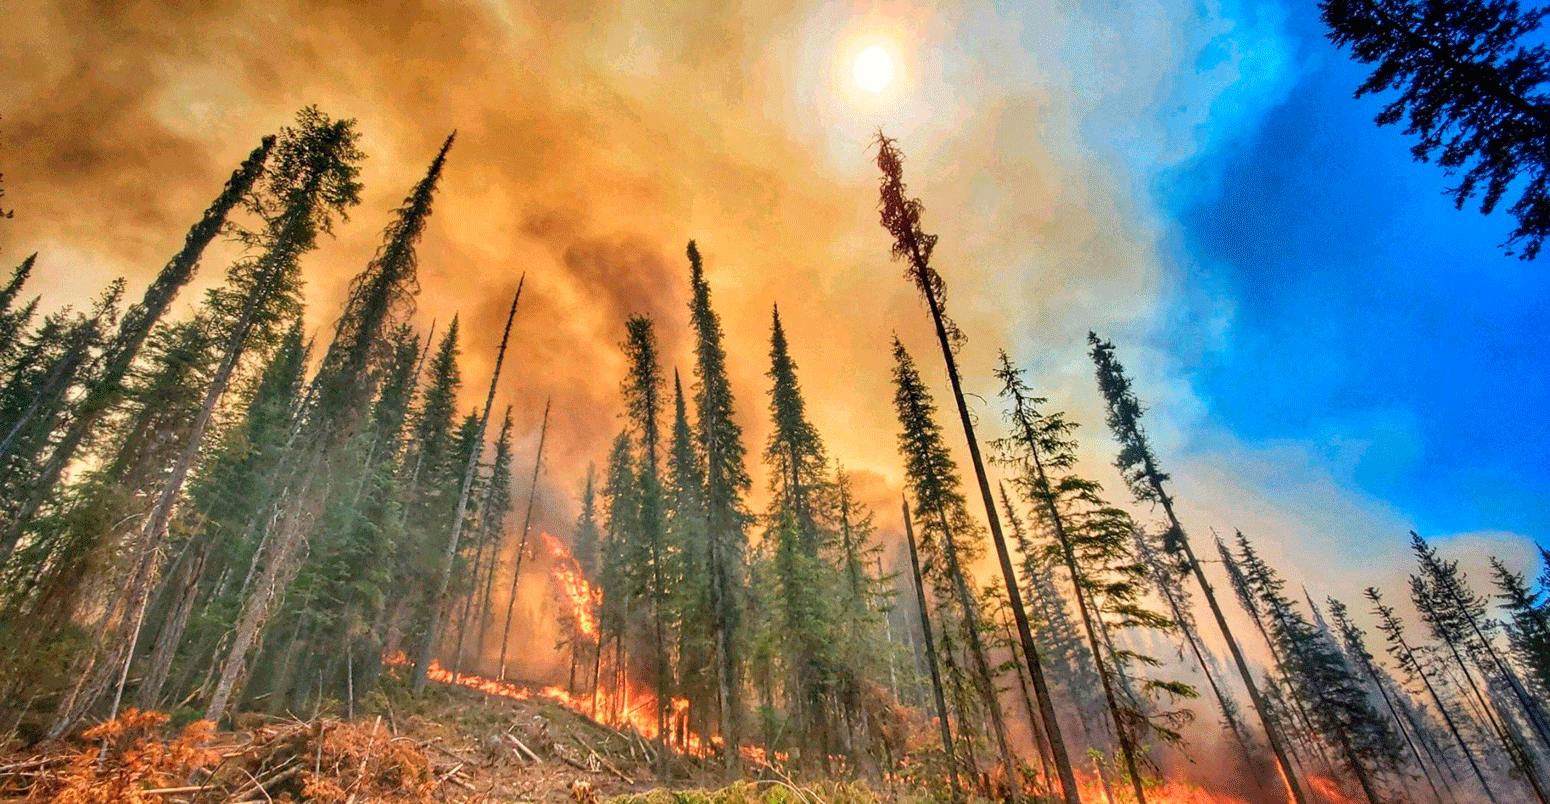
Meanwhile, hotter and drier weather is driving wildfires to tear through parts of the US with increasing intensity and frequency. A 2018 Carbon Brief factcheck found that “most of the area burned today is in the western US, where drier conditions tend to allow for large, quickly-spreading wildfires”. Meanwhile, a recent Guardian article says:
“More than half of the 20 largest fires in California history burned in just the last four years. Eight of the top 20 fires in Oregon occurred in that time frame too. Last year, Arizona saw the most acres burned in its history. California’s August Complex fire, which consumed more than 1m acres alone, became the first-ever giga-fire in 2020.”
While these two impacts may seem unrelated, a new study – using a range of observations, sensitivity tests and targeted model runs – suggests that they are linked through a pattern of large-scale atmospheric pressure and circulation changes called a “teleconnection”.
Dr Jennifer Francis is the acting deputy director at the Woodwell Climate research centre and was not involved in the research. She summarises the teleconnection and tells Carbon Brief why it is significant in a warming climate:
“Diminishing sea ice favours hotter, drier conditions in western states that set the stage for fierce wildfires, such as those scorching the region during recent years. These results are bad news, as sea ice is expected to continue its downward spiral because our emissions of heat-trapping, ice-melting gases show no signs of abating.”
The plot below highlights the link between low sea ice concentration and fire-favourable weather. It shows changes in sea ice concentration (blue), a fire weather index (red) a fire-favourable circulation index (yellow) over 1979-2020, where red shading indicates low sea ice concentration and blue sharing indicates high sea ice concentration.
Note that the y-axis for SIC is inverted, with low sea ice concentration at the top of the scale and high sea ice concentration at the bottom.
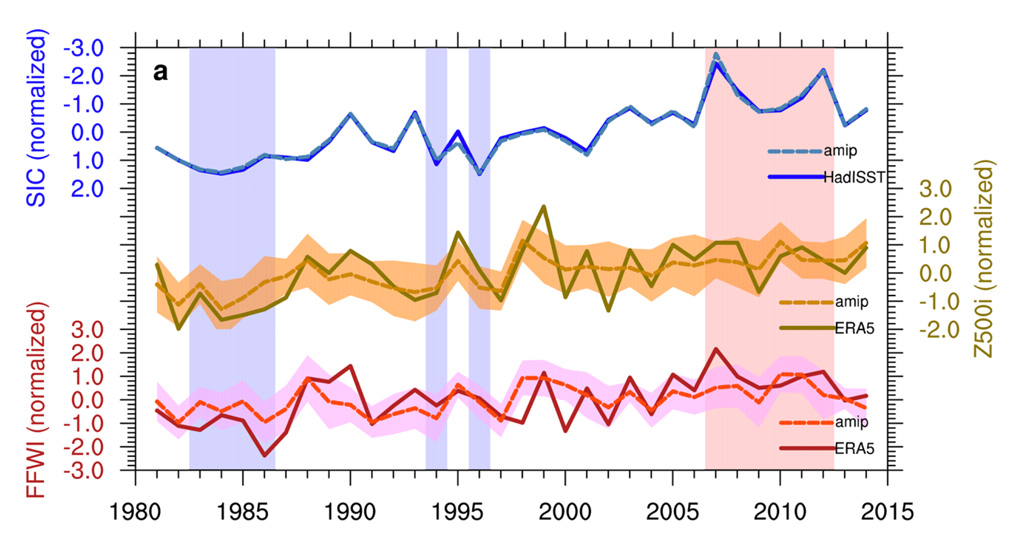
The plot shows that when sea ice concentrations are low, the fire favourable circulation index and fire weather index are generally high. Dr Hailong Wang, an Earth scientist at the Pacific Northwest National Laboratory, is an author on the study. He tells Carbon Brief that the impact of melting sea ice on US wildfires is comparable to that of other, better known drivers:
“The fire weather changes driven by declining Arctic sea ice during the past four decades are of similar magnitude to other leading modes of climate variability, such as the El Niño-Southern Oscillation, that also influence fire weather in the western US.”
The authors warn that as the Arctic continues to melt, weather conditions in the western US will get hotter and drier, driving “more and larger wildfires” across the region.
Arctic teleconnection
The study uses a range of observational and model-based techniques to determine the link between Arctic sea ice and worsening wildfires. Wang tells Carbon Brief about some of the methods used:
“We first used observational data to reveal a connection between Arctic sea ice extent and fire risk in the western US, and then conducted sensitivity experiments with a state-of-the-art fire-enabled climate model to show that declines in Arctic sea ice during the months preceding fire season can fuel increases in large autumn wildfires over the western US.”
The authors find that low levels of Arctic sea ice in the summer and autumn means the region reflects less of the sun’s incoming radiation, leading to stronger surface warming. A warmer surface means greater heating of the air immediately above it, which subsequently rises through the atmosphere.
The “teleconnection” describes the knock-on impact this has in the atmosphere, which, ultimately, shifts the jet stream further poleward and causes “suppressed precipitation and elevated surface air temperature and vapour pressure deficit over the western US”, the authors say. The image below explains this teleconnection in greater detail.
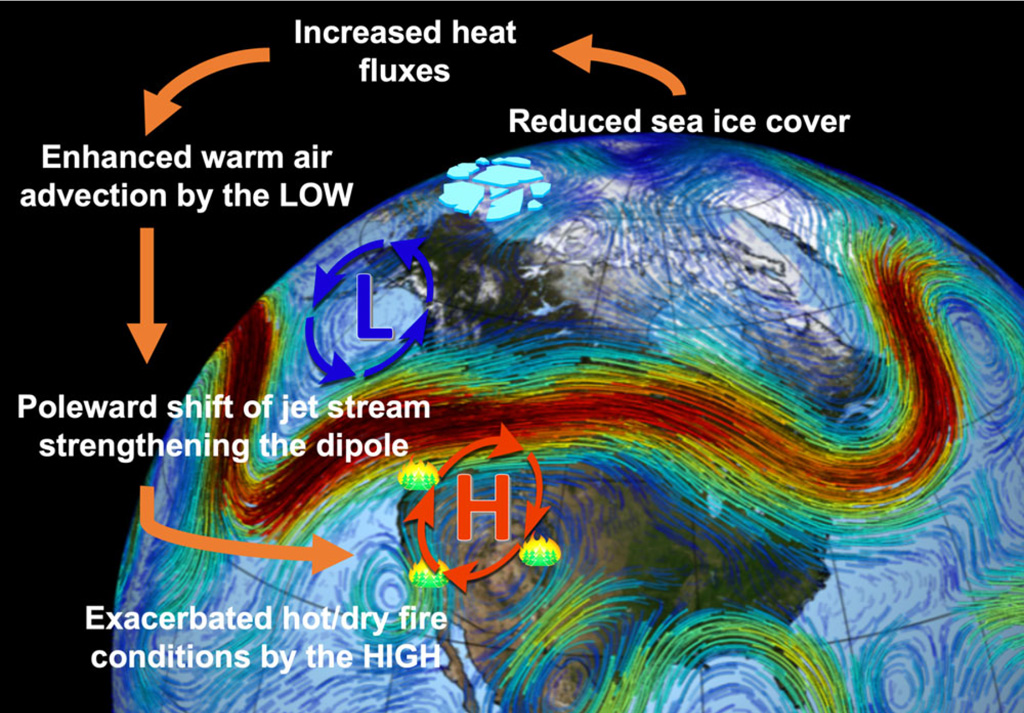
The jet stream is a current of fast-flowing air high up in the troposphere, which separates cold polar air to the north from warm tropical air to the south. A poleward shift in the jet stream affects weather patterns in the western US by suppressing rainfall and bringing in warmer temperatures, the paper says.
This study feeds into a long-standing discussion within scientific circles on whether changes in the Arctic can influence mid-latitude weather through changes to the jet stream and other mechanisms.
Dr Daniel Swain is a climate scientist at UCLA’s Institute of Environment and Sustainability and was not involved in the research. He tells Carbon Brief that the connection between Arctic sea ice loss and climate extremes in the western US climate extremes has been “discussed for some time”, but that there “hasn’t really been much convincing evidence to back up those claims” to date. Swain adds:
“My own personal view, as a climate scientist who focuses on western US extremes and follows the ‘Arctic/mid-latitude weather’ debate closely, has long been that some kind of connection probably does exist between recent Arctic sea ice loss and certain long-term climate trends in the US west. But the actual scientific evidence for that, until fairly recently, has been pretty weak. This new study does add an important empirical data point into the ‘a relationship probably does exist’ column, though with some caveats.”
Prof James Screen, an associate professor in climate science at the University of Exeter, who was not involved in the research, tells Carbon Brief that past papers have connected Arctic sea ice loss to droughts in California, but that this study “goes an important extra step further” in “drawing a link to fire-favourable weather”.
He adds that the results of the study are “strengthened by the agreement between the observational analyses and model experiments”.
Similarly, Dr Judah Cohen – director of seasonal forecasting at Atmospheric and Environmental Research (AER), who was also not involved in the study – says that he was “impressed” by the analysis, which has “comprehensive and compelling” findings. He tells Carbon Brief that the “good consistency among all the different avenues of analysis”, makes the arguments and conclusions “quite convincing”.
‘Extreme fire weather’
Meanwhile, a second study exploring changes in wildfires over the past four decades has been published in Nature Climate Change. Dr Piyush Jain from Canada’s northern forestry centre is the lead author of the study and explains its key findings to Carbon Brief:
“Our research shows that extremes in fire weather – the very hot and dry weather that are associated with wildfires – have been increasing globally over the last four decades. In fact, the eight most extreme fire weather years globally have occurred in the last decade…These changes in extreme fire weather have been driven predominantly by increases in temperature and decreases in atmospheric moisture.”
The paper explores three different indices – fire weather index (FWI), initial spread index (ISI) and vapour pressure deficit index (VPD). These indices measure the potential intensity of the fire, the potential rate of fire spread and difference between the saturation and actual vapour pressure (in which higher values result in drier conditions), respectively.
The authors focus on trends in “extreme” fire weather, by using the 95th percentile – the most extreme 5% – of results, over 1979-2020. The plot below shows changes in the 95th percentile in all three indices (FWI95, ISI95 and VID95) over this period, where the height of the bar shows deviation from the 1979-2020 average and the colour of the bar shows the annual global mean temperature difference compared to the 1979-2020 average.
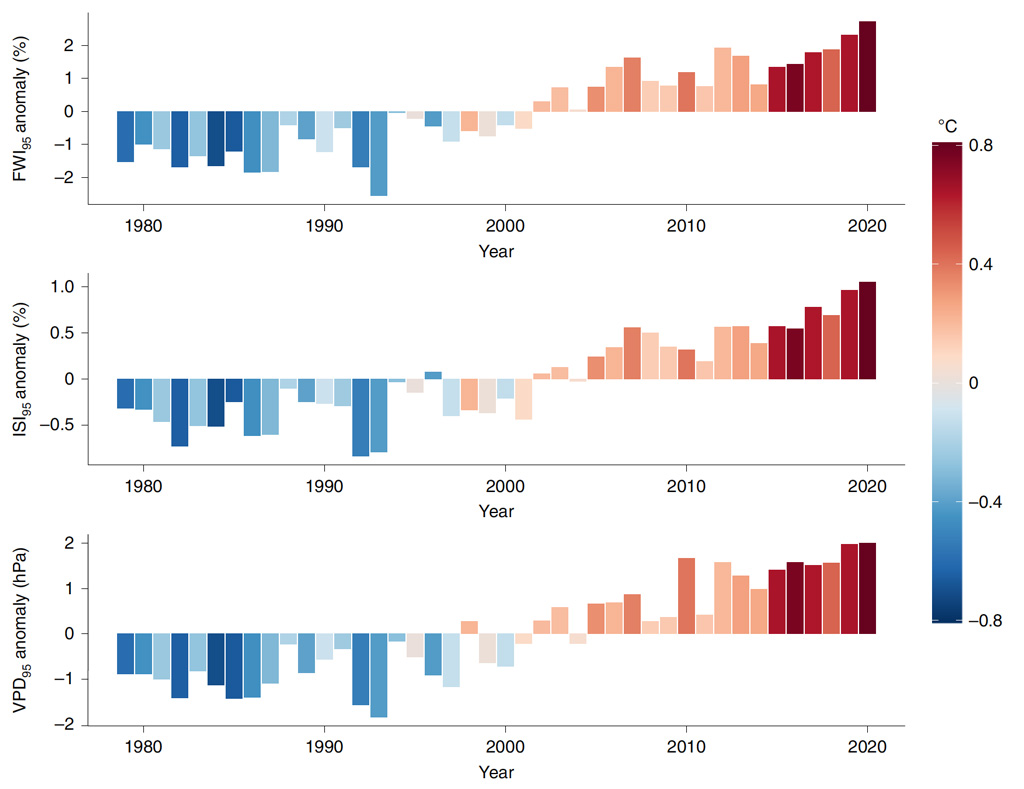
The plot shows that hotter years are linked to higher potential fire intensity, fire spread and dryness, and that fire conditions have been progressively worsening in recent decades. The authors find that over the studied period, FWI95, ISI95 and VID95 have increased by 14%, 12% and 12%, respectively.
The map below shows trends in the three indices for “burnable” parts of the planet. Red shows an increase in the indices – indicating higher potential fire intensity, fire spread and dryness – while blue shows a decrease. Jain explains that regions such as North Africa, which are dominated by desert, are “considered barren because there is essentially no vegetation there to burn”, and so they are not included in the analysis. These regions are shown in grey.
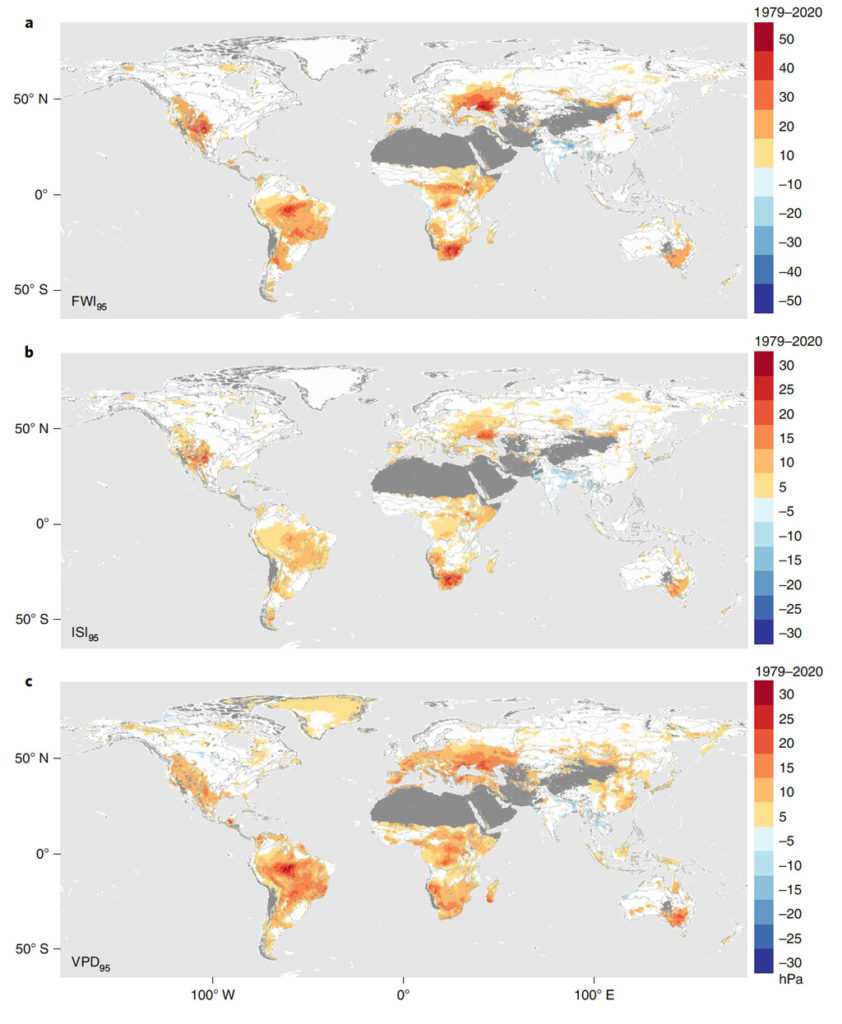
The authors find that “significant increases” in fire weather occurred over “a quarter
to almost half of the global burnable land mass” over the past four decades. The study adds:
“Decreasing relative humidity was a driver of over three-quarters of significant increases in FWI95 and ISI95, while increasing temperature was a driver for 40% of significant trends.”
However, some regions have seen a decrease – most notably in India, where widespread use of irrigation has driven an increase in humidity that has suppressed wildfire activity, the authors say.
“This is the first study that I’m aware of that assesses the drivers of recent changes in extreme fire weather across the globe,” explains Dr Danielle Touma – a postdoctoral fellow at the National Center for Atmospheric Research.
She tells Carbon Brief that while extreme fire weather conditions are “well documented” in the western US, this paper provides “new insight for many parts of the world that are also vulnerable to increases in fire weather conditions”.
Zou et al (2021) Increasing large wildfires over the western United States linked to diminishing sea ice in the Arctic, Nature Communications, doi: 10.1038/s41467-021-26232-9
Jain et al (2021) Observed increases in extreme fire weather driven by atmospheric humidity and temperature, Nature Climate Change, doi: 10.1038/s41558-021-01224-1