Met Office: A review of the UK’s climate in 2020

Guest authors
01.12.21It is no exaggeration to say that 2020 has been a dramatic and memorable year for the UK – and our weather and climate is no exception.
We have experienced periods of record-breaking rainfall, record dry and sunny periods, and another notable summer heatwave.
This has resulted in 2020 being the UK’s third warmest, sixth wettest and eighth sunniest year in the UK national series, which extend back to 1884 for temperature, 1862 for rainfall and 1919 for sunshine. 2020 is the only year that features in the Top 10 ranking for all three.
The remarkable year was also the third warmest in the long-running Central England temperature series (from 1659) and the 18th wettest year in the long-running England and Wales precipitation series (from 1766). Rainfall totals were particularly high across western Scotland and north-west England, so the UK series ranks higher than England and Wales.
Our weather is playing out on a background of ongoing global climate change. It is likely that, globally, 2020 was one of the three warmest years on record and that 2011-20 was the warmest decade. It is, therefore, no surprise at all that the UK climate is also continuing to change as a result. The UK has warmed by close to 1C, comparable to the global rise in average temperature.
The year overall
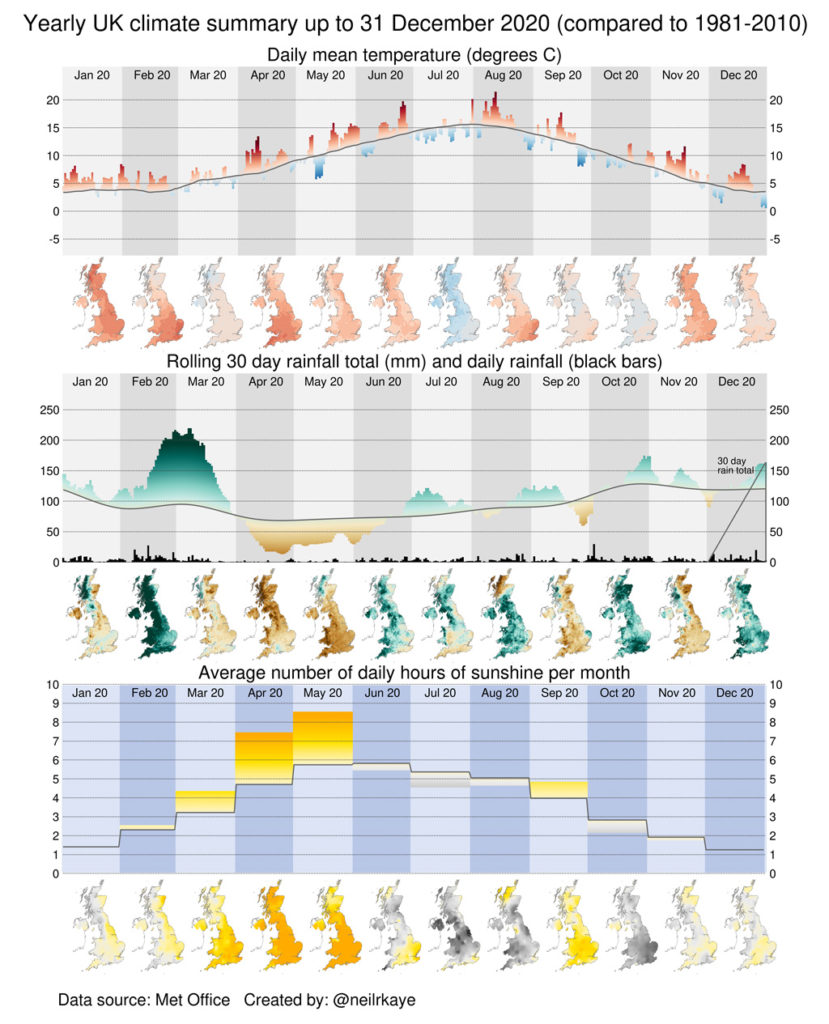
The graphic below summarises the UK’s weather for the months of 2020, covering temperature (top), rainfall (middle) and sunshine hours (bottom).
The figure highlights that temperatures were above average for much of the year, with notable warm spells in April, June, August and November. In fact, only July and October were cooler than average overall.
The exceptional rainfall in late winter followed by the extended dry and sunny spring dominate the rainfall and sunshine series for the year.
The green peak above the line in the rainfall chart indicates the very wet February – UK’s wettest on record – while the brown valley that follows, as well as the orange and yellow bars in the sunshine chart, means that the spring season really stands out.
Average UK temperature for 2020 as a whole was 9.62C, which is behind only the years 2014 (9.88C) and 2006 (9.70C), and marginally warmer than 2011 (9.61C). In the HadUK-Grid observational dataset that goes back to 1884, all of the Top 10 warmest years for the UK have occurred since 2002.
For the individual nations, it was the second warmest year on record for England, third for Wales, 10th for Scotland and 19th warmest for Northern Ireland.
The maps below show the “anomalies” for average temperature (left), rainfall (middle) and sunshine (right), which indicate how 2020 differed from the long-term average. For example, the darkest red shading illustrates that the largest temperature anomalies were in the south east.
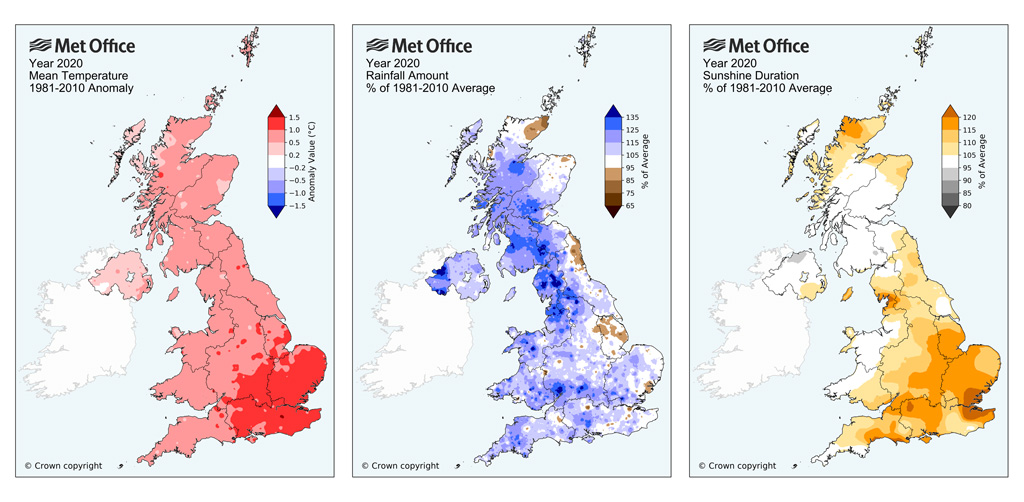
For rainfall, there was 114% of average totals during 2020, the sixth highest in the HadUK-Grid series that goes back to 1862. Overall, the highest anomalies were in the north-west of the UK (dark blue shading), while some eastern coastal areas were close to or slightly below average (white and brown shading).
Scotland and Northern Ireland ranked as seventh wettest year, Wales as 10th and England as 20th.
It was the eighth sunniest year for the UK, seventh for England. Sunshine anomalies were largest in the south-east of England (darkest orange shading), with much of Scotland, Wales and Northern Ireland being somewhat closer to average (white shading).
Attribution of climate change
Using well-established “attribution” methods, we can quantify how human-caused climate change affected the likelihood of a year as warm as 2020 occurring.
We have conducted a preliminary analysis using a suite of nine climate models from the sixth Coupled Model Intercomparison Project (CMIP6). This provides a set of 51 simulations of the real world with all climate forcings included (“ALL”, in red) and 54 simulations with only natural climate forcings (“NAT”, in green), which are shown in the charts below for temperature (left) and rainfall (right). The black lines show observations for temperature and rainfall.
(The ALL ensemble extends to 2100 – based on the Shared Socioeconomic Pathway (SSP)2-4.5 “middle-of-the-road” narrative for future human-caused emissions – to indicate the UK’s potential future climate.)
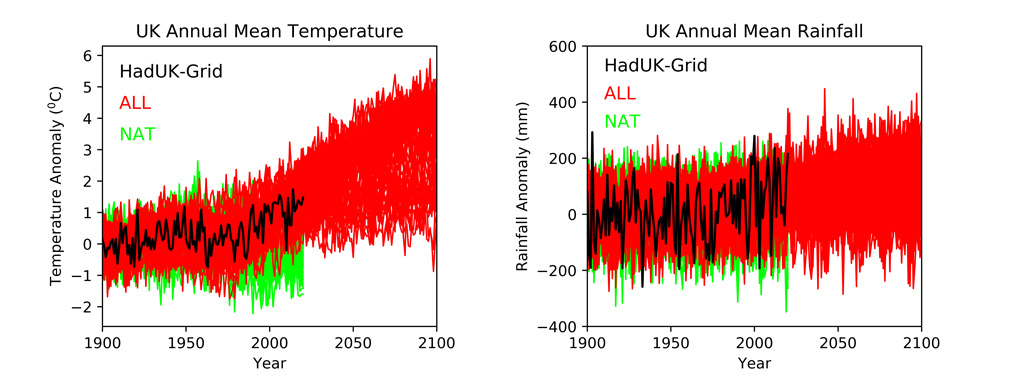
The climate model ensemble provides a good representation of the variability and trends in UK average temperature, providing confidence in our attribution assessment.
The models suggest that, without human-caused climate change, a year as warm as 2020 in the UK would have a likelihood of 1.1% (uncertainty range 0.9–1.3%), which is equivalent to around once every 90 years.
However, for our actual climate, which includes climate change, this likelihood estimate increases by around a factor of 50, to 56% (range 53–58%). This suggests that we now expect a year as warm as 2020 every other year.
In the future, this trend is expected to continue. In the SSP2-4.5 scenario by the end of the century, 85% to 89% of years would be warmer than 2020.
The impact of climate change on total annual rainfall for the UK is less clear than for temperature. This is a consequence of the high variability in rainfall over the UK. It is also because climate change is most likely to result in wetter winters and drier summers overall – changes that can cancel themselves out when looking at an annual total.
However, the likelihood of years as wet as 2020 is increasing and is expected to continue to do so through the century.
Future change
The latest UK Climate Projections (UKCP18) from the Met Office also provide projections of future change. These are “probabilistic”, meaning each projection has a likelihood attached to it.
The figure below shows the projected annual average temperature (left) and rainfall rate (right) for the 21st century, relative to 1981-2000, under the intermediate RCP4.5 emissions scenario. The green line shows the central estimate from multiple climate model simulations and the green shading indicates the full range in the projections.
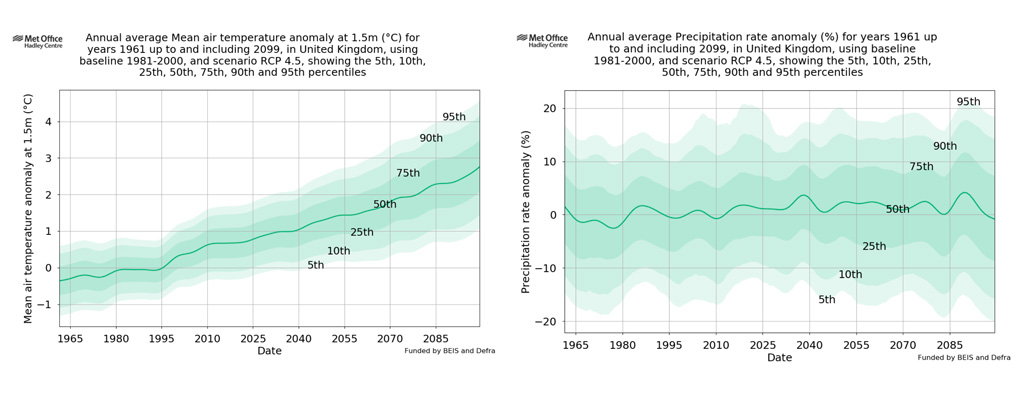
In a historical context, a year as warm as 2020 is unusual, resulting in it being the third warmest in the observed records. However, for the present and future climate we can expect most years to be warmer than 2020.
Relative to 1981-2000 average, 2020 was 0.93C warmer than average. However, the chart above suggests that, by the 2040s and 2050s, this would be counted as a cooler than average year.
For rainfall, annual projections for the UK have a large range as mentioned above. In the context of future climate, a year as wet as 2020 would still be considered a relatively wet year for the UK, but UKCP18 also projects an increase in the likelihood of its occurrence through this century.
Winter
February 2020 was the wettest February – and the fifth wettest calendar month – on record in a series dating back to 1862.
Rainfall during the month was more than twice the average with some areas having as much as four times their normal rainfall. February saw three notable winter storms in rapid succession – Ciara, Dennis and Jorge – which delivered 44% of the month’s rainfall. This concluded what was the fifth mildest and fifth wettest winter season on record.
We have seen a number of exceptionally wet winters in the last decade and, due to climate change, we expect UK winters to become wetter. Of the Top 10 wettest winters, four have occurred since 2007 and seven since 1990 – while there has been a 17% increase in the total rainfall from extremely wet days.
In just over a decade we have now seen the UK’s wettest February (2020), April (2012), June (2012), November (2009) and December (2015) – remarkably new national records in five out of twelve months.
Spring
In stark contrast to winter, a buckling of the jet stream in late March allowed high pressure to dominate the UK weather through spring. As a result, spring 2020 was the sunniest on record – the only seasons that were sunnier were the summers of 1955, 1976 and 1989. It ranked as the eighth warmest and fifth driest spring.
Each of March, April and May saw below-average rainfall, but it was May that particularly broke records. With just 9.6mm average rainfall it was the driest May on record for England and, with 14.3mm, the second driest for Wales.
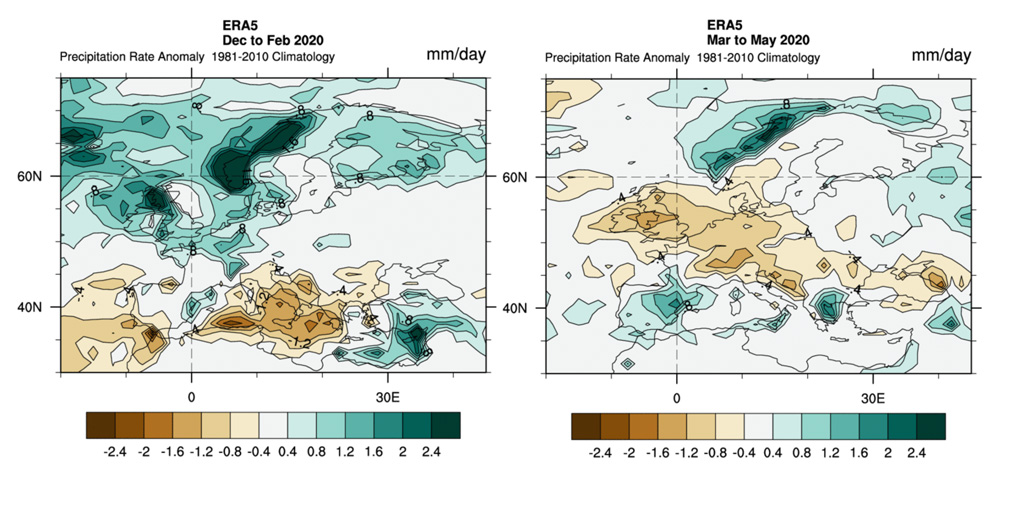
The pattern of large-scale circulation in the atmosphere is critical to understanding the contrasting fortunes of winter and spring. The maps below show rainfall anomalies from the ERA5 reanalysis for winter (left) and spring (right), with the green and brown shading indicating wetter and drier than average conditions, respectively. (Reanalysis data provides estimates based on a combination of direct measurements and a weather model.)
The wet winter across the UK and northern Europe was associated with a drier-than-normal winter for much of southern Europe. In contrast, while the UK and central Europe experienced a dry and sunny spring, wetter-than-average conditions occurred in southern European regions.
Overall, seven of the Top 10 warmest springs in the UK have occurred since 2000. Daytime maximum temperatures during spring 2020 benefitted from warming by the sun under clear skies, but climate change is still likely to have played a role in the warm weather.
Summer
Summer was both warmer and wetter than average for the UK. July was actually the coolest month of the year, relative to average, but the final day of the month saw temperatures reach 37.8C at Heathrow, the third hottest day on record for the UK and one of only four days in historical records to record temperatures above 37C.
France and Spain also saw near-record temperatures in a year that the Copernicus Climate Change Service (C3S) declared the warmest on record for Europe as a whole.
The isolated hot day at the end of July was the prelude to a more extended heatwave that commenced on 7 August, with temperatures exceeding 34C for six consecutive days.
Temperatures above 34C occurred in seven UK summers between 1961 and 2010. In contrast, they have occurred in seven of the last 10 summers as a result of our warming climate.
The heatwave was a result of a Scandinavian “blocking” high-pressure weather system that resulted in a hot tropical continental air mass influencing the UK.
When such conditions occur, the chances of breaking high temperature records is increasing. A recent study investigated the likelihood of exceeding 40C in the UK. It finds that, under a very high emissions scenario, such extremes could be taking place every few years in the UK climate of 2100.
Autumn
While much of 2020 saw unusual weather, autumn started out a little more calm. That said, mid-September saw some notably high temperatures – reaching 31.3C at Frittenden in Kent. Overall, September was a relatively dry month for most of the country.
The arrival of the first named storm – Alex – of the 2020-21 season marked the transition to much more unsettled weather. Following the passage of storm Alex, persistent and widespread rain resulted in the UK provisionally estimated to have received 31.7mm as a UK area-average for 3 October. By volume, this would be enough water to fill Loch Ness and is the wettest day in a daily UK series from 1891.
Rather remarkably in a series of over 47,000 days the year, 2020 had both the wettest (31.7 mm, 3 October) and third wettest day (27.2 mm, 15 February).
With the intense rainfall of 3 October following a dry September, the impacts from flooding were not too severe for the UK. However, Storm Alex did result in extreme rainfall and severe flooding in south-east France.
The combination of further rainfall through the autumn and early winter with Storm Bella on 26-27 December did result in some flooding for the UK.
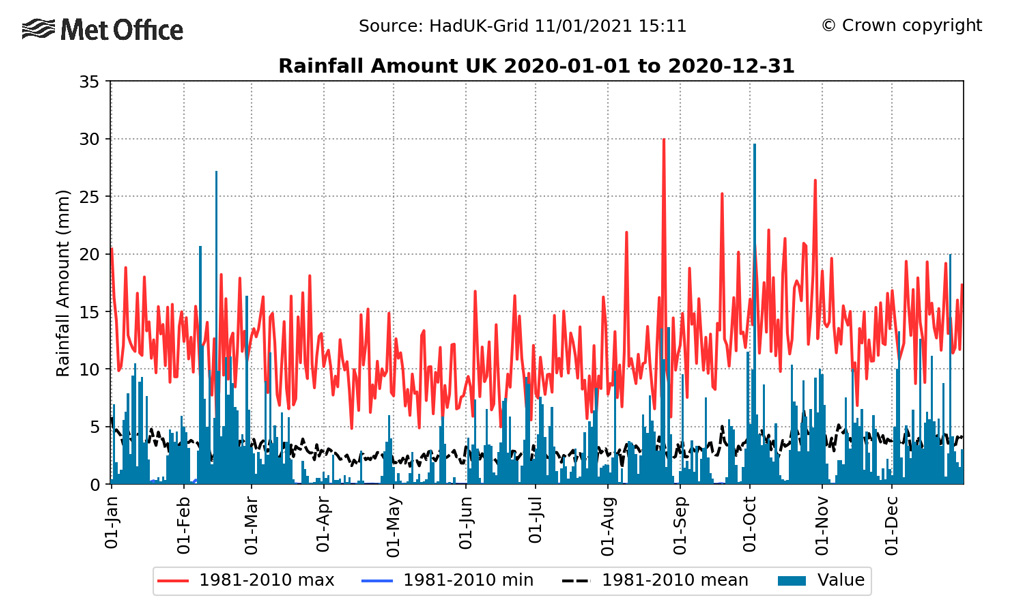
It is worth noting that during 2020 the UK has experienced four extremely wet days, with provisional UK area average rainfall at or above 20 mm. These were associated with storms Ciara and Dennis in February, rain following storm Alex in October, and storm Bella in December. There are only 40 such days in a data series of over 47,000 days from 1891 to present.
You can see these four peaks of rainfall in the chart below, which shows daily rainfall totals for 2020 (blue bars), as well as the average (black dotted line), minimum (blue line) and maximum (red line) for 1981-2010.
Further data, statistics and analysis of 2020 are currently being reviewed, and will be released in the Met Office annual State of the UK Climate report scheduled for publication in late July 2021.
-
Met Office: A review of the UK’s climate in 2020
-
Met Office: The UK’s remarkable and record-breaking weather in 2020
-
Met Office: UK’s warm 2020 made around 50 times more likely by climate change