Natural ocean fluctuations could help explain Antarctic sea ice changes
Daisy Dunne
12.03.18Daisy Dunne
03.12.2018 | 4:00pmSince satellite records of sea ice began in the 1970s, the world’s poles have shown a contrasting picture. While Arctic sea ice levels have fallen steadily over the past few decades, Antarctic sea ice levels have shown a less clear trend; increasing for several decades before falling to new lows in the last few years.
Now, a study offers a new theory that could help explain Antarctic sea ice changes. It suggests that, for the last few decades, natural fluctuations could have trapped heat deep in the Southern Ocean – leaving surface water relatively cool and helping to preserve the ice.
This natural ocean variability could be acting “in concert with other previously identified factors” – such as changes to surface winds and the cooling effect of melting Antarctic ice sheets – to allow Antarctic sea ice to persist in some parts of the Southern Ocean in spite of global warming, the authors say.
If the theory is correct, it could mean that the world will see a “decrease in [Antarctic] sea ice cover in coming years”, another scientist tells Carbon Brief. This is because the ocean’s trapped heat will eventually reach the surface and – combined with the impact of climate change – cause sea ice to melt away, he says.
Enigmatic ice
The past few decades has seen the rapid decline in the annual extent of Arctic sea ice – with research suggesting that climate change is playing a major role in the downturn. At the south pole, however, changes in sea ice levels have been less clear cut.
Changes in the extent of Arctic (blue) and Antarctic (red) sea ice from 1978-2017 are shown below – with thick lines showing changes to the yearly average and thin lines showing changes to the monthly anomalies.
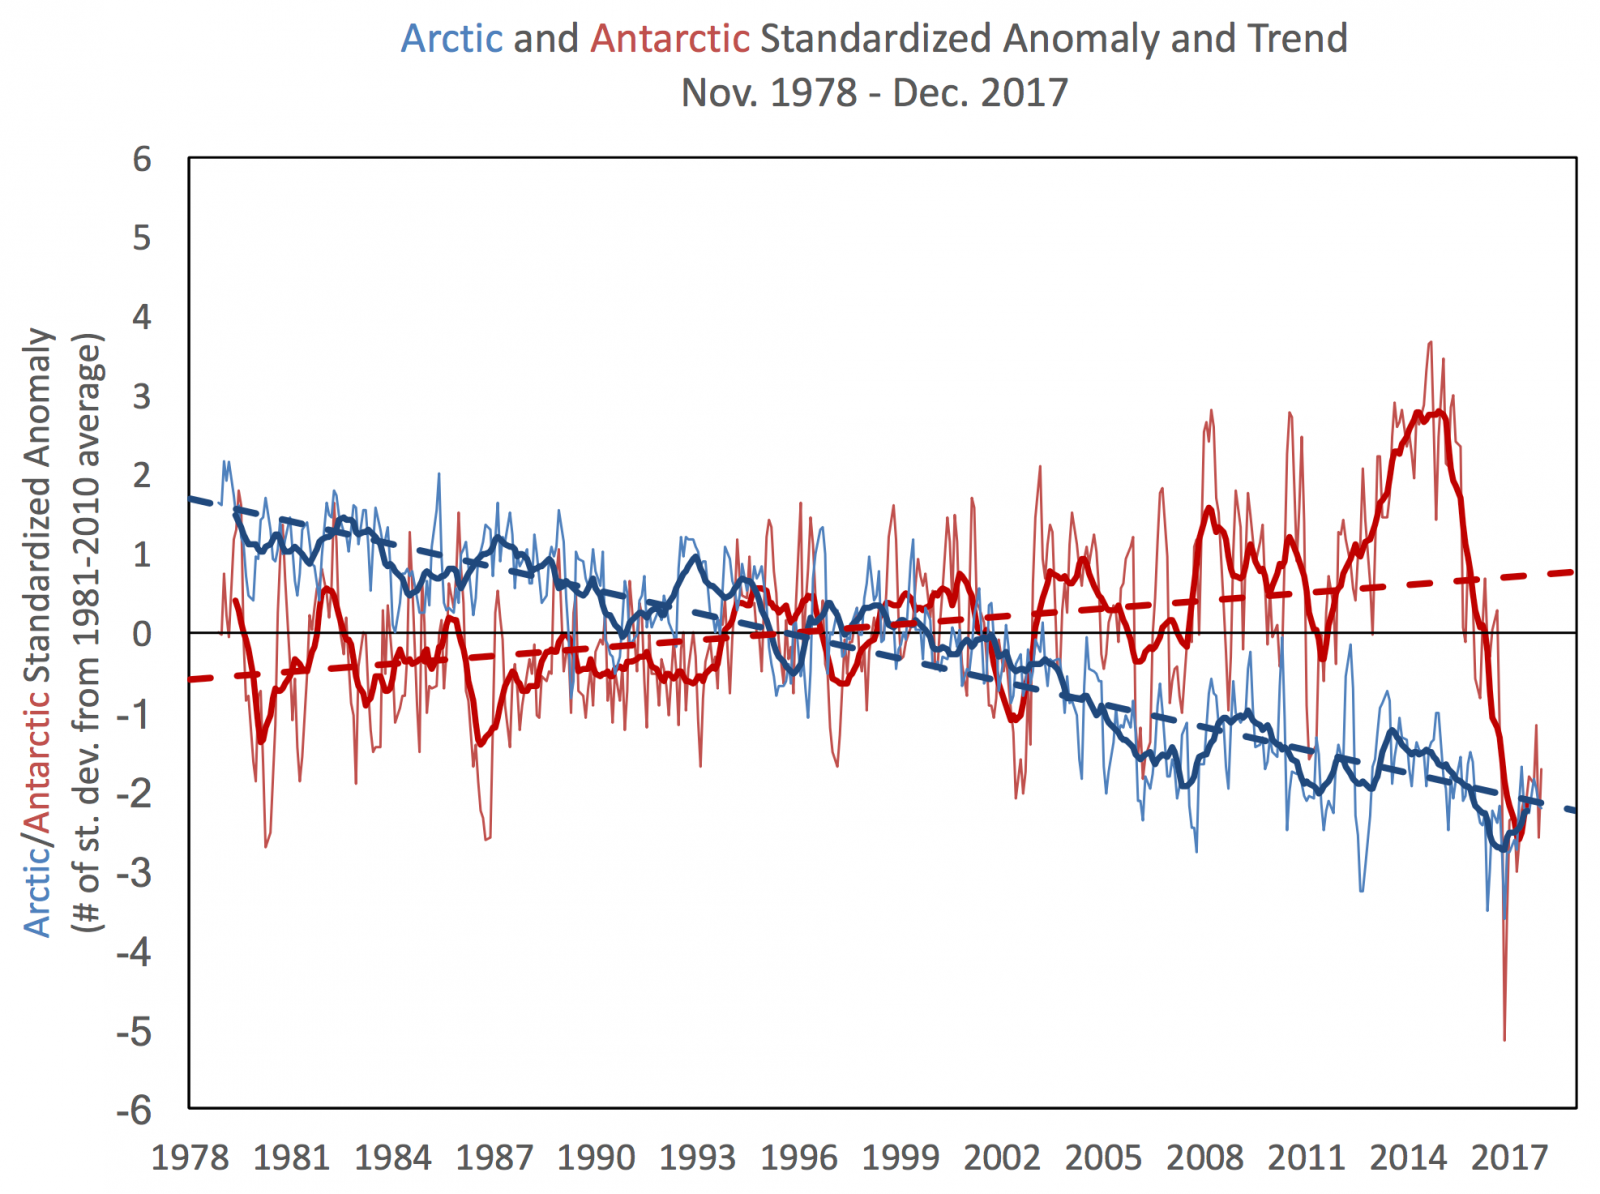
Changes in the extent of Arctic (blue) and Antarctic sea ice (red) from November 1978 to December 2017, relative to a 1981-2010 baseline. Thick lines show changes to the yearly average and thin lines show changes to the monthly anomalies. Source: National Snow and Ice Data Center, University of Colorado, Boulder
The chart shows how, on average, annual levels of Antarctic sea ice slowly increased until around 2016 – when some months experienced record lows in sea ice cover.
It is important to note that the melting of sea ice does not contribute to sea level rise. This is driven by the melting of land-based ice sheets – which are reported to be melting at a rapid rate in Antarctica.
Sea ice plays an important role, however, in providing habitat for Antarctic wildlife, such as by offering penguins a dry spot to hide from marine predators.
This is one reason why understanding Antarctic sea ice changes is a “critical goal in climate science”, the researchers write in their study, which is published in Nature Climate Change.
They propose that changes to ocean “convection” could help to explain recent changes to Antarctic sea ice. “Convection” refers to a process whereby heat is transferred – usually, heat rises above cooler fluids because it is less dense.
The researchers suggest that, in some parts of the Southern Ocean, a series of natural events could be leading to the weakening of ocean convection, causing heat to become trapped deep below the ocean’s surface.
This could be leaving the sea surface relatively cool, allowing sea ice to form – in spite of rising global sea temperatures, explains lead author Dr Liping Zhang, a researcher of climate variability from the National Oceanic and Atmospheric Administration (NOAA). She tells Carbon Brief:
“Observations clearly show an expansion of Southern Ocean sea ice extent and a cooling sea surface temperature trends during the satellite era. We proposed a new hypothesis to explain these observed trends over the Southern Ocean: natural variability involving Southern Ocean convection may have contributed strongly to the observed trends.”
This natural variability could be running on a 30-year cycle, the research finds, which could explain the sea ice gains observed over the past few decades.
Oscillating oceans
For the research, the team used a new climate model that can be used to project changes to sea ice.
First, the researchers used the model to project changes to Antarctic sea surface temperatures (shown below; bottom left) and sea ice (bottom right) from 1979-2012, when only the impact of human-caused climate change is considered.
They compared these results to actual records of sea surface temperatures (top left) and sea ice (top right) from the same time period.
On the left-hand maps, pink and red show increases in sea surface temperature while blue shows decreases. On the right-hand maps, green shows sea ice losses while purple shows sea ice gains.
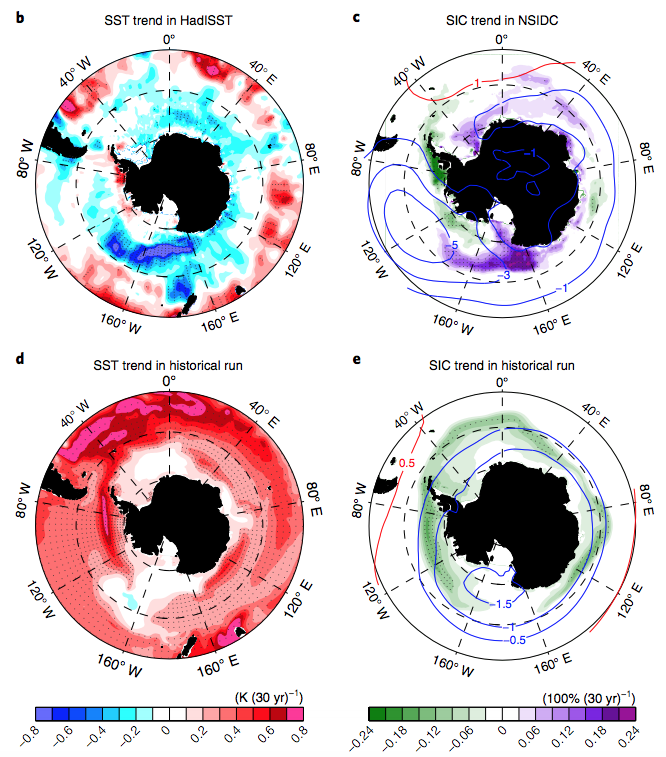
Changes to sea surface temperature (top left) and sea ice (top right) from 1979-2012 in Antarctica, compared to simulated changes to sea surface temperatures (bottom left) and (bottom right) over the same time period when only climate change is considered. On the left-hand maps, pink and red show increases in sea surface temperature while blue shows decreases. On the right-hand maps, green shows sea ice losses while purple shows sea ice gains. Lines are used to indicate the location of significant trends. Source: Zhang et al. (2018)
The results show that, in the simulated scenario where only the impact of past climate change is considered, increases in sea surface temperature and sea ice loss are large and widespread across the Southern Ocean.
The actual records, however, indicate that changes to sea surface temperature and sea ice have been much more variable, with some parts of the Southern Ocean experiencing increases in sea ice and some parts experiencing decreases.
For the next part of the experiment, the researchers used the model to simulate changes to sea ice in a pre-industrial period – a period before anthropogenic climate change. (This allowed them to work out whether natural factors could be playing a role in patterns of sea ice loss observed in the last few decades.)
The results from the pre-industrial simulation are shown below (sea surface temperatures on the left, sea ice changes on the right).

Simulated changes to sea surface temperatures (left) and sea ice (right) in a pre-industrial scenario. On the left, pink and red show increases in sea surface temperature while blue shows decreases. On the right, green shows sea ice losses while purple shows sea ice gains. Lines are used to indicate the location of significant trends. Source: Zhang et al. (2018)
The results from the pre-industrial simulation show similarities to the actual record of sea ice loss from 1979-2012 (shown in first image) – suggesting that natural factors are likely to have played a role in the pattern of sea ice loss and gain observed, Zhang says:
“We found that this natural variability in the model can produce approximately 30-year trends in sea surface temperatures and sea ice that resemble the observations. This suggests that natural internal variability associated with the Southern Ocean convection may play a significant role in the observed trends.”
Testing the theory
For the next part of the experiment, the researchers aimed to test their theory that a natural weakening of ocean convection could be driving the patterns of sea ice changes.
To do this, the researchers used the model to simulate changes to sea temperatures and sea ice from 1979-2012, when both past climate change and possible natural ocean fluctuations are considered.
They considered three scenarios for their analysis. In the first (shown below, left), ocean convection begins in an “active phase”. This means that, in the late 1970s, normal ocean convection is active and heat is transported to the surface. However, this is followed by a near 30-year period where, due to natural factors, convection is weakened and ocean heat is trapped in deep waters.
In this second scenario (middle), ocean convection is “inactive” – meaning heat is being trapped below the surface. Finally, in the third (right), convection is in a “neutral” phase.

Simulated changes to sea surface temperature (top) and sea ice (bottom) from 1979-2012 in Antarctica when ocean convection is in “active” (left), “inactive” (middle) and “neutral” phase. On the top maps, pink and red show increases in sea surface temperature while blue shows decreases. On the right, green shows sea ice losses while purple shows sea ice gains. Source: Zhang et al. (2018)
The results show that the simulation which included past global warming and “active” changes to ocean convection most closely match the actual changes to sea surface temperatures and sea ice that have been observed from 1979-2012. The authors write in their research paper:
“Remarkably, this simulation captures the principal features of the observed sea surface temperatures and sea ice trends, including the overall cooling trend and sea-ice expansion, the maximum cooling trend (sea ice increase) over the Ross Sea and a warming trend (sea ice decrease) in the Amundsen-Bellingshausen seas.”
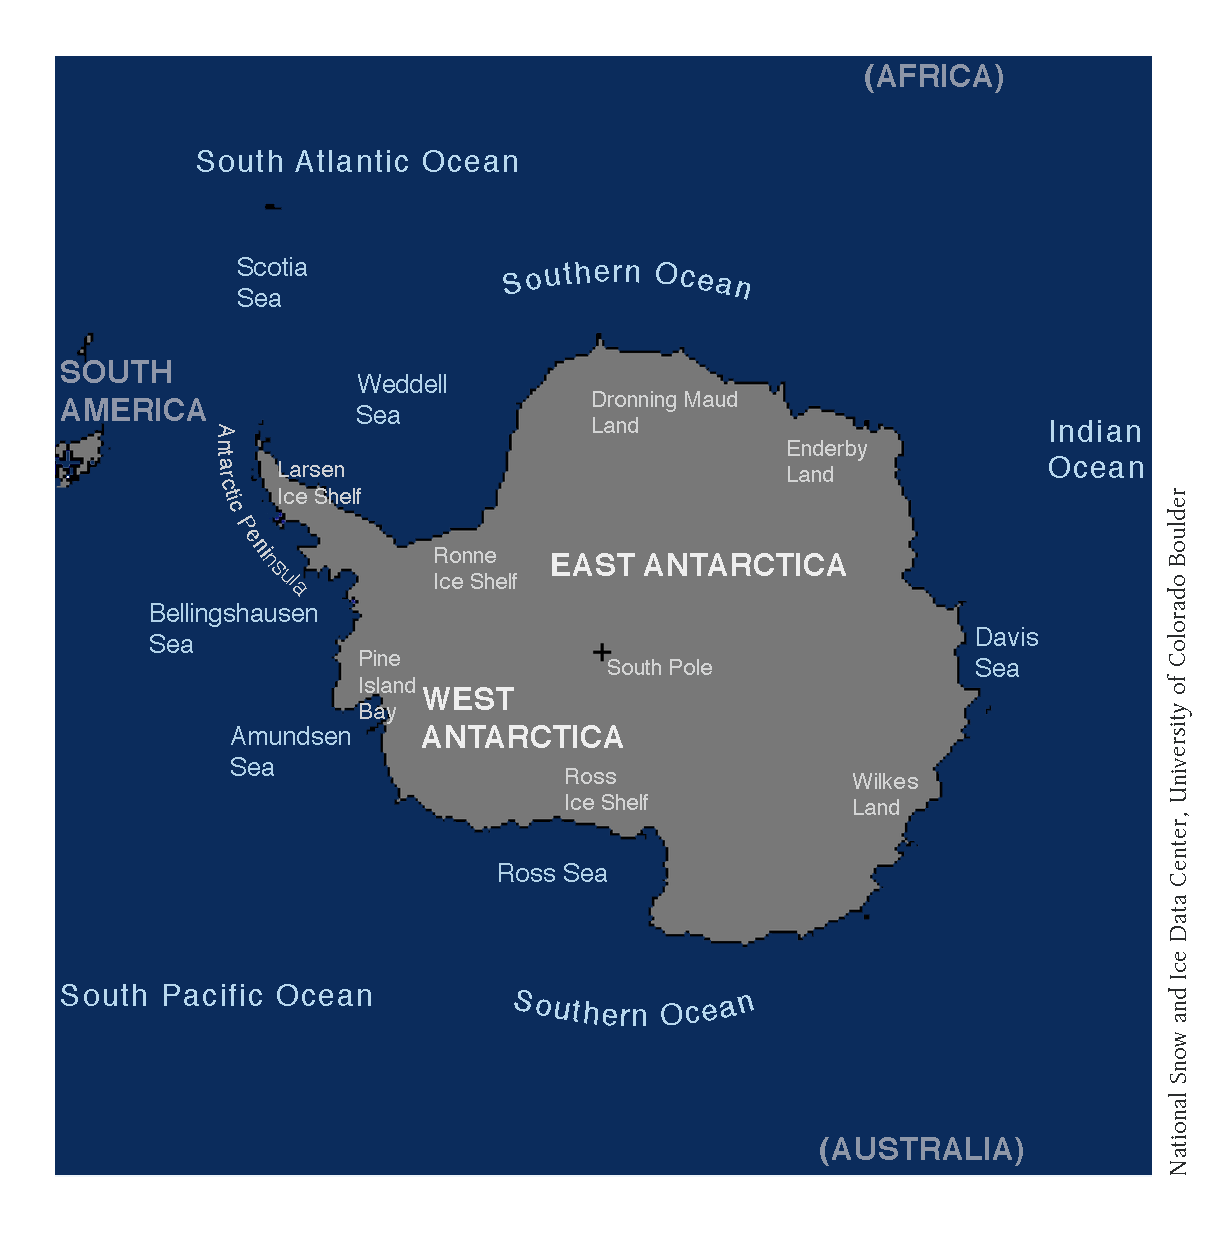
A map of Antarctica. Source: National Snow and Ice Data Center, University of Colorado Boulder
The reason that some parts of the ocean have warmed, while others have cooled, could be down to interactions between ocean convection and local levels of water salinity, the researchers say.
Missing puzzle piece?
The findings are “important” as they provide new evidence that recent Antarctic sea ice changes could be explained by natural factors, says Prof Marilyn Raphael, a researcher of Antarctic sea ice who was not involved in the study from the University of California, Los Angeles. She tells Carbon Brief:
“There is still debate on how much of the present trends in Antarctic sea are due to natural variability. This research presents further evidence to suggest that it is. The study also highlights the role of slowly varying mechanisms in the ocean in a way that has not been done before.”
The results represent another step forward in scientists’ understanding of what could have caused Antarctic sea ice to increase in recent decades in spite of global warming, say Dr Laura Landrum and Dr Marika Holland, from the National Center for Atmospheric Research (NCAR), who were also not involved in the study. In a joint statement, they tell Carbon Brief:
“This may be an important piece of the puzzle as to why sea ice has expanded in the Southern Ocean over the satellite era.”
The theory proposed by the researchers is likely to work in tandem with other previously identified drivers of sea ice loss and gain, says Dr Will Hobbs, an oceanographer from the University of Tasmania, who was also not involved in the study.
The most prominent theory for recent Antarctic sea-ice increases is that cold winds that blow over the Southern Ocean – causing water to freeze – have become weaker in recent decades. Hobbs says:
“Those explanations do a good job of explaining sea ice changes in some regions, and in particular the intense sea ice loss near the Antarctic Peninsula and increase in the eastern Ross Sea. They haven’t really been able to explain to very intense sea ice increase in the western Ross Sea, though, which is the strongest observed sea ice trend in Antarctica and explains much of the overall increase.
“There’s clearly an ocean component to this story, which this study seems to clarify. Assuming this theory is correct, we might expect to see a decrease in sea ice cover in coming years, as, eventually, enough heat builds up that it has to come to the surface and melt ice – combined with the impacts of human emissions.”
It is possible that this could explain why, during 2016, sea ice levels reached record lows, he adds:
“It’s intriguing to wonder whether this is what happened in 2016 when Antarctic sea ice suddenly dropped to record lows, but more work would be needed to state whether that was actually the case, or just due to an atmospheric anomaly.”
Although the overall magnitude of changes to ocean convection is not yet known, it is possible that the trapped heat could escape to the surface, Zhang says:
“The trapped heat can reach the sea surface and melt sea ice once the subsurface heat has accumulated to a strong enough degree.”
Zhang, L. et al. (2018) Natural variability of Southern Ocean convection as driver of observed climate trends, Nature Climate Change, doi:s41558-018-0350-3