Six charts show how clean power was world’s largest source of new energy in 2025
Multiple Authors
06.30.26Multiple Authors
30.06.2026 | 12:01amClean power added more to global energy supplies than any other source in 2025, according to the latest Energy Institute statistical review of world energy.
Outside the Covid pandemic, it was also the first year ever in which wind and solar, when combined, contributed more new energy than any of the individual fossil fuels.
The findings illustrate the “growing prominence” of electricity in the global energy system, according to the Energy Institute, a professional membership body that took over the production of the annual statistical review from oil firm BP in 2023.
It notes that electricity demand is rising much faster, at 3% in 2025, than energy use overall at 1.7% – and that all of the new power supply came from low-carbon sources.
While it includes data on data-centre demand for the first time, the review shows that these only make up 2% of all electricity use and 15% of the increase in 2025.
(The review does not explore other sources of demand, but separate data shows electrification of industry, heat and transport is a far larger driver of growth than data centres.)
At the same time, every source of energy – including coal, oil, gas, nuclear and hydro – also reached global all-time highs in 2025, the statistical review shows.
While the 86% of “primary energy” that came from fossil fuels is a record low, their real contribution to the economy is far lower, because roughly two-thirds of their energy is lost during combustion.
Below, Carbon Brief highlights the key findings of the review in six charts.
- Global energy supplies increase 1.7% in 2025
- Fossil fuels met a record-low 86.2% of global energy supply
- The ‘primary energy fallacy’ ‘inflates fossil fuels’
- Wind and solar were biggest source of new energy in 2025
- Clean energy met all of global electricity growth in 2025
- China generates more power than the US, EU and India combined
Global energy supplies increase 1.7% in 2025
The review shows that global energy supply reached a record high in 2025, climbing 10 exajoules (EJ, 1.7%) to more than 600EJ for the first time ever.
Within this total, there were new all-time highs for every energy source: oil; coal; gas; nuclear; wind and solar; as well as hydro and other renewables. This is shown in the figure below.
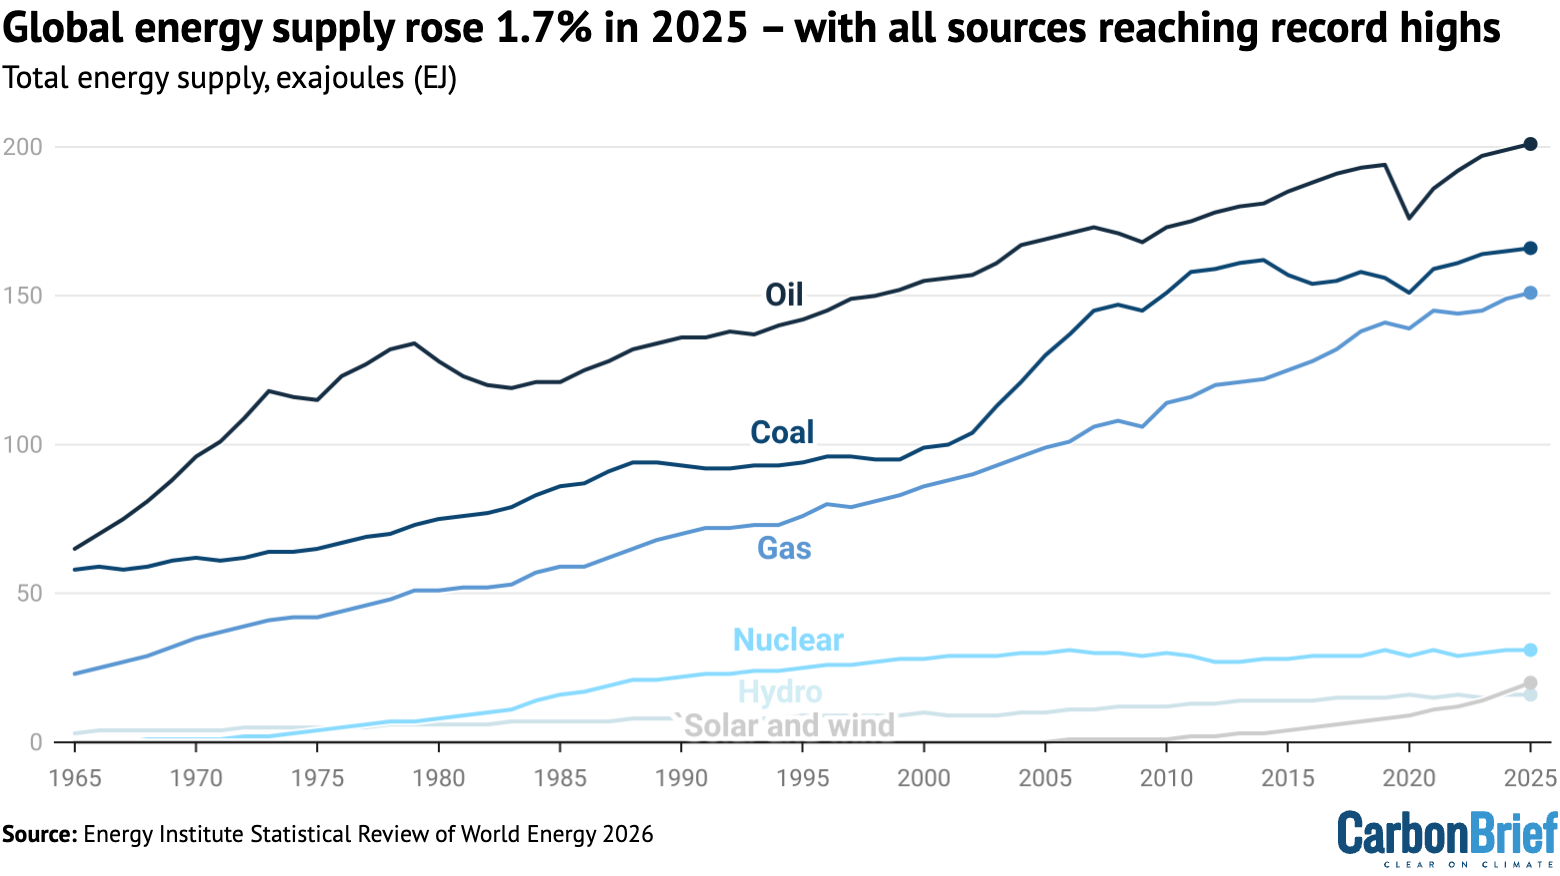
Notably, coal hit a new record of 166EJ in 2025, up 0.7% from a year earlier and 2.8% above the level reached in 2014, which had been seen as a potential peak for the fuel.
Wind and solar saw the fastest growth, up by 18.3% year-on-year, as well as adding more to global supplies – in combination – than any single fuel source.
Fossil fuels met a record-low 86.2% of global energy supply
Nevertheless, on the basis of these primary energy figures, the contribution of low-carbon sources to the global energy system still looks relatively small.
The latest data shows that fossil fuels made up 86.2% of global primary energy supplies, as shown in the figure below.
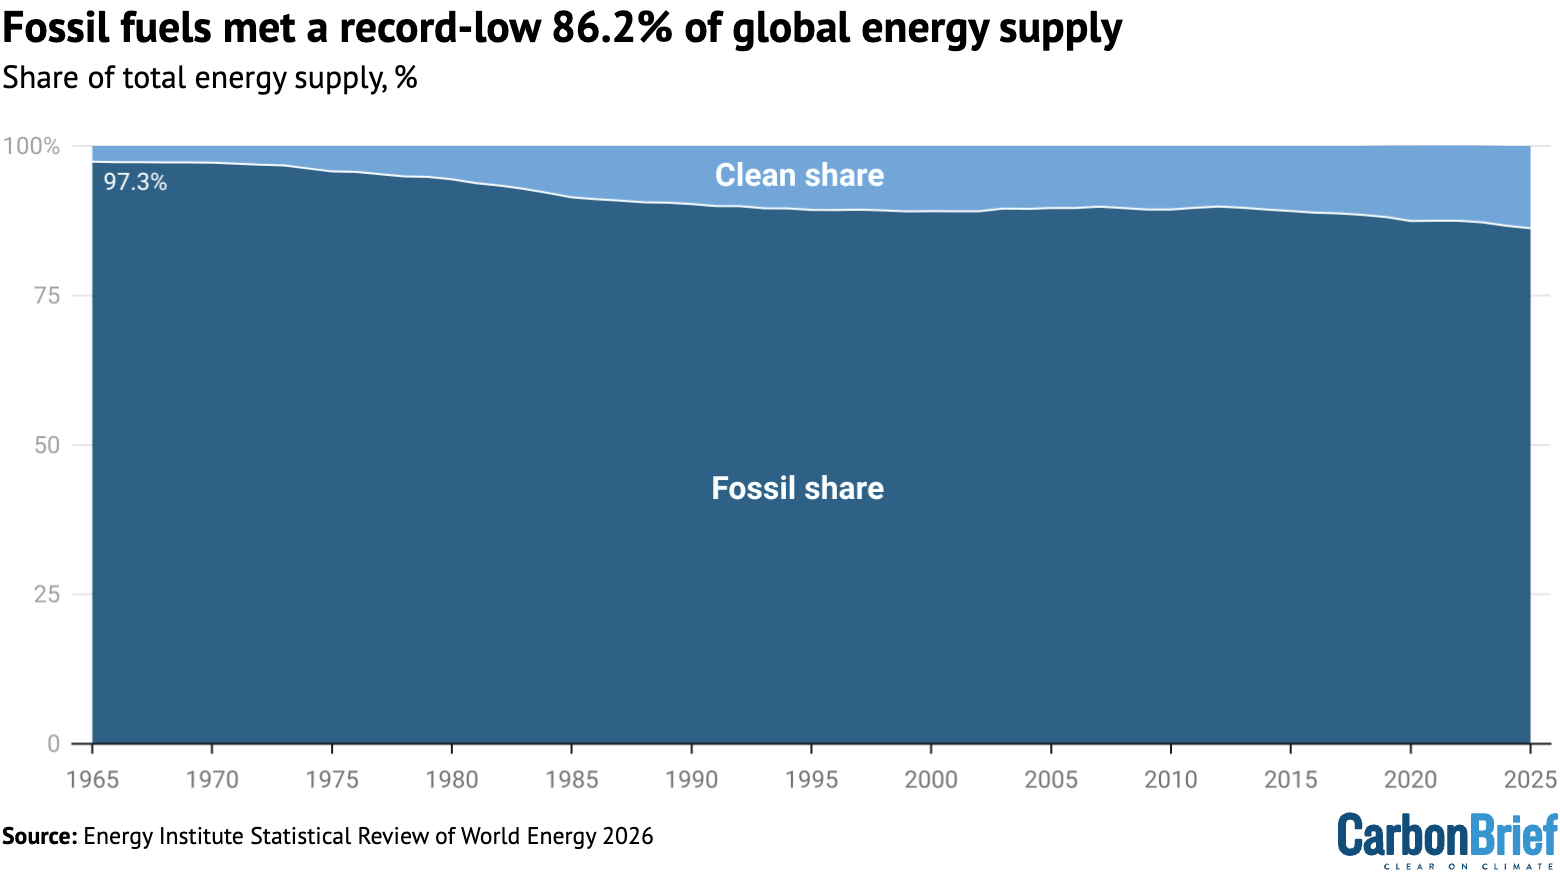
The rise of nuclear power had pushed the fossil-fuel share of global energy down to 91% as long ago as 1986, before the Chernobyl disaster pulled the plug on further growth.
It is only in the past decade that clean-energy sources have started to gain more ground, as a result of the rapid expansion of wind and solar.
The ‘primary energy fallacy’ ‘inflates fossil fuels’
Crucially, however, the statistical review is based on “total energy supply” (TES), a measure of primary energy. This counts the energy stored in coal, oil, gas and nuclear fuel going into the energy system, whereas for renewables it measures the amount of electricity coming out.
Yet, most of the energy in fossil fuels is lost as waste heat during combustion.
In fact, some two-thirds of all primary energy is lost before it can be turned into useful energy that moves a car, warms a home or keeps the lights on.
This gives rise to the “primary energy fallacy”, which tends to “inflate…the perceived contribution of fossil fuels” and the difficulty of replacing them with low-carbon energy sources.
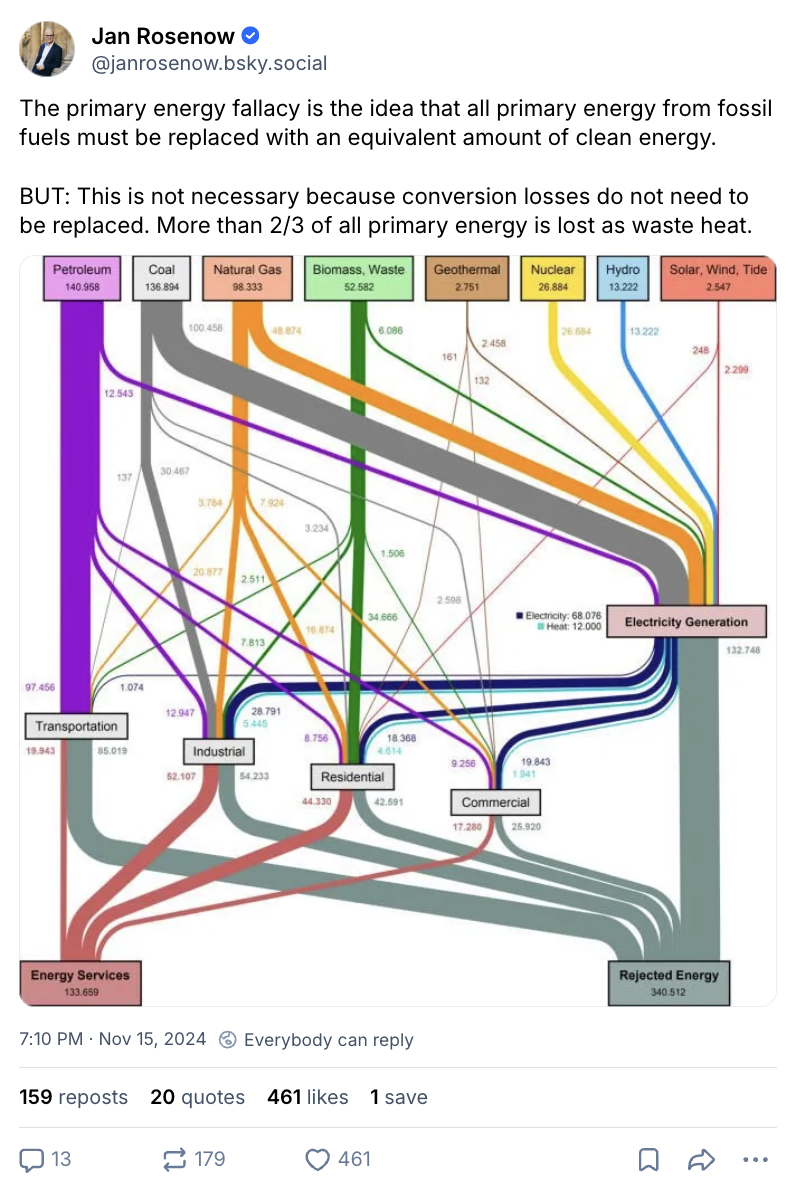
For example, the figure in the post shows that 105 units of energy went into the global transport sector – almost all of it oil – but this only generated 20 units of transport “energy services”.
In other words, less than 20% of the primary energy being used for transport actually ends up moving people or goods, while the remaining 80% was lost as waste heat.
Until 2024, the statistical review sought to address this issue by using the “substitution method” for clean-energy sources. This listed the primary energy supplied by wind and solar, for example, as the amount of fossil fuels that would have been needed to generate the same amount of electricity.
It stopped using this approach in 2025, explaining that this would reveal the higher efficiency of a clean-energy system that loses less energy during fossil-fuel combustion. It explained:
“Put simply, in future we will need to supply less energy in the form of clean electricity to undertake the same amount of work as the equivalent energy supplies from fossil fuels. Primary energy demand will decrease as the energy system increasingly electrifies and renewable electricity continues to increase its share of generation..”
Wind and solar were biggest source of new energy in 2025
With this in mind, it is all the more notable that wind and solar, in combination, were the world’s biggest source of new energy in 2025, as shown in the figure below.
Again, perhaps two-thirds of the new primary energy added by fossil fuels last year will never actually contribute useful work to the economy, because it will be lost as waste heat.
In contrast, the new energy added by wind and solar is in the form of electricity and almost all of it can be used directly to power factories, homes, appliances and electric vehicles.
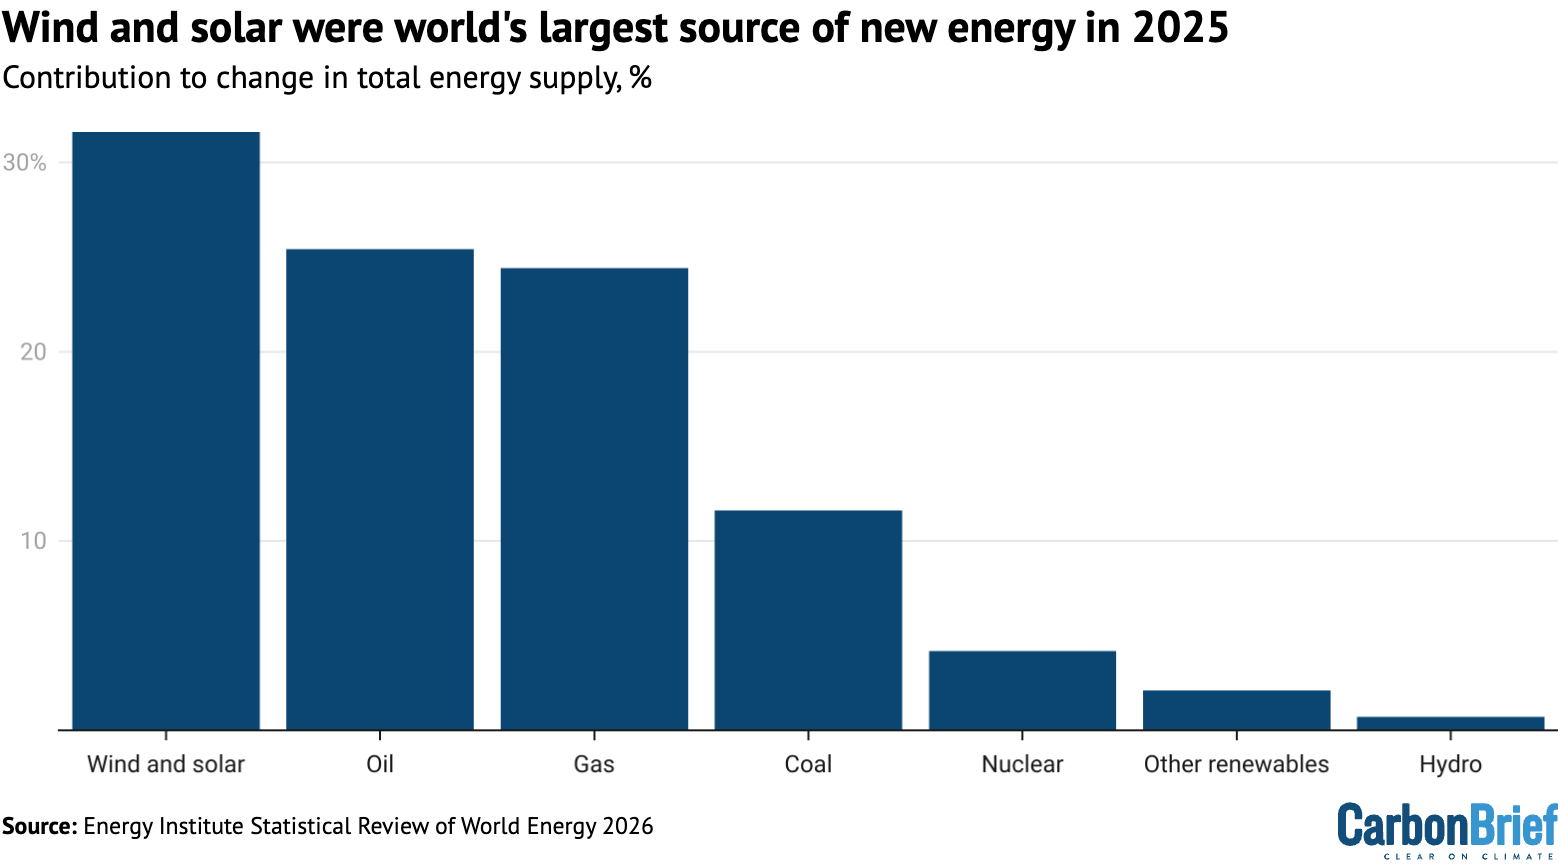
Moreover, wind and solar saw the fastest growth by far, up 18% in 2025 alone. Over the past decade, they expanded fivefold, while coal, oil and gas grew by 6%, 9% and 21%, respectively.
Clean energy met all of global electricity growth in 2025
The impact of renewables is clearest in the power sector, where combined with a new record for nuclear power, they met all of the growth in global electricity demand in 2025.
This is shown in the figure below, which illustrates how fossil generation was flat last year and how wind and solar now generate more electricity than hydro or nuclear power.
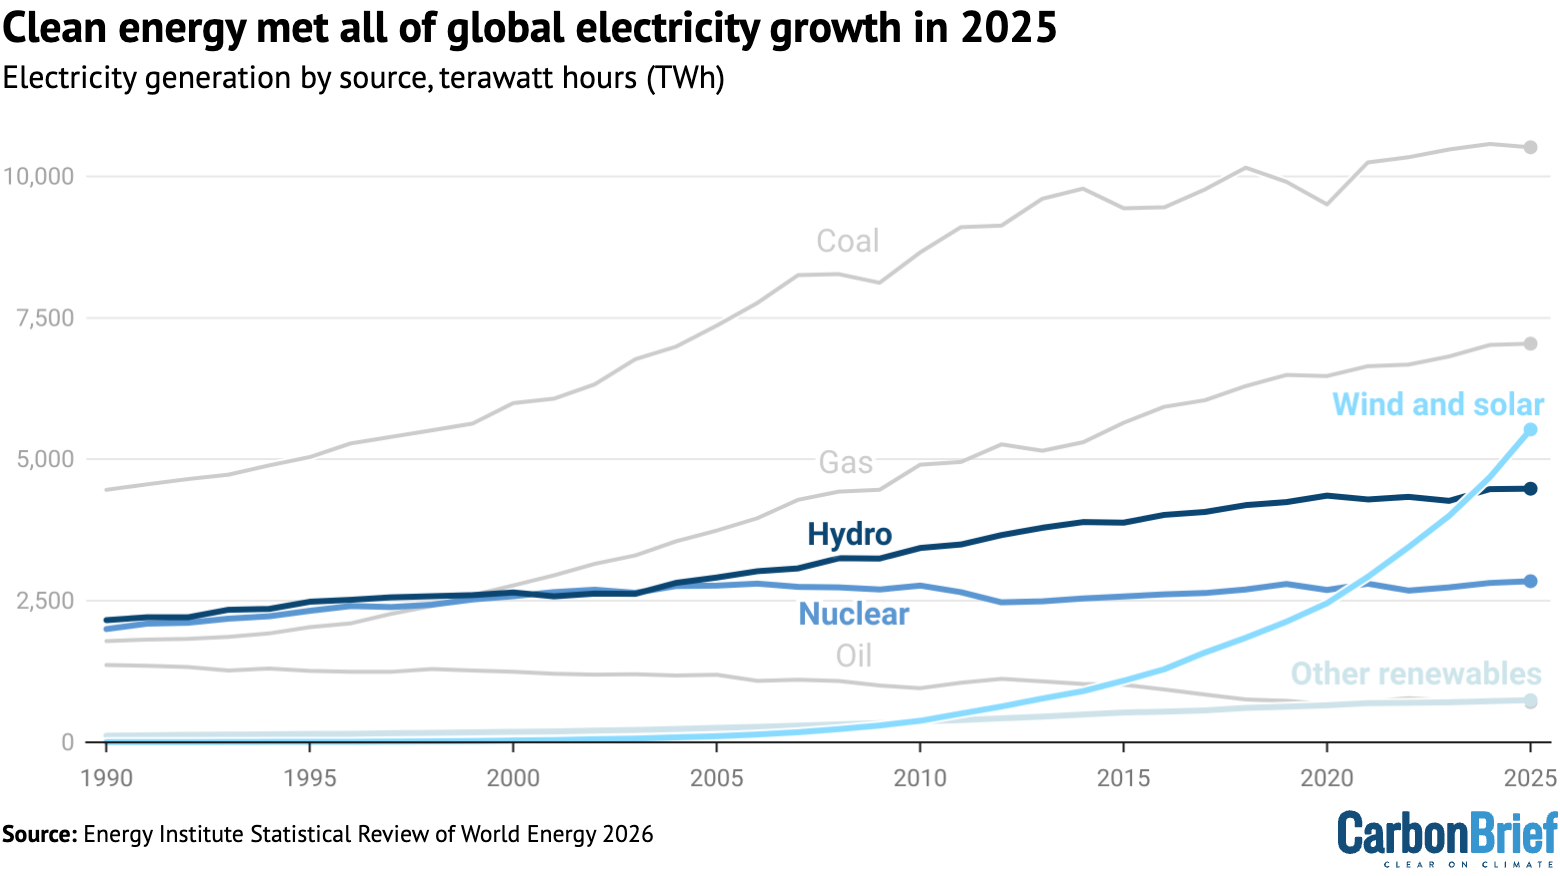
The review says that wind and solar power, when combined, grew by 18% in 2025, whereas there was a small decline in coal generation balanced by a small rise for gas.
Overall, it says that global electricity generation increased by some 940 terawatt hours (TWh, 3%), roughly three times the annual demand of the UK.
Separate figures, included in the review for the first time, show that data centres used 788TWh of electricity in 2025, up 130TWh on a year earlier.
This means that data centres accounted for 2% of global electricity demand.
China generates more power than the US, EU and India combined
The Energy Institute report says that the power sector is set to play an increasingly important role, because it is growing more quickly than other parts of the global energy system.
There is also increasing political attention on the idea of using expanded clean-power supplies to rapidly electrify other parts of the economy, particularly heat and transport.
The COP31 presidency has called for countries to back a global goal for 35% of “final” energy to come from electricity by 2035, against a global average today of around 22%.
China is well ahead of the global average, with electricity making up 30% of its final energy supplies in 2025. It recently adopted a 35% by 2030 target for electrification.
One reason it has been able to do this is the huge scale of its electricity system. Indeed, China now generates more electricity than the US, EU and India combined, as shown in the figure below.
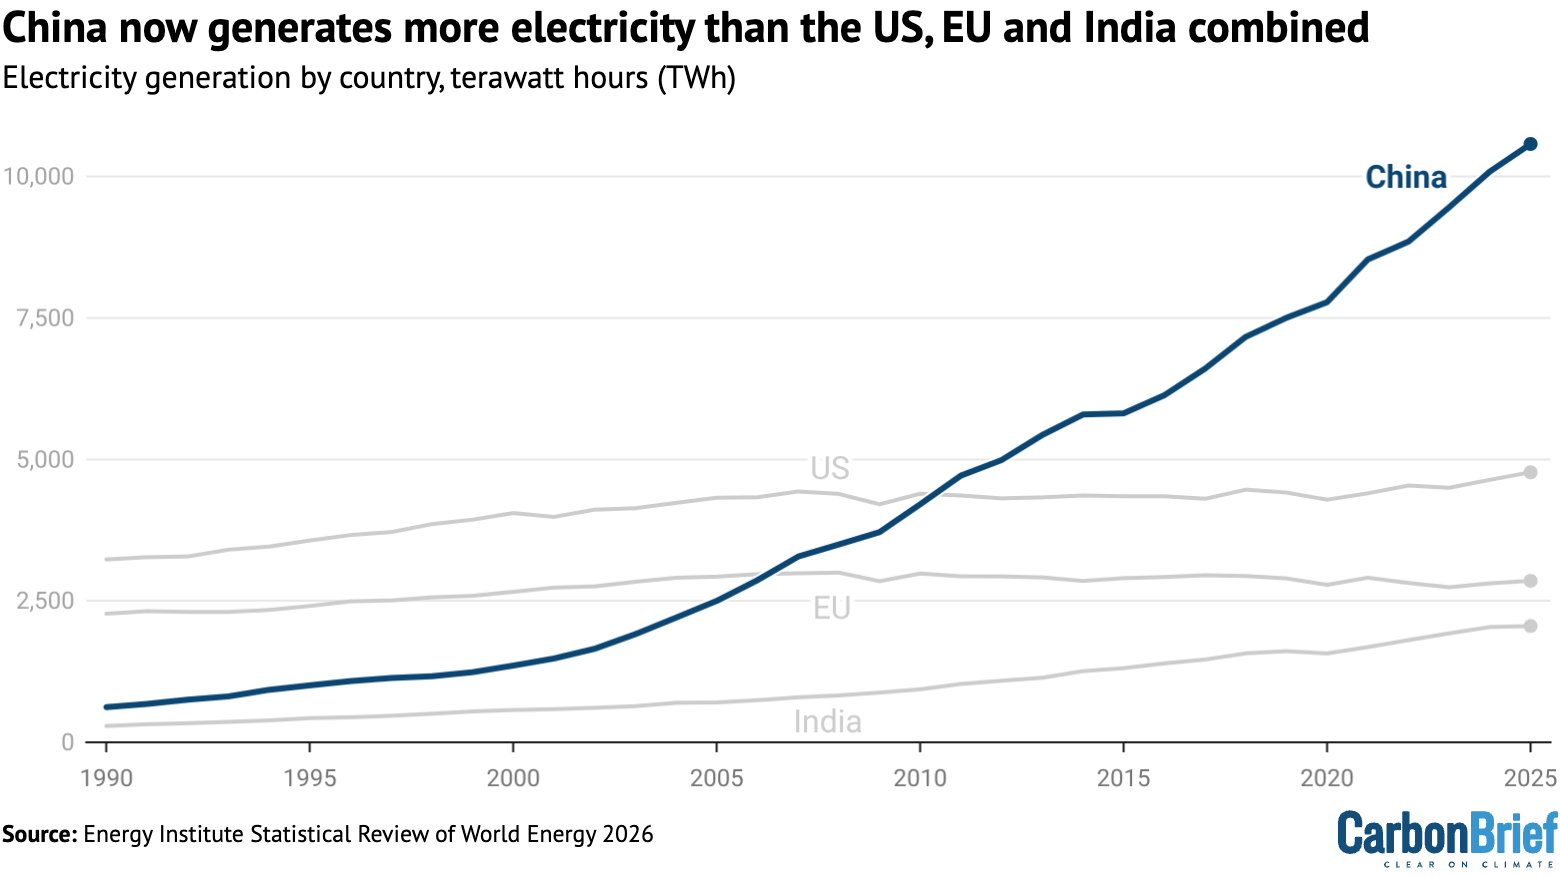
While much of the rise in China’s electricity has historically come from coal-fired generation, there was enough growth of clean-power sources to push coal down last year.