Analysis: China’s CO2 emissions see first quarterly fall since post-lockdown surge
Lauri Myllyvirta
11.25.21Lauri Myllyvirta
25.11.2021 | 7:00amChina’s carbon dioxide (CO2) emissions fell by around 0.5% in the third quarter of 2021 compared to a year earlier, new analysis for Carbon Brief shows.
The year-on-year decline in emissions from fossil fuels and cement is a marked turnaround from the approximately 9% increase in the first half of the year, when the Chinese economy surged back from the coronavirus pandemic on a wave of stimulus spending.
Moreover, the declining trend in the third quarter steepened into September – the first month during which monthly emissions returned to 2019 levels – and looks set to deepen further in October, based on preliminary data.
This analysis is based on official figures for the domestic production, import and export of fossil fuels and cement, as well as commercial data on changes in stocks of stored fuel. In the case of coal and natural gas, the growth rates are adjusted to match officially reported quarterly growth rates, when available.
It is the latest in a series of quarterly Carbon Brief updates, with the previous one having reported early signs of China’s emissions growth cooling in the second quarter of 2021.
Looking ahead, the drop in emissions could mark a turning point and an early peak in China’s emissions total, years ahead of its target to peak before 2030.
Alternatively, if the Chinese government injects further construction stimulus to boost its economy, emissions could rebound once again, before peaking later this decade.
Quarterly fall
China’s CO2 emissions rose sharply in late 2020 and early 2021, as construction and heavy industrial activity led the recovery from the initial Covid-19 lockdowns.
As a result, CO2 emissions in the last quarter of 2020 and the first quarter of 2021 saw the largest year-on-year increases in a decade. The increase in China’s emissions is also likely to result in global aggregated emissions rebounding close to pre-pandemic levels in 2021.
This backdrop makes the quarterly year-on-year fall in the most recent three months of data for China’s emissions look particularly stark, as shown in the chart below.
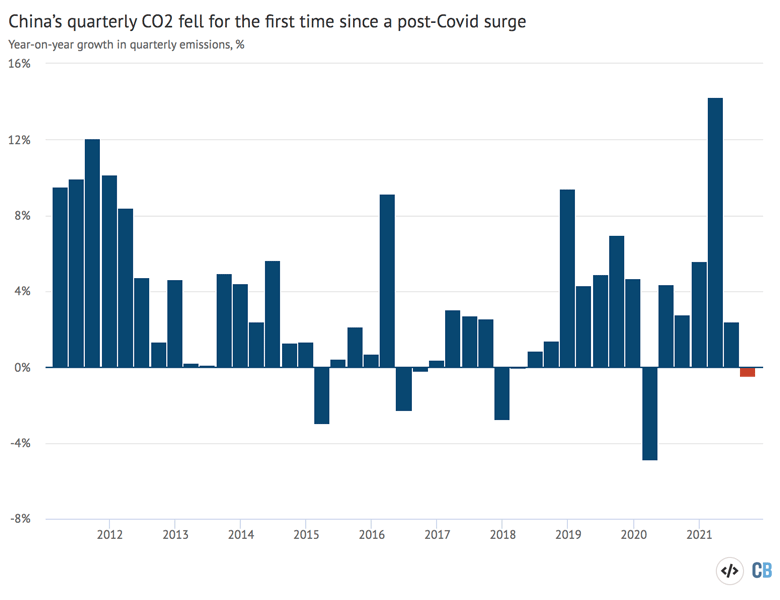
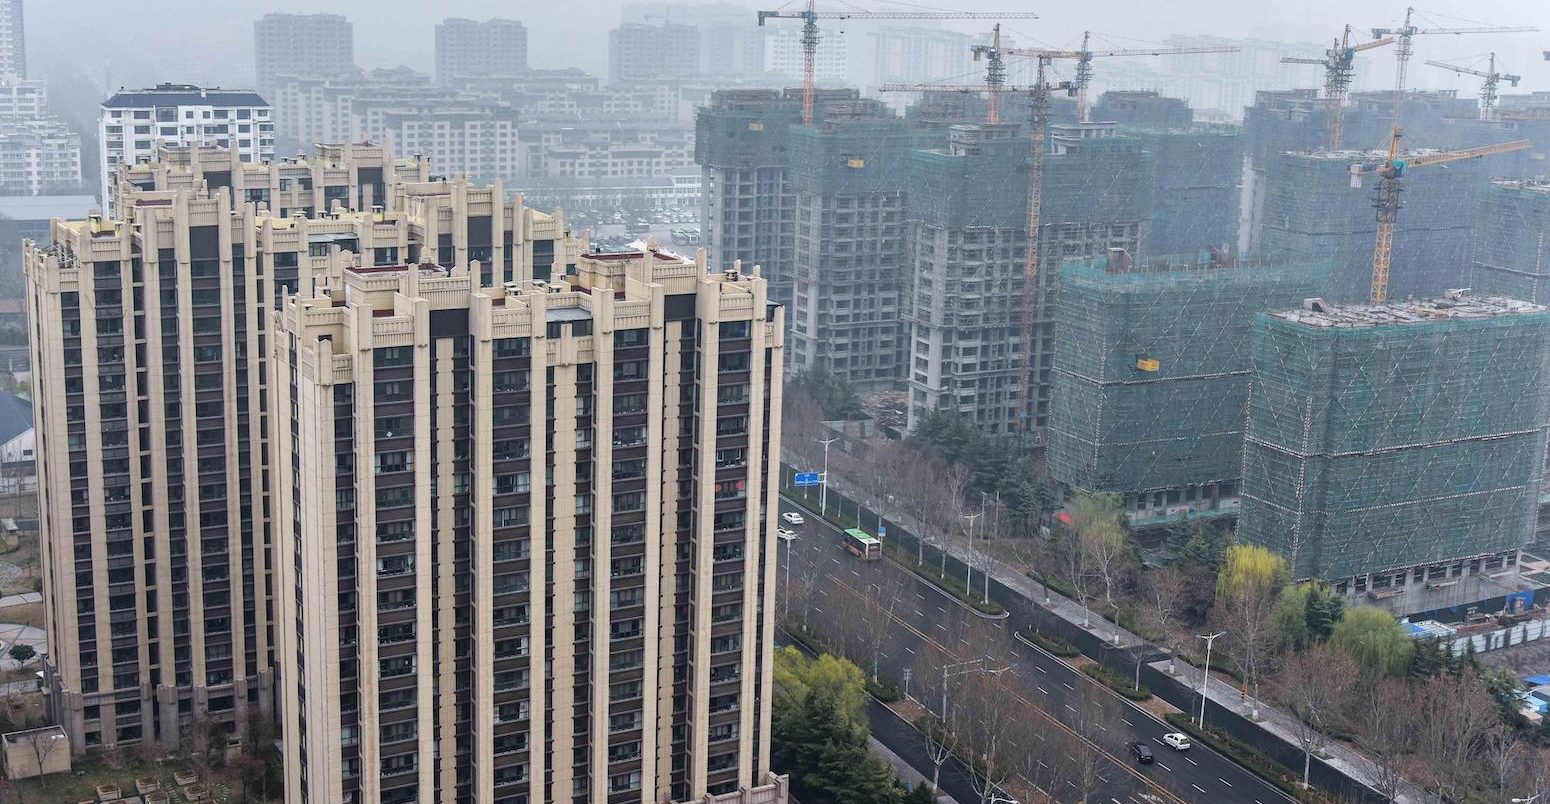
The emissions fell due to two reasons: a dramatic drop in demand for construction materials precipitated by the real estate slump and the ongoing coal crunch. Sky-high coal prices affect industrial users directly, as they purchase coal on the market, while industrial electricity demand has also been affected due to electricity rationing.
Last spring, the government started to tighten credit to the real-estate sector, a key driver of economic growth after Covid-19, but also the main driver of increases in debt and emissions. Tamping down on real estate-driven economic expansion is in line with Chinese leader Xi Jinping’s repeated statements that “apartments are for living in, not for speculation”, and his calls for “high-quality economic growth”. Cooling down real-estate expansion therefore appears likely to be a long-term economic policy theme.
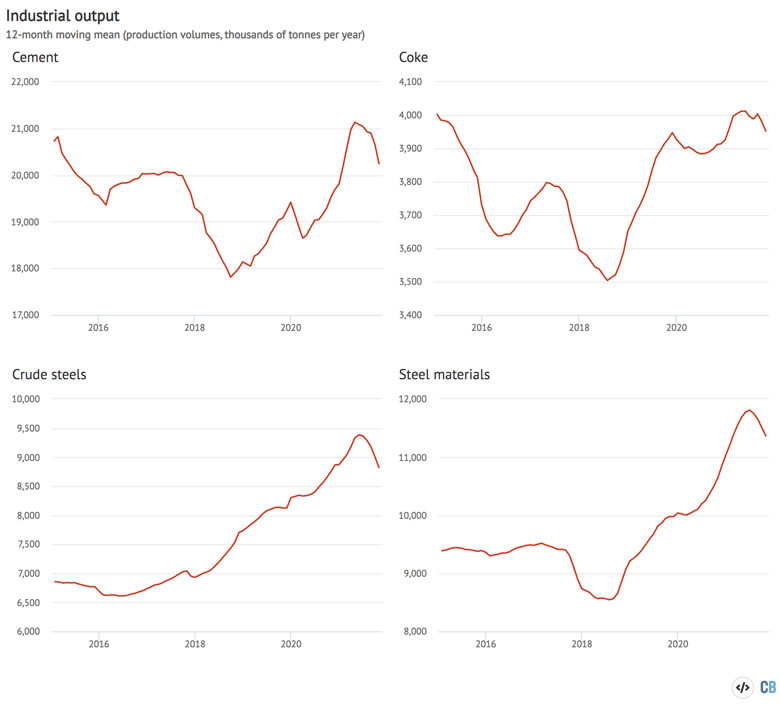
The falling real-estate volumes are heavily affecting upstream industries. As financial distress spread through the sector, construction activity slowed down, resulting in steel and cement output beginning to fall rapidly from July, as shown in the chart below.
Steel and cement are the two largest CO2 emitting sectors in China after coal power and they had seen blistering 12% and 14% increases in the first half of the year, respectively.
Starting from September, China’s coal consumption has also been affected by record-high coal prices and supply shortage. Electricity prices are still regulated in China, while coal prices are determined on the market.
The government kept electricity prices paid to coal power plants low while fuel costs were rising rapidly, leading to a shortfall in coal purchases and supply as it became unprofitable for plants to operate. This has led to electricity rationing, particularly to energy-intensive industries, which is also limiting coal demand.
In response to the crisis, the government has been urging miners to ramp up output to plug the gap between supply and demand. This has caused a widespread – but inaccurate – perception that coal demand is increasing at the moment, whereas data shows the opposite to be true.
Although coal consumption is in a declining trend, demand in the third quarter was still some 2% higher than a year earlier, with the consumption of coking coal having fallen 8% and thermal coal increasing 3%, propelled by power generation.
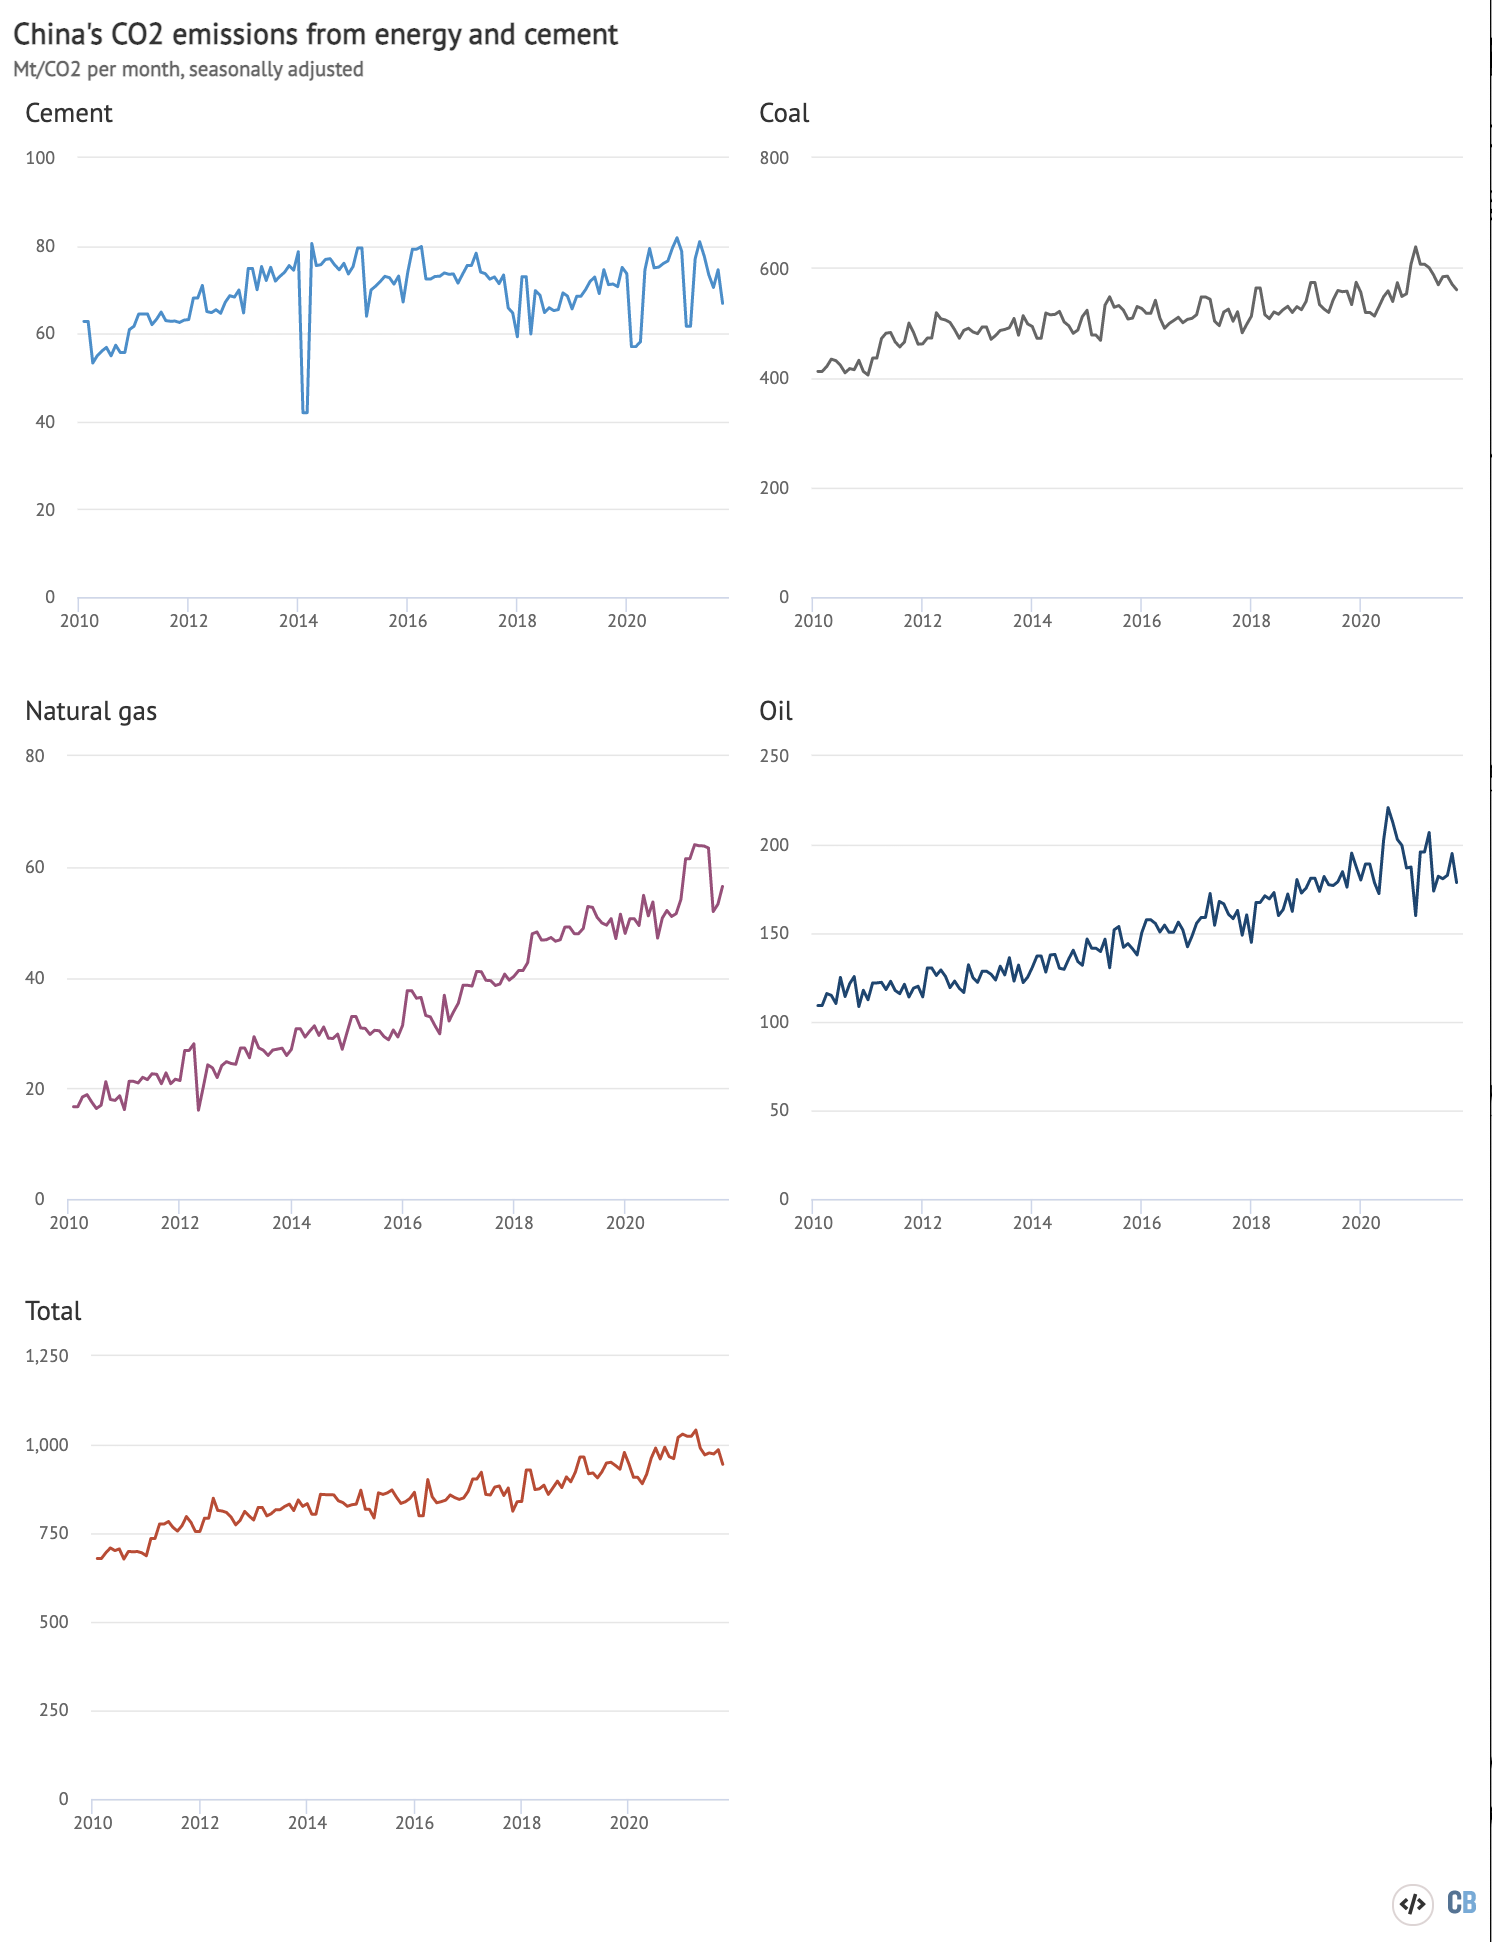
Despite the small increase from coal, China’s quarterly CO2 emissions overall fell regardless, due to cement output falling by 8% and oil consumption by 10% compared with the same period last year.
Oil consumption for the petrochemical industry and freight fell sharply, while gasoline and fossil gas demand continued to grow, albeit at a slower pace.
Electricity demand from households and retail remained strong, growing at 11% and 16%, respectively, and indicating that consumption is recovering.
Emissions continue to fall in October
The slowdown in China’s emissions became steeper during the third quarter, with CO2 output falling an estimated 2.3% in September. Early data for October suggests this trend is deepening, with crude steel output down 23% and cement output 17% compared with the same period a year earlier.
Growth in power generation also continued to slow down, from 5% in September to 3% in October. Without a drop in hydropower generation related to annual variation, fossil power generation would have fallen as well, as total output from wind, solar and nuclear increased by a combined 17%. Manufacturing industry power demand gained just 1%, showing the impact of the real estate slowdown and power rationing.
Real-estate lending continued to contract. There are some signs that policy is being eased now in November, but weekly reports of steel industry operating rates are yet to show any sign of bottoming out, as the chart below shows.
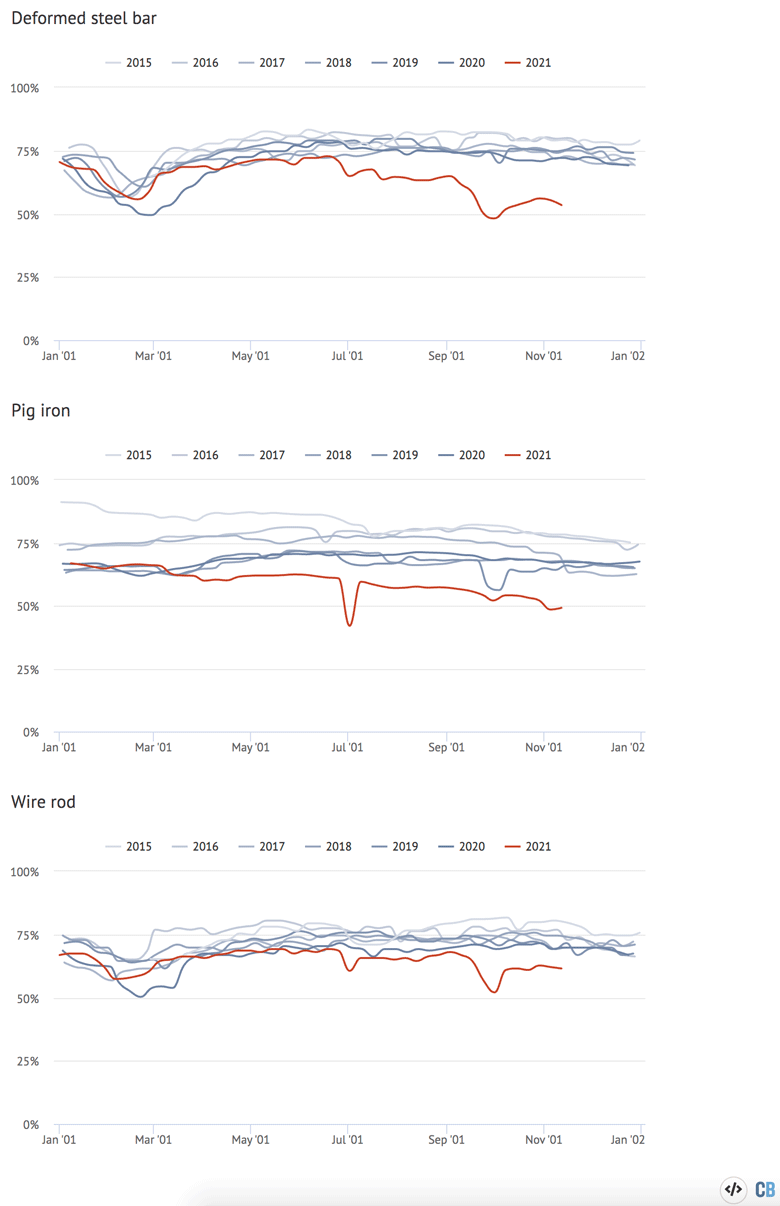
Operating rates were also falling steadily before the current slowdown – from more than 90% until 2014 to less than 70% since 2018 in the case of blast furnaces. This shows the buildup of excess capacity in the sector due to continued investment in new, largely coal-based, steelmaking capacity.
Clean energy and electric vehicles pick up pace
The effect of new policies and policy expectations is showing clearly in investment in the flagship low-carbon technologies solar, nuclear, wind and electric vehicles. Accelerated deployment of these technologies will be a key component of delivering China’s carbon goals.
The chart below shows that some 26 gigawatts (GW) of solar and 16GW of wind were installed in the first nine months of the year, up 37% and 33% on a year earlier, based on figures from the National Energy Administration that tend to be incomplete, but indicate the trend. Investment in solar power increased 27% and nuclear by 52%.
Increases in capacity additions for wind and solar are in part driven by grid connection deadlines, after which projects will receive lower electricity tariffs.
This year, 55–65GW of solar and 50GW of wind are expected in total, in line with industry expectations that well over 100GW per year will be needed to meet climate targets. China’s target for 25% of its total energy consumption in 2030 to come from non-fossil sources, in particular, requires accelerating wind and solar installations.
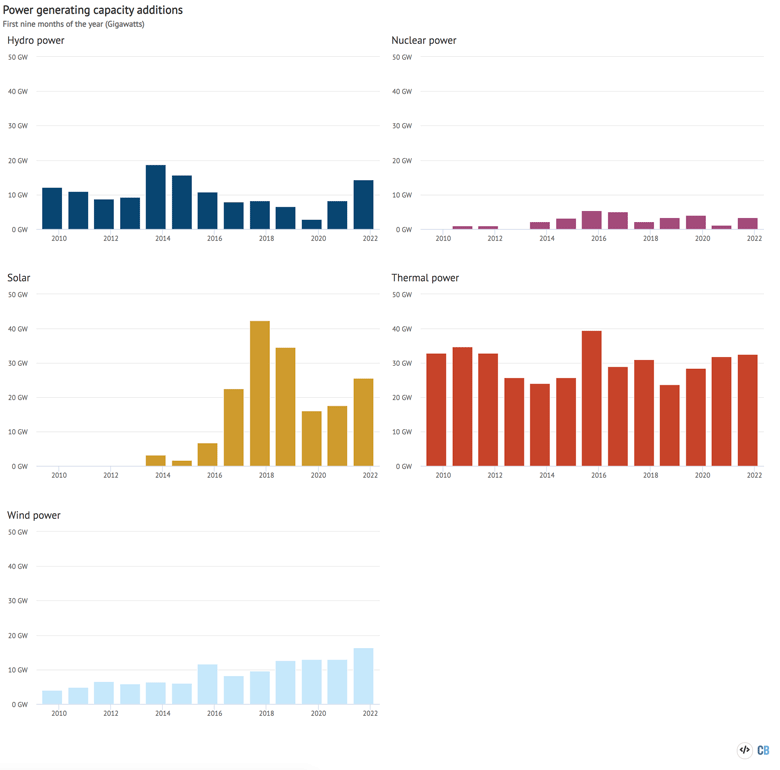
However, reported additions of new fossil power capacity also increased very slightly and reported investment in thermal power increased by 12%, showing that investments in fossil capacity are not yet being scaled down.
The State Council recently announced a new state-backed lending facility for coal projects, including mining, preparation, use in industry, heating and power, as well as “comprehensive utilisation of coal”, which includes coal-to-chemicals, coal-to-gas and coal-to-oil projects.
The production of electric vehicles is also surging, with output increasing 160% year-on-year in the first 10 months of 2021 and a record 2.7m vehicles produced. This represents a record market share of 13% of all vehicles produced in 2021 to date, increasing to 17% in October. Over the past 12 months, a record-breaking number of more than 3m electric vehicles was produced, as shown in the chart below left.
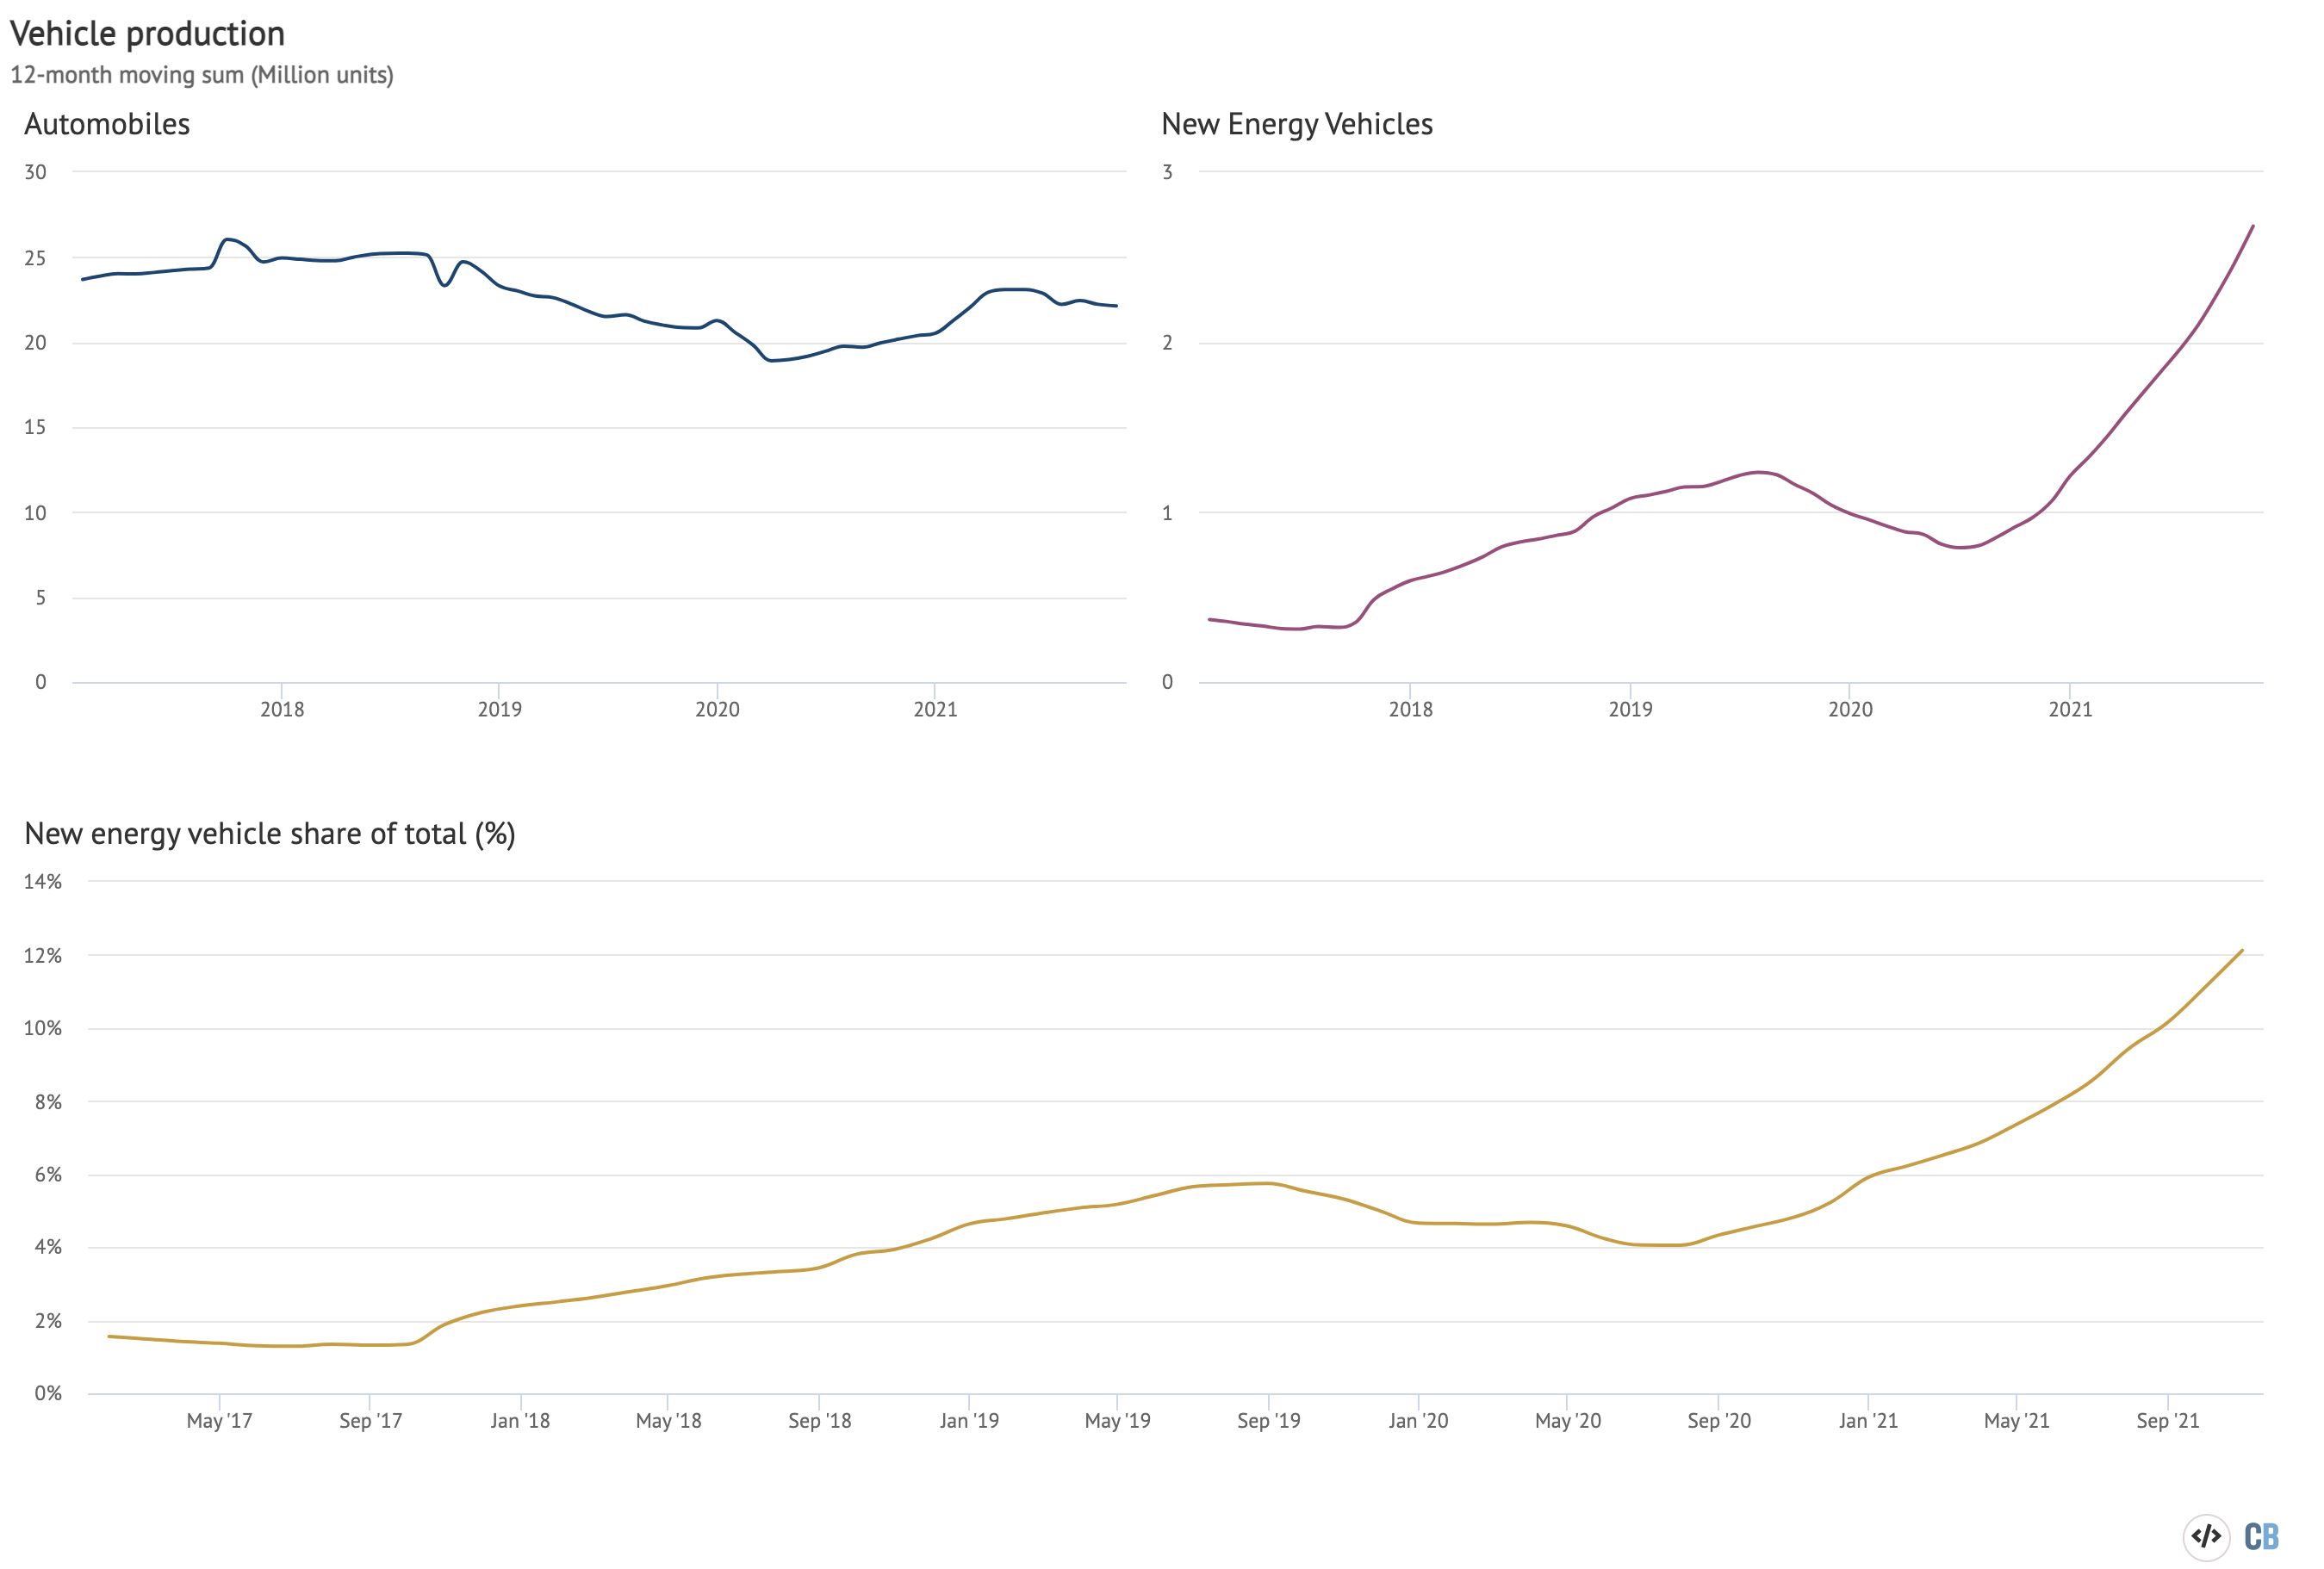
The month of October saw electric vehicle production increase 130% year-on-year, whereas the total number of vehicles produced fell by 8% over the same period.
How is the emissions downturn affecting climate policy?
China’s climate targets of peaking CO2 emissions before 2030 and reaching carbon neutrality before 2060 leave space for emissions increases until late this decade and for a very wide range of possible emissions trajectories over the decade that follows.
In July, China’s climate envoy Xie Zhenhua said that the Central Committee and State Council top-level policy documents on CO2 peaking and carbon neutrality would specify a timetable and a roadmap for carbon peaking.
However, in September, in the depth of the coal and electricity crisis, premier Li Keqiang said “in light of the current situation, we must deepen the calculations and analysis, and…propose a timetable and roadmap for peaking emissions”, indicating that the government was taking a timeout.
Accordingly, the top-level climate policy documents and China’s updated climate pledge (formally, its nationally determined contribution), published just before the Glasgow COP26 climate summit, were very light on targets and did not specify the emissions peaking timeline or peaking level.
The hesitancy to commit to a specific emissions pathway or ceiling for this decade might seem like a paradoxical result from the current downturn in emissions. However, the real-estate slump and coal crisis have increased the uncertainty over China’s economic outlook.
The big question is whether the economic slowdown will prompt another round of construction and infrastructure stimulus that would drive up emissions once more, before the targeted peak late this decade.
Furthermore, while the coal crisis was caused by ballooning coal consumption and price control policies, there is a widespread perception in China that the current coal crisis is the result of an overly ambitious shift to clean energy – rather than an over-reliance on coal and lack of progress in shifting away from it.
This perception could, some argue, make the leadership hesitant to highlight or strengthen climate targets until the crisis is fully resolved.
On the other hand, policies taken in response to the coal crisis are also supporting the economic and energy transition, by raising electricity prices for industrial users and incentivising clean electricity purchases.
The lack of firm targets for this decade meant that the Chinese delegation in Glasgow adopted a new line of communication when presenting the country’s climate actions, emphasising concrete action and implementation in favour of stronger targets.
The focus is questioning the value of other countries’ commitments, as well as the importance of targets, but also de-emphasising emissions outcomes in favour of “actions”.
The government’s action plan does indeed initiate a lot of actions – policies, regulation, targets and governance reforms in the energy, industry, transport and other sectors, incentivising a shift to clean energy and reductions in emissions.
The emissions slowdown and dramatic structural shift in the economy, together with accelerating investment in clean technologies, could lead to an early peak in emissions and overachievement of China’s targets.
The government is also emphasising [at 30:40] that earlier targets were exceeded and the Chinese delegation appears to have suggested to John Kerry, during bilateral talks, the possibility of China’s emissions having “already peaked”.
However, unless more specific targets are set, there is also the possibility of a rebound in emissions.
This puts the spotlight on the process agreed in Glasgow, where all countries agreed to “revisit and strengthen” their current 2030 emissions targets next year.
China’s sectoral implementation plans for steel, construction materials, power, industry and other sectors, currently under preparation, could also introduce more measurable targets.
-
Analysis: China’s CO2 emissions see first quarterly fall since post-lockdown surge