Analysis: The global coal fleet shrank for first time on record in 2020

Dr Christine Shearer
08.03.20Dr Christine Shearer
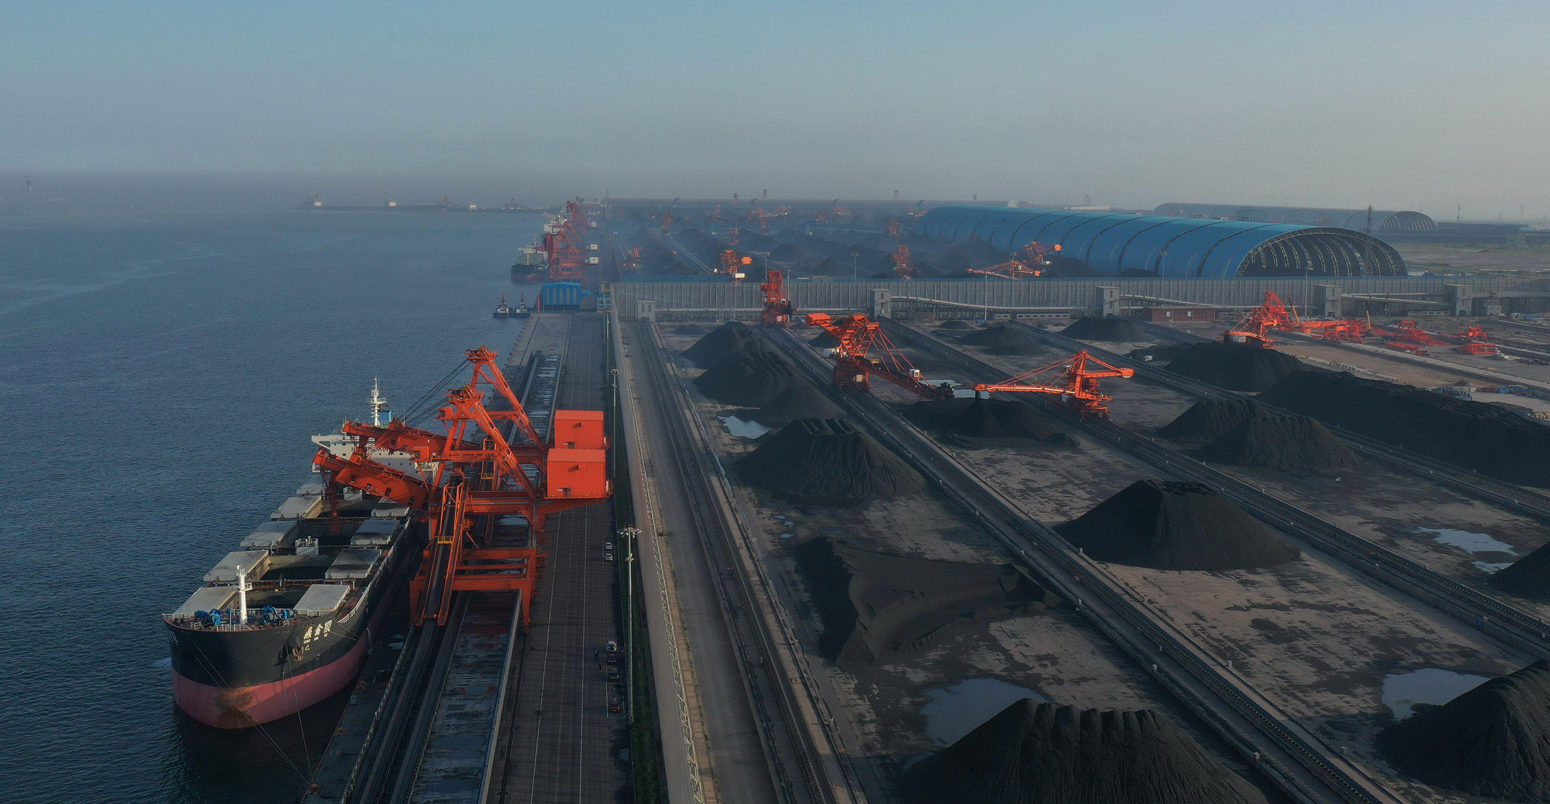
03.08.2020 | 1:01amThe world’s fleet of coal-fired power stations has got smaller for the first time on record, with more capacity retired in the first half of 2020 than the amount opened.
This is according to the latest Global Coal Plant Tracker (GCPT) results by Global Energy Monitor (GEM), which we completed last month and report for the first time here.
The 2.9 gigawatt (GW) decline in the first half (H1) of 2020 takes the global total down to 2,047GW. The fall – including a decline in India – was due to a combination of slowed commissioning due to the Covid-19 pandemic and record retirements in the EU from strengthened pollution regulations.
Nevertheless, our new figures show that 189.8GW of coal power capacity is still under construction globally and another 331.9GW is in planning. This runs counter to calls from UN secretary general António Guterres for a global moratorium on new coal plants after 2020.
New coal plant development in H1 2020 was predominantly concentrated in China, which has increased its coal proposals and permits, while much of the world has put coal plans on pause.
Outside China, operating coal power capacity already peaked in 2018 – a trend that looks to hold as planned retirements outside China exceed planned commissioning. These shifts mean China is for the first time now home to half the world’s operating coal fleet.
Despite the decline in the global coal fleet, meeting global climate goals requires a much more rapid reduction in coal power use, with generation falling by at least half this decade in pathways that limit warming to well-below 2C, and up to three-fourths for 1.5C.
First fall in 2020
This year has witnessed the first six-month period on record when more coal-fired capacity was retired than commissioned. From 1 January to 30 June, 18.3GW started operating and 21.2GW retired, leading to a net decline in the global coal fleet of 2.9GW, shown in the chart below.
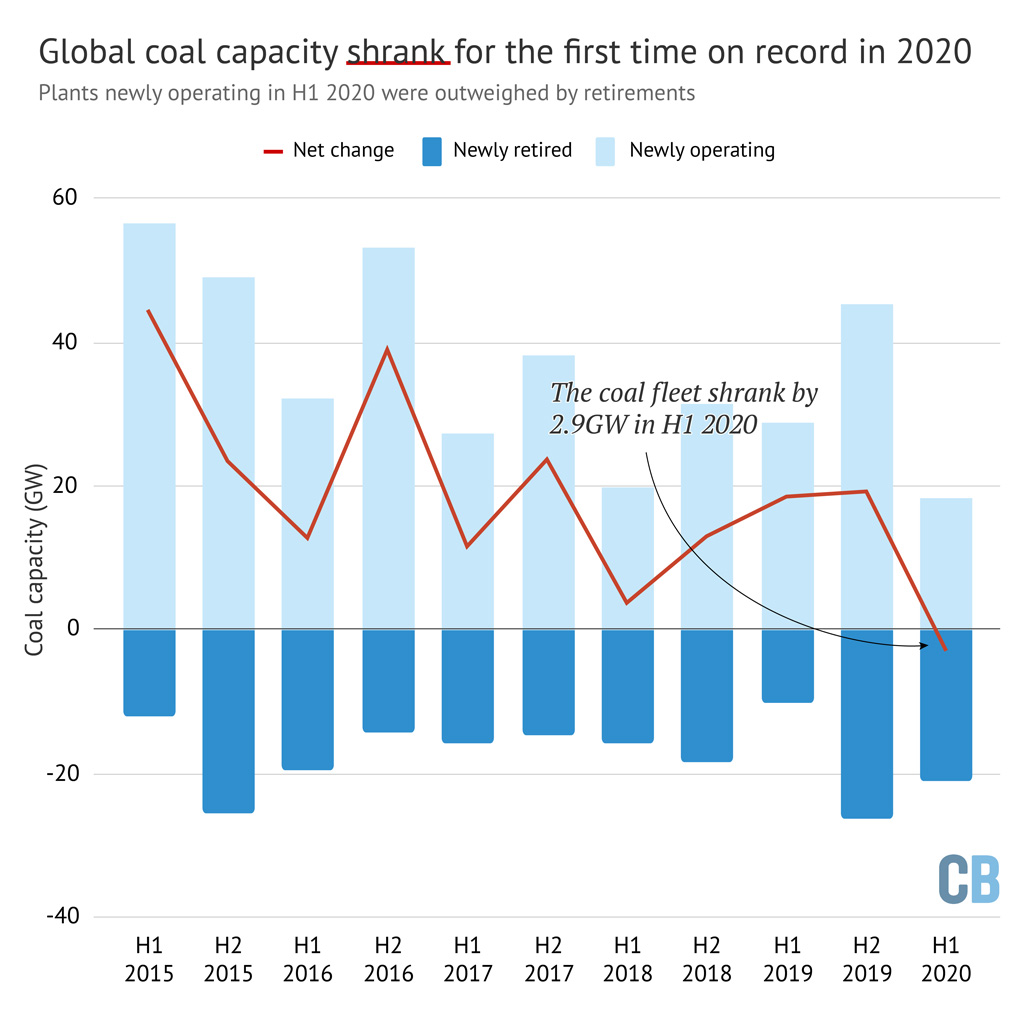
For comparison, the global coal fleet had grown by an average of 25GW every six months over the previous two decades, from 2000-2019.
Commissioning in 2020 was led by China (11.4GW) and Japan (1.8GW). Germany’s newly opened 1.1 GW Datteln coal plant will have to be retired as the country phases out coal by 2038.
In terms of retirements during H1 2020, the bulk were in the EU27 plus UK (-8.3GW) – discussed in more detail below – followed by the US (-5.4GW) and China (-1.7GW).
Whereas H1 2020 marked the first overall global decline (solid line in the chart below), coal power capacity has already been in decline since 2018 outside China (dotted line).
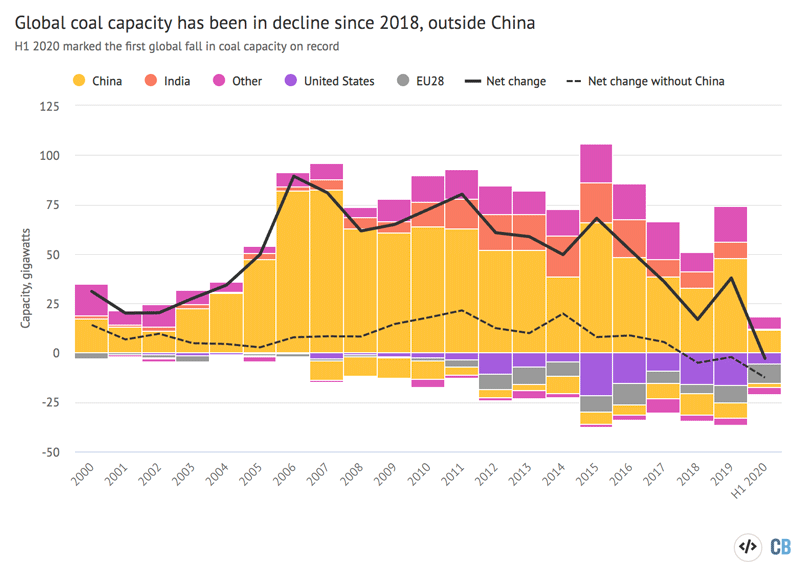
The net change in global coal power capacity (solid black line) between 2000 and H1 2020. Country-by-country additions (positive) and retirements (negative) are shown with coloured columns. Source: Global Coal Plant Tracker, July 2020. Chart by Carbon Brief using Highcharts.
This declining trend outside China is likely to hold: some 98.6GW of coal power is already marked for retirement through to 2024, exceeding the 91.3GW currently under construction. (The median construction time for coal plants outside China is five years.)
Drop driven by the EU
The decline in global coal power capacity was driven primarily by the EU and UK, which saw a 8.3GW net reduction in capacity in the first half of 2020. This is the largest half-year drop on record, with only 2016 seeing a larger net reduction of 8.7GW across 12 months (see chart below).
With another 6.0GW of coal closures scheduled for the second half of this year, the EU is on course to set a clear annual retirement record for the full year of 2020.
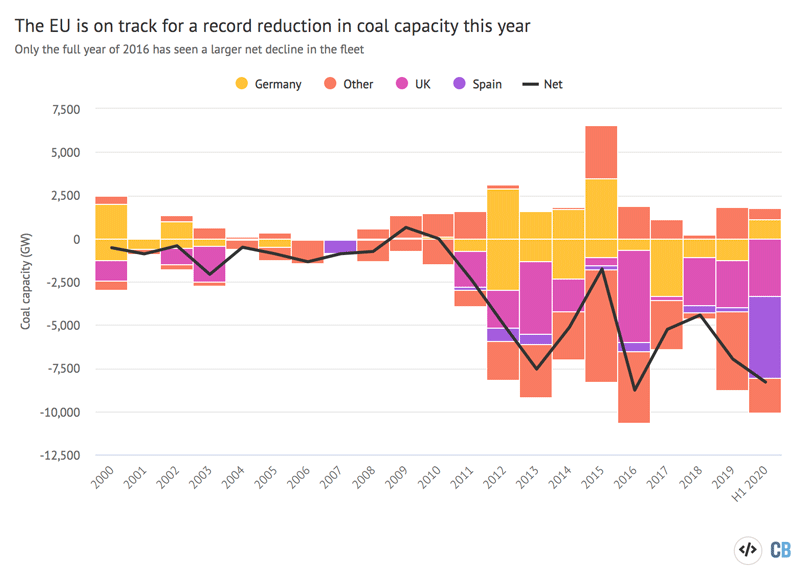
The net change in EU+UK coal power capacity (solid black line) between 2000 and H1 2020. Country-by-country additions (positive) and retirements (negative) are shown with coloured columns. Source: Global Coal Plant Tracker, July 2020. Chart by Carbon Brief using Highcharts.
Retirements in the EU+UK were driven by the rising price of EU carbon allowances and tightening pollution regulations, both of which have cut into the profitability of coal plants.
In H1 2020, EU27 coal use fell by 32%, as lower power demand from the Covid-19 pandemic primarily affected coal plants due to their higher operating costs.
Citing the declining profitability of its coal plants, power company EDP recently announced two coal plant closures in Portugal, putting the country on track to be coal-free by 2021 – two years ahead of schedule.
Altogether, 19 EU countries and the UK have committed to phase out coal power generation by 2030, with Germany targeting 2038. This leaves seven member states yet to agree to a phaseout: Spain, Poland, Czechia, Romania, Bulgaria, Slovenia and Croatia.
Radical reductions in Spain and the UK
While Spain has not yet committed to a coal phaseout, the country retired half its fleet in June 2020 (4.8 of 9.6GW), before the expiration of exemptions from EU pollution limits.
The retirements were preceded by a 58% annual drop in Spain’s coal power generation, from 8.0 terawatt-hours (TWh) in H1 2019 to 3.3TWh in H1 2020, shown in the chart below.
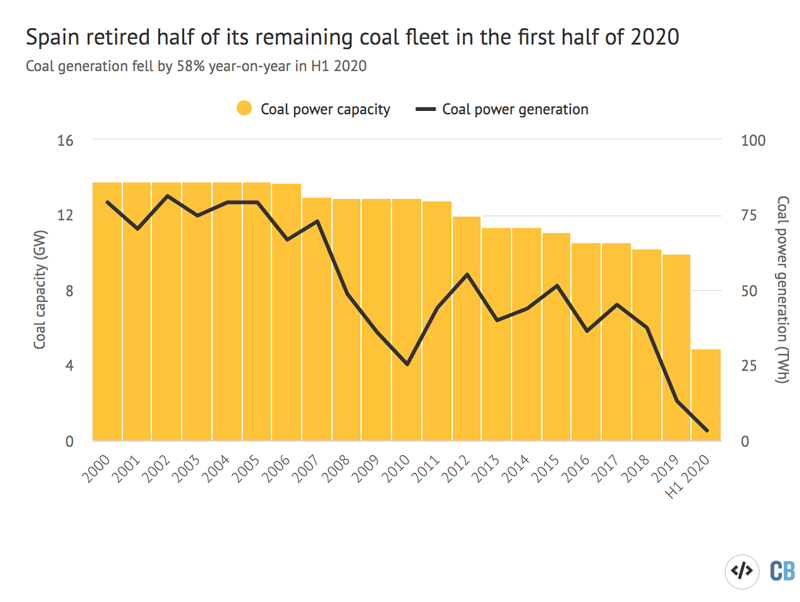
Total operating coal power capacity (columns, gigawatts, left axis) and coal power generation (red line, terawatt hours, right axis) in Spain. Source: Global Coal Plant Tracker, July 2020 (capacity), Ember Electricity Review January 2020 and July 2020 (power generation). Chart by Carbon Brief using Highcharts.
The UK also retired a significant chunk of its coal fleet in the first half of 2020, closing more than a third of its remaining plants (3.3 of 9.6GW, or 34%). At the same time, the British electricity grid was coal-free for more than two months.
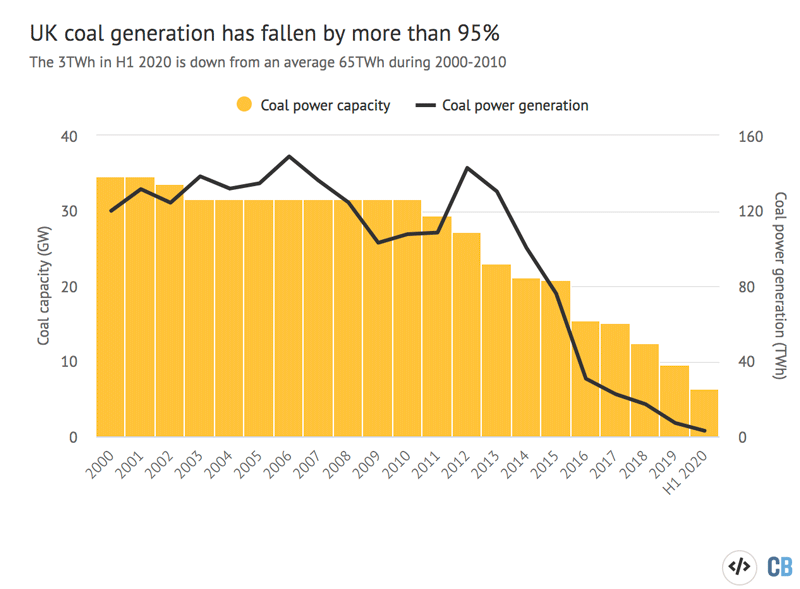
Total operating coal power capacity (columns, gigawatts, left axis) and coal power generation (red line, terawatt hours, right axis), in the UK. Source: Global Coal Plant Tracker, July 2020 (capacity), Ember Electricity Review January 2020 and July 2020 (power generation). Chart by Carbon Brief using Highcharts.
UK coal power generation has declined by more than 95% from an average of 65TWh every six months during 2000–2010 to just 3TWh in the first half of 2020, suggesting the country may well exit coal before its 2025 phaseout deadline.
Concentrated in China
The coal power industry continues to be concentrated in a handful of countries, with just ten comprising 90% of the pipeline for new coal plants and 86% of the operating fleet.
China alone is now home to half of all operating coal power capacity (50%), as well as half of capacity in the pipeline (48%), up from a 34% share of the global coal pipeline in mid-2018.
This concentration is shown in the table below, which lists the top 10 countries for new coal development (left hand column) and already-operating capacity (right).
| Country | Pipeline (GW) | Share | Country | Operating (GW) | Share |
|---|---|---|---|---|---|
| China | 252.2 | 48.4% | China | 1,022.9 | 50.0% |
| India | 64.8 | 12.4% | United States | 239.8 | 11.7% |
| Turkey | 33.7 | 6.5% | India | 228.2 | 11.1% |
| Indonesia | 31.3 | 6.0% | Japan | 48.3 | 2.4% |
| Vietnam | 29.7 | 5.7% | Germany | 45.4 | 2.2% |
| Bangladesh | 21.0 | 4.0% | Russia | 44.6 | 2.2% |
| Philippines | 12.1 | 2.3% | South Africa | 41.4 | 2.0% |
| Japan | 9.9 | 1.9% | South Korea | 36.4 | 1.8% |
| South Africa | 9.4 | 1.8% | Indonesia | 33.1 | 1.6% |
| Mongolia | 7.5 | 1.4% | Poland | 30.0 | 1.5% |
| Top 10 | 471.6 | 90.4% | Top 10 | 1,770.1 | 86.5% |
| Rest of the World | 50.1 | 9.6% | Rest of the World | 276.9 | 13.5% |
| Total | 521.7 | 100.0% | Total | 2047.0 | 100.0% |
China also dominated coal plant development in the first half of 2020, making up 90% of newly proposed capacity (53.2 of 59.4GW), 86% of new construction (12.8 of 15.0GW) and 62% of plant openings (11.4 of 18.3GW). This is shown in the figure, below.
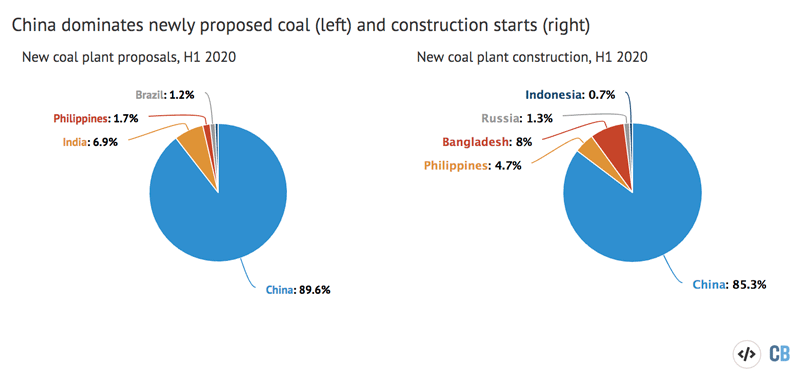
Left: Newly proposed coal plants during H1 2020, by country. Right: New coal construction starts in H1 2020, by country. Source: Global Coal Plant Tracker, July 2020. Chart by Carbon Brief using Highcharts.
From 1 January to 30 June 2020, Chinese provinces granted permits for 19.7GW of new coal capacity, the highest rate since the central government began restricting permitting in 2016.
Most of this activity has taken place since March, raising concerns that provinces are regarding coal plants as a form of post-covid economic stimulus to counter the financial slowdown. Central government moves to limit the surge have so far lacked teeth.
Analysis by the University of Maryland warns the continuing build-out of large amounts of coal power will exacerbate China’s overcapacity crisis, lowering the average utilisation rate for its coal plants from below 50% today to below 45% by 2025, with negative consequences for profitability.
Slowdown outside China
Outside China, plans for new coal development radically slowed in 2020, with fresh proposals and construction starts occurring in just seven countries. (These were India, the Philippines, Indonesia, Bangladesh, Turkey, Russia and Brazil, as shown in the pie charts above.)
India has been reducing its share of global coal power development, from 17% of the world pipeline in mid-2018 to 12% in mid-2020. The country also had no new construction in H1 2020 and shrank its coal fleet by 0.3GW – an unthinkable prospect just a few years ago.
In southeast Asia – regarded as one of the biggest growth markets for coal – only 1GW of coal power was newly proposed and 0.8GW started construction in H1 2020. This is 70% lower than the average 2.9GW of new proposals and 2.7GW of new construction every six months in the region since 2015.
The decline in southeast Asia comes as two of the region’s largest financial backers of new coal plants – Japan and South Korea – face continued public pressure to end their support of the technology.
So far, the governments have instead opted for tightened restrictions, although South Korea lawmakers will soon be deciding on a set of bills that would end the country’s public support for coal projects abroad. The growing restrictions have made coal plant financing increasingly difficult to secure and Chinese banks the lenders of last resort.
In south Asia, Bangladesh’s state minister for power recently announced that the country may restrict future coal plant additions to just three coal power plants that are under construction: Matarbari, Rampal, and Payra. This would effectively cancel the remaining 17.9GW of planned coal power.
In June 2020, Pakistan canceled plans for the 0.7GW Port Qasim power station, as the country deals with economic problems at two of its recently commissioned coal plants, financed by Chinese firms.
Notably, some of the world’s largest coal plant proposals were called off or scaled down in 2020, suggesting coal “megaprojects” face diminishing prospects as alternative power sources cut into their potential operating hours and profitability.
In February 2020, for example, Egypt’s ministry of electricity said it would postpone construction of the 6.6GW Hamrawein coal plant to launch a renewable energy project instead. With the decision, Egypt has shelved or canceled all 15.2GW of new coal power it had previously planned. Russia also scaled down plans for its proposed Erkovetskaya coal plant, from 8.0GW in 2013 to 1.0GW.
Coal and climate goals
Despite the decline in commissioning and development, global coal use – and its associated CO2 release – is expected to fall only very slowly over the next decade. Yet emissions from coal use need to plummet by 2030 in pathways that meet the goals of the Paris Agreement.
Looking specifically at the power sector, coal use falls roughly in half by 2030 (53%) in pathways that limit warming to well-below 2C and by three-quarters (73%) in those that keep warming below 1.5C, according to GEM’s analysis of pathways considered by the Intergovernmental Panel on Climate Change (IPCC) special report on 1.5C (SR15).
These figures are for scenarios with “no or low overshoot” of the temperature target and no carbon capture, utilisation and storage (CCUS) for coal plants, since few commercial coal plants have or are planning to deploy the technology, making widespread adoption over the next decade unlikely.
The figures are similar to those in recent analysis by Carbon Brief, which found CO2 emissions from all uses of coal – both power and industrial – fall by up to 80% below current levels in 2030 in 1.5C pathways, and by 42-70% in well-below 2C scenarios.
Even excluding the pipeline of new coal developments, there is already far more than enough coal capacity to breach these climate-compliant pathways.
The figure below shows the amount of coal generation implied by the IPCC scenarios (black lines) against an estimate of the output from existing plants. This estimate assumes coal plants operate for 40 years before closure and run at a 51% “load factor”, matching the current global average.
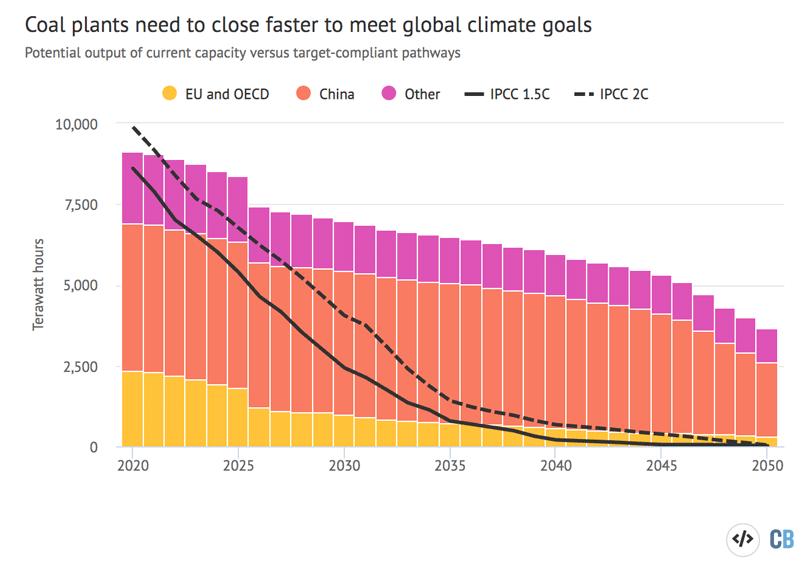
Global coal power generation, between 2020 and 2050, in pathways that limit warming to 1.5C (black line) or well-below 2C (dashed line). The coloured columns show estimated global output of existing plants, broken down by region, assuming a 40-year lifetime and 51% load factor, which were the averages in 2019. Plants already 40 years or older are assumed to operate for five more years. Source: Global Coal Plant Tracker, July 2020. Chart by Carbon Brief using Highcharts.
The chart above shows that Paris-compliant pathways for global coal use requires that existing coal plants close much sooner than recent averages and/or operate far below their installed capacity until they retire. This is before accounting for new coal plants in the pipeline.
Climate Analytics, the Climate NGO, argues that wealthier OECD and EU nations (yellow columns in the chart above) should phase out their coal fleets by 2030, given that these countries have more resources to make a rapid transition to clean energy.
The Powering Past Coal Alliance (PPCA) estimates that 58% of EU and OECD countries will be coal-free by 2030. The US – home to 13% of global capacity, which is second only to China – is notably not on this list.
Japan is also not among the OECD countries planning a coal phaseout. While the Japanese government recently announced plans for the retirement of 100 “inefficient” coal-fired units by 2030, analysis by Japan-based Kiko Network concludes the plan could leave more than 35GW of coal power operating in 2030. (Carbon Brief analysis reached a similar conclusion.)
For China, recent research suggests it would be cheaper to rapidly build up renewables than to continue expanding coal capacity. Another study found that the cost-optimal path to limit stranded assets in China’s coal sector was an immediate moratorium on new construction, a 20- to 30-year limit on coal-plant lifespans, and a phased reduction in the utilisation rates of remaining capacity.
Countries around the world are moving to stimulate their economies after the coronavirus pandemic. In that context, recovery efforts could prioritize replacing coal with clean energy, as recent analysis led by thinktank CarbonTracker suggests it is already cheaper to build new renewable power than to continue operating 60% of the global coal fleet, rising to 100% of the coal fleet by 2030.
The Global Coal Plant Tracker (GCPT) consists of an online map, summary statistics and a wiki page for the power plants. Carbon Brief uses the data from the tracker to produce its own global coal plant map and timeline. The GCPT is an online database developed by Global Energy Monitor, which maps and describes every operating coal-fired generating unit, every new unit proposed since 2010, and every unit retired since the year 2000 (30MW and larger). Collaborators on the database include CAN Europe, Centre for Research on Energy and Clean Air, Europe Beyond Coal, GreenID, Greenpeace, Kiko Network, Philippine Movement for Climate Justice, Sierra Club and Yayasan Indonesia Cerah.
-
Analysis: The global coal fleet shrank for first time on record in 2020
-
Guest post: 2020 marks first ever decline in global coal plant fleet