MENU

Social Channels

SEARCH ARCHIVE

  • Type

  • Topic

  • Sort

Shanghai's skyline in a sea of clouds
Shanghai's skyline in a sea of clouds. Credit: zorazhuang/E+/Getty Images.
CLIMATE SENSITIVITY
31 October 2016 16:00

Clouds dampened warming since 1980s, study shows

Robert McSweeney

10.31.16

Robert McSweeney

31.10.2016 | 4:00pm
Climate sensitivityClouds dampened warming since 1980s, study shows

A new study helps unravel one of the biggest uncertainties for scientists making climate change projections – how clouds will be affected as the Earth’s warms up.

Clouds can have both a warming and cooling effect on the Earth. They insulate the Earth’s surface like a blanket, while simultaneously cooling it by reflecting away energy from the sun.

Overall, scientists expect that changes to clouds will amplify human-caused warming in the long-term. But a new study, published in Nature Geoscience, shows that they can have an important short-term cooling impact.

Previous research using satellite data has identified an increase in low-level clouds in the tropics over the eastern Pacific Ocean since the 1980s. The authors of the new study say this has likely reduced the pace of recent warming – and they’ve worked out why it’s happening.

But the effect will be short-lived, the researchers tell Carbon Brief, meaning global warming is likely to accelerate again when it reverses.

Uneven warming

The reason for the increasing cloud cover in the tropics lies in the uneven way that the Earth warms up in response to human-caused greenhouse gas emissions, the study says.

In the tropical Pacific Ocean, sea surface temperatures (SSTs) have warmed more quickly in the west than the east in recent decades. As you can see from the blue shading in the left-hand map below, parts of the eastern Pacific have even cooled slightly between 1980 and 2005.

CAPTION: Left: Change in average surface temperature (in degrees C per 30 years) over 1980-2005; shading shows warming (red) and cooling (blue). Right: Change in low-level cloud cover (in % per 30 years) over 1980-2005; shading shows increases (red) and decreases (blue). Source: Zhou et al. (2016)

Left: Change in average surface temperature (in degrees C per 30 years) over 1980-2005; shading shows warming (red) and cooling (blue). Right: Change in low-level cloud cover (in % per 30 years) over 1980-2005; shading shows increases (red) and decreases (blue). Source: Zhou et al. (2016)

For the western Pacific, the warm SSTs are in line with the warm atmosphere above. When air rises from the ocean surface up through the atmosphere, the temperature changes are gentle. These areas tend to generate deep, convective clouds that produce lots of rainfall.

You can see this on the left-hand side of the figure below, which comes from an accompanying News & Views article.

The change in temperature as the air rises is illustrated by the vertical lines. The black and red lines depict the temperature profiles through the atmosphere before and after human-caused warming, respectively.

Illustration of impact of uneven warming in the Pacific Ocean on cloud cover in the tropics. The vertical lines show the temperature changes through the atmosphere (shows before (black) and after (red) impact of human-caused warming). Underlying map shows change in average temperature over 1980-2005 (in degrees C per year). Source: Mauritsen (2016)

Illustration of impact of uneven warming in the Pacific Ocean on cloud cover in the tropics. The vertical lines show the temperature changes through the atmosphere (shows before (black) and after (red) impact of human-caused warming). Underlying map shows change in average temperature over 1980-2005 (in degrees C per year). Source: Mauritsen (2016)

In the east Pacific, the cool SSTs means there is a mismatch with the warm atmosphere above. This means that rising air hits an abrupt change in temperature at about 1-2km above the Earth’s surface – shown by the kink in the right-hand vertical lines in the figure.

This temperature difference acts as a barrier in the atmosphere, stopping dry air above from mixing with the moist air below. So the moist air stays put and condenses to form low-level “stratocumulus” clouds.

The increasing temperature difference between the east and west Pacific strengthens this effect, meaning more low-level cloud is forming now than it was in the 1980s. You can see this from the right-hand map of the earlier figure – the patches of red in the east Pacific show where cloud cover has increased.

According to the new study’s calculations, this increase in low-level cloud has dampened the pace of recent warming, outweighing the additional warming impact from changes to clouds elsewhere.

While the impact has lasted several decades, it’s not expected to continue in the long-term, says Prof Joel Norris, professor of climate and atmospheric sciences at the Scripps Institution of Oceanography, who wasn’t involved in the study. He tells Carbon Brief:

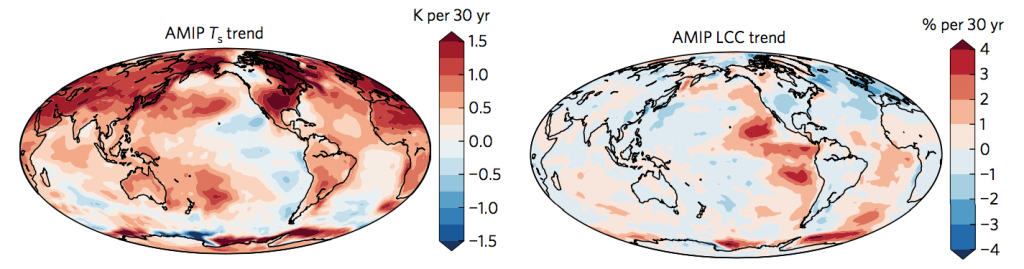
“I expect it will reverse at some point, and the eastern Pacific will warm and clouds will decrease. Based on this study, this will likely increase the rate of global warming when it occurs.”

In fact, previous research by Norris shows that during 1952-1981 the eastern Pacific warmed and saw decrease in cloud cover – the opposite of what the researchers have observed since 1980. This suggests “we may be at the point of another turn of the cycle,” Norris says.

Climate sensitivity

The findings have important implications for what scientists call “climate sensitivity” – a measure of how much the climate warms in response to greenhouse gas emissions.

In 2013, the Intergovernmental Panel on Climate Change (IPCC) estimated the value of “equilibrium climate sensitivity” – the long-term warming caused by a doubling of atmospheric CO2 – is likely to lie between 1.5 and 4.5C

One way that scientists make estimates of climate sensitivity is by looking back at observed changes in the Earth’s climate. But decade-to-decade fluctuations, such as those identified by this study, may skew these types of estimates for long-term warming, says Norris:

“This transient behavior makes it harder to assess equilibrium climate sensitivity from only a few decades of temperature change.”

Lead author Dr Chen Zhou, a researcher at the Lawrence Livermore National Laboratory in the US, agrees. He tells Carbon Brief:

“One could be badly misled by taking observed trends and extrapolating into the future, because we do not expect this particular warming pattern to persist.”

The findings explain why estimates based on past warming have been lower than those obtained by other methods, says Prof Steven Sherwood, director of the Climate Change Research Centre at the University of New South Wales, who wasn’t involved in the study. He tells Carbon Brief:

“The real significance of these results is that they make it much more likely that estimates of climate sensitivity based on historical warming have been biased low compared to reality.”

Reinforcing impact

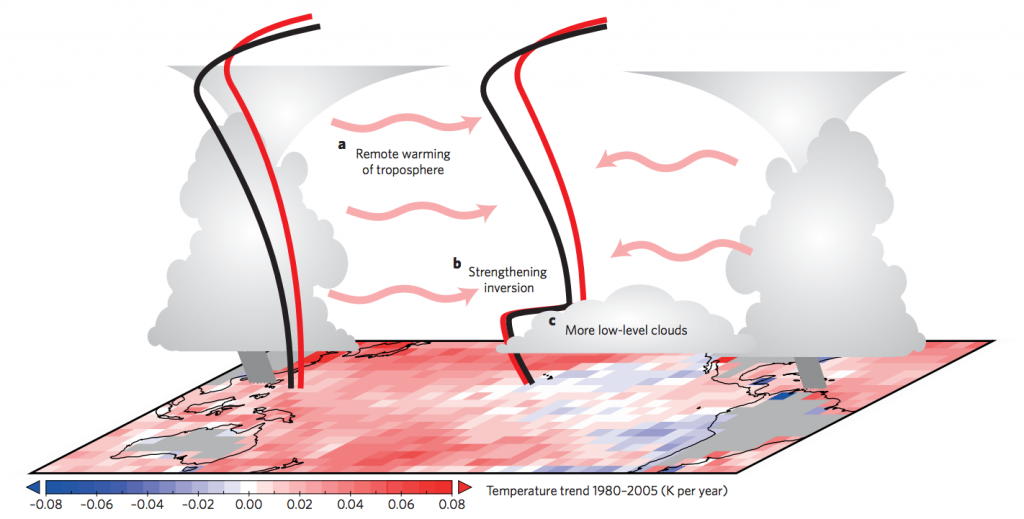
The study also suggests that low-level cloud changes in the tropics had a role in the slower pace of warming at Earth’s surface in the 2000s, compared to previous decades – the so-called “hiatus“.

That’s not to say it caused the slowdown, notes Zhou – that’s likely to be a combination of several factors, such as fluctuations in the Pacific Ocean, human-caused aerosol emissions and volcanic eruptions – but it may have enhanced its impact:

“The cloud changes we’ve diagnosed have been driven by the observed pattern of warming; they are responding to it, and in so doing, are modifying the planet’s energy budget in such a way as to reinforce the hiatus.”

So even though clouds are expected to amplify warming from greenhouse gases, they can “temporarily impede” warming too, concludes Zhou.

Zhou C. et al. (2016) Impact of decadal cloud variations on the Earth’s energy budget, Nature Geoscience, doi:10.1038/ngeo2828
Mauritsen, T. (2016) Clouds cooled the Earth, Nature Geoscience, doi:10.1038/ngeo2838

Sharelines from this story
  • Low-level clouds have dampened recent warming, study says

Expert analysis direct to your inbox.

Get a round-up of all the important articles and papers selected by Carbon Brief by email. Find out more about our newsletters here.