Fossil fuel use ‘will peak by 2025’ if countries meet climate pledges, says IEA
Simon Evans
10.13.21Simon Evans
13.10.2021 | 8:29amDemand for fossil fuels will peak by 2025 if countries meet their climate pledges, according to the latest World Energy Outlook 2021 from the International Energy Agency (IEA).
However, this year’s 386-page outlook – calling itself a “guidebook” for the upcoming COP26 climate summit – highlights the gaps between the policies already in place, the ambition set out in countries’ climate pledges and the significant additional efforts needed to keep global warming below 1.5C.
These gaps can be closed over the “crucial” decade to 2030, the IEA says, with a “massive” push for wind, solar and other low-carbon electricity; a “relentless” focus on energy efficiency; a “broad drive” to cut methane from fossil-fuel operations; and a “big boost” to clean-energy innovation.
It says a successful transition towards 1.5C would avoid “immense risks” from climate inaction and create a $1.2tn market for clean energy that would rival the current size of the oil industry.
For the first time, the IEA has also put a Paris-compliant pathway at the heart of its highly influential outlook. Its 1.5C “net-zero emissions by 2050” scenario (NZE), first outlined in May, is the most mentioned pathway in the report, Carbon Brief analysis shows.
Elsewhere, the report contradicts much of the world’s media coverage in its analysis of the current global energy crisis. The “key reasons” for record-high prices include economic rebound from the pandemic, the IEA says, and “are not related to efforts to transition to clean energy”.
New scenarios
The IEA’s annual World Energy Outlook (WEO) is published every autumn and is widely regarded as one of the most influential annual contributions to the climate and energy debate.
It explores a range of scenarios, representing different possible futures for the global energy system, using its “World Energy Model” and “Energy Technology Perspectives” model.
This year’s outlook sees a significant shift in the IEA’s menu of scenarios. For the first time, it places the new 1.5C-compatible NZE scenario at the heart of the report. The NZE is mentioned more frequently than any of the other pathways, as shown in red in the chart below.
The NZE is what the IEA calls a “normative” scenario, meaning it starts with a fixed aim – limiting warming to 1.5C – and then works backwards to see how it would be possible to get there.
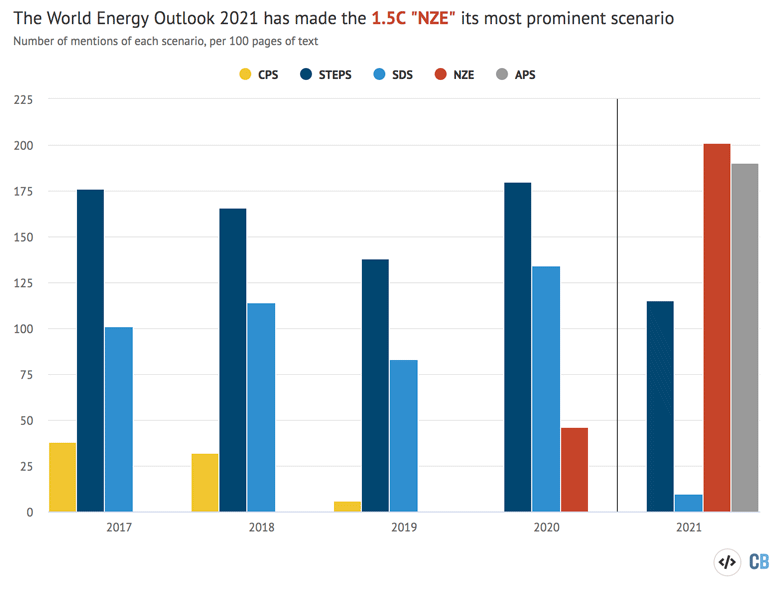
The two other main pathways in this year’s report are “exploratory” scenarios, meaning they look at what might happen, given the current set of government policies and pledges, as well as expected changes in population, economic growth and technology development.
The first is the “stated policies scenario” (STEPS), based on the IEA’s assessment of government policies already in place or firmly under development (dark blue in the chart, above). The second is the “announced pledges scenario” (APS), where government climate pledges are met in full (grey).
In the UK, for example, table B.6 explains that the STEPS includes the government’s 10 point plan and energy white paper, whereas only the APS includes full implementation of the updated Paris climate pledge, sixth carbon budget and net-zero by 2050 target.
The outlook also includes the IEA’s “sustainable development scenario” (SDS), a pathway towards “well-below 2C” that the agency was last year calling “fully aligned” with the Paris Agreement.
Notably, the old “current policies scenario” (CPS), often used in the past to justify continued investment in fossil fuels, no longer features at all, having been temporarily left out last year.
The introduction to the outlook emphasises that this year’s report is a “special edition”, with a different structure aimed at the COP26 talks. While the structure of future outlooks “remains open”, the NZE “now joins the stable of core IEA scenarios…in the WEO series”.
Although the NZE is now a core scenario, it is not fully featured in the outlook’s data tables. It is only reported at global level, in contrast to the regional breakdowns for the STEPS, APS and SDS.
(Another subtle, but significant shift in this year’s outlook is the use of exajoules – the standard unit for energy – to report global energy supply, instead of millions of tonnes of oil equivalent. The IEA joins oil major BP, which made the same move in its 2020 statistical review of world energy.)
Net-zero
The shift in focus in this year’s WEO manifests itself in other ways, with the phrase “net-zero” used around 75 times per 100 pages, up from 38 times in 2020 and just once per 100 pages in 2018. Similarly, the term “1.5C” appears 19 times per 100 pages, double the rate last year.
In the WEO 2019, when the IEA first made tentative steps towards addressing the 1.5C target, it said the goal would “pose challenges that would be very difficult and very expensive to surmount”.
Now, it emphasises the “immense” risks of unabated emissions, both in terms of human health and in the physical risks from extreme weather events, where “the energy sector will feel the impact”.
The outlook also highlights the “unmistakeable signs of change” that are already shifting the curve of emissions, saying that a “new energy economy is coming into view”. It says:
“There is no guarantee that the emergence of this new energy economy will be smooth, and it is not coming forward quickly enough to avoid severe impacts from a changing climate. But it is already clear that tomorrow’s energy economy promises to be quite different from the one we have today.”
(The outlook also sounds a note of caution, explored further below, saying: “At the moment, however, every data point showing the speed of change in energy can be countered by another showing the stubbornness of the status quo.”)
The IEA says that “[t]he potential prize is huge for those who make the leap to the new energy economy”, adding that the market for clean energy technologies would exceed $1tn a year by 2050 under the NZE 1.5C pathway, an amount it compares with the current global oil market.
The encouraging news is that a New Energy Economy Is Emerging#WEO2021 shows that pursuing #NetZero can create a market opportunity for equipment like batteries & wind turbines worth over $1 trillion a year by 2050 – similar to today’s oil market
— Fatih Birol (@fbirol) October 13, 2021
More: https://t.co/JXPMBBp2Ii pic.twitter.com/mvChbXQ2sJ
The report says that clean-energy jobs will “more than offset[] the decline in traditional fossil fuel supply sectors”. Jobs growth in renewables, cars, efficiency, electricity generation and other areas would easily outweigh losses in coal, oil and gas, the IEA says, creating a global net gain of around 13 million jobs by 2030 in the APS and double that in the NZE.
Fossil peak
The outlook goes on to set out the implications of each scenario for the global energy system, arguing that progress in the “new energy economy” is now “sustained by lower costs”.
This means, for example, that wind and solar are already the “cheapest available source of new electricity generation” in “most regions”, according to the IEA, and there is a “compelling case” for electric vehicles (EVs) in “many markets”, based on total cost of ownership.
These developments, along with the climate policies already in place in the stated policies scenario (STEPS) mean that low-carbon sources are set to meet “almost all of the net growth in energy demand” over the next three decades, the IEA says.
As a result, while fossil fuel use rebounds over the next five years, it soon peaks and then plateaus out to 2050 – even under the “more conservative benchmark” of the STEPS, where countries fail to fully implement their climate pledges. This is shown by the grey line in the chart below.
By September 2021, the IEA says that some 53 countries and the EU had pledged to reach net-zero emissions, accounting for around two-thirds of global CO2 emissions. Since then, Russia, Turkey and the United Arab Emirates have added their names to this list.
(The IEA says China’s 2060 net-zero pledge has “global significance”. A detailed IEA study with “leading energy experts in China” shows how the country could reach this goal, saying there is “no plausible path” to 1.5C without China. It: “Faster progress before 2030 is possible and beneficial.”)
If countries meet their net-zero and other new climate goals, as in the APS, then the IEA’s outlook suggests that fossil-fuel emissions would peak by 2025 and then start to rapidly decline (red line).
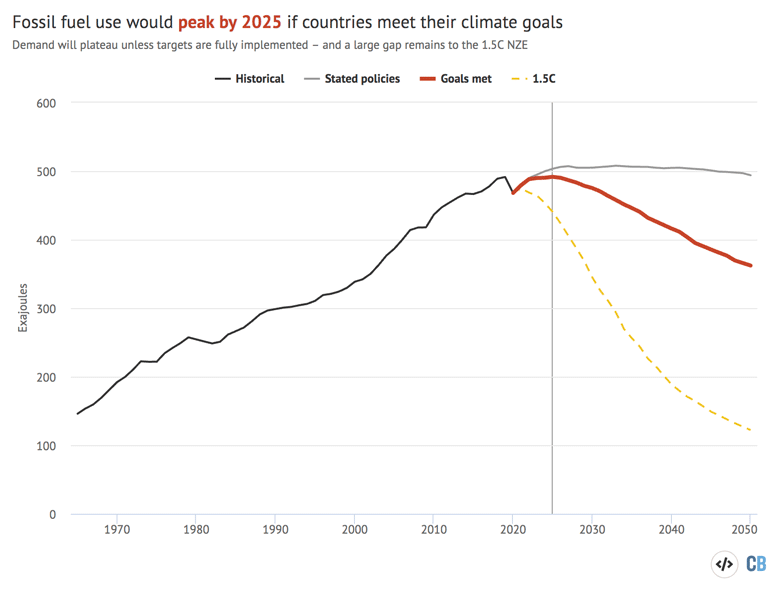
Despite a peak and decline in fossil fuel use, the ambition of the world’s climate pledges still falls well short of what would be needed to stay below 1.5C, as shown by the dashed yellow line.
This outlook reiterates the message of its 1.5C report that this pathway would entail no investment in new oil and gas fields, beyond those already approved for development.
Warming limits
Overall, the IEA says emissions are set to decline only marginally by 2050 under the currently implemented policies included in the STEPS, as shown in the figure below (blue line). This would mean temperatures in 2100 reaching some 2.6C above pre-industrial levels, the IEA says.
(The temperature projections, based on the “MAGICC” simplified climate model, assume that non-energy greenhouse gases are reduced proportionally with CO2 emissions and that the trends to 2050 continue for the rest of the century.)
Although 2.6C is a long way off meeting the goals of the Paris Agreement, it represents huge progress since the “pre-Paris baseline” (red line, blue wedge), according to the chart, which was tweeted by IEA executive director Fatih Birol at the launch of the outlook.
If countries fulfil their latest “Glasgow” climate pledges, as in the APS (yellow), warming would be limited to 2.1C this century – closer to, but still far short of the “well-below 2C” Paris goal.
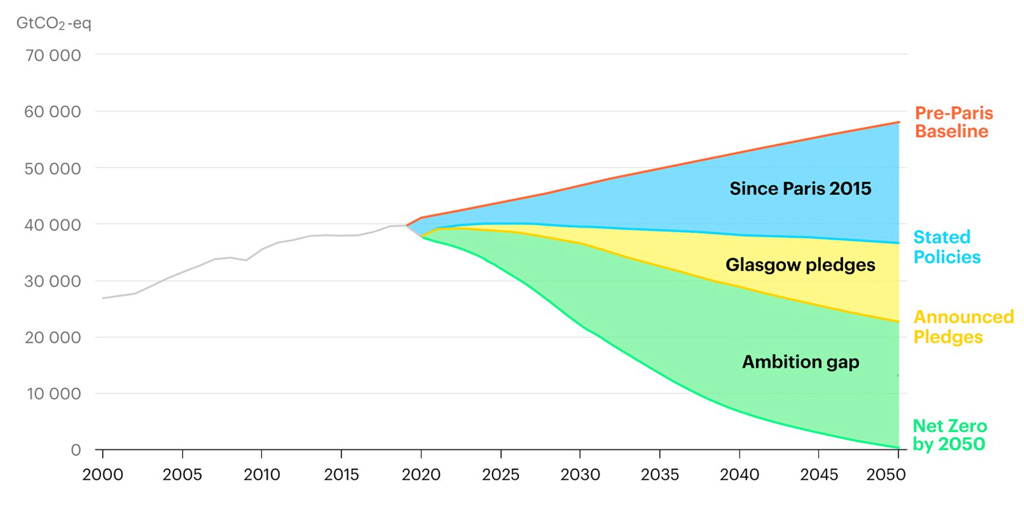
However, an “implementation gap” between countries’ ambition and the policies they have in place, amounting to some 2.6bn tonnes of carbon dioxide (GtCO2) in 2030, stands between the current trajectory towards 2.6C and the 2.1C that could be achieved under countries’ pledges.
Moreover, there is an even larger 12GtCO2 “ambition gap” between those pledges and the 1.5C stretch target of the Paris deal, which could be met under the IEA’s NZE scenario.
This means today’s pledges cover “less than 20%” of the emissions reductions needed to “keep a 1.5C path within reach”, the IEA says.
Ambition gap
With its eye firmly on informing discussions at the COP26 climate summit, the IEA devotes a full chapter of its outlook to the 1.5C “ambition gap” and what would be needed to close it.
The outlook says: “All countries need to do more: those with existing net-zero pledges account for about half of the additional reductions, notably China.”
It identifies four key areas where countries need to make progress in the “crucial period” to 2030 and says that more than 40% of the actions involved are cost-effective, purely in terms of the savings they would create for consumers, relative to the APS.
The IEA’s proposals for closing the ambition gap are shown in the waterfall chart, below, with the cost-effective portion further broken down in the lower portion of the figure.
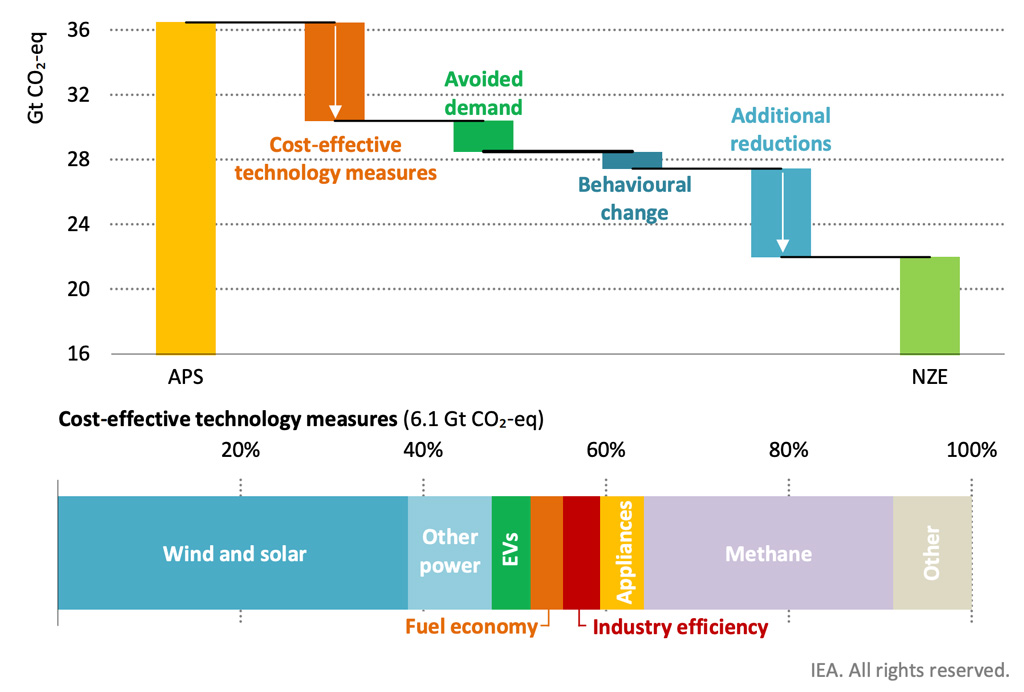
The first and most important of the four “key measures” identified by the report is a “massive push” for clean electrification, based on a doubling of wind and solar deployment relative to the APS, along with a “major expansion” of other low-carbon sources, including nuclear power “where acceptable”. This would cut emissions in 2030 by around 5GtCO2 in 2030.
The IEA also calls a “rapid phaseout of coal” – by 2030 in advanced economies and 2040 globally – and an end to new investment decisions in coal, with the potential to avoid 0.8GtCO2 of emissions in 2030.
Larger supplies of clean electricity would need to be complemented by a “huge build-out” of electricity infrastructure and “all forms” of grid flexibility. (The electricity sector would reach net-zero emissions overall by 2035 in advanced economies and by 2040 globally).
(Figure 4.29 in the outlook breaks down the sources of grid flexibility in 2050 under different scenarios, with demand response and batteries making up around half the total under the NZE, with hydro and other renewables adding another quarter. The remaining share is mainly met by hydrogen, with smaller roles for nuclear and fossil gas.)
The second key measure is a “relentless” focus on energy efficiency, along with measures to “temper” demand through material efficiency and behaviour change. Together, the IEA says these could close some 2.6GtCO2 of the ambition gap.
However, doing so would require the energy intensity of the global economy to improve by 4% a year to 2030, more than double the rate seen in the decade to 2020. The outlook adds that more than 80% of these gains would generate cost savings for consumers.
The third measure is to cut methane emissions from fossil-fuel operations, particularly the oil and gas industry, with the potential to avoid 1.7GtCO2 equivalent in 2030.
The fourth key area identified by the outlook is to “boost clean energy innovation”, even though this will not have a major impact on emissions until after 2030. The report explains:
“All the technologies needed to achieve deep emissions cuts to 2030 are available. But almost half of the emissions reductions achieved in the NZE in 2050 come from technologies that today are at the demonstration or prototype stage.”
Energy crisis
In the outlook itself and a commentary published a day earlier, the IEA pushes back on the idea – widely promoted by the media – that climate action is to blame for the current global energy crisis.
The commentary says that gas, coal and electricity prices have climbed to their “highest levels in decades” as a result of a rapid economic recovery from the Covid-19 pandemic, a prolonged cold winter in the northern hemisphere and outages affecting fossil-fuel supply.
The piece argues it is “inaccurate and misleading to lay the responsibility at the door of the clean energy transition”, while the foreword to the outlook says “[t]he key reasons for these sharp increases in energy prices are not related to efforts to transition to clean energy”.
Nevertheless, the foreword says that governments’ plans to shift to clean energy “risk failure” if they are not “secure, affordable and fair for all citizens”.
Addressing these risks, the outlook devotes an entire chapter to the need for “secure transitions”:
“By design, the scenarios in this outlook describe smooth, orderly processes of change. In practice, however, energy transitions can be volatile and disjointed affairs, contested by a diverse cast of stakeholders with competing interests, and there is an ever‐present risk of mismatches between energy supply and demand.”
Risks include tensions over global trade as regions shift to clean energy at different rates and sharp drops in fossil fuel use destabilising countries that depend on income from their sale.
It also points to “fundamental changes in how power markets operate” as wind and solar make up a rising share of the electricity mix. The contribution from these variable renewables reaches 68% of the global total by 2050 in the NZE – with even higher shares in some markets.
Dealing with these changes “requir[es] policy makers to mobilise investment in all sources of flexibility in order to maintain electricity security”, the outlook says.
Other issues include the physical risks from a changing climate, with the IEA noting recent events such as the damage to power lines and oil refineries during Hurricane Ida in August 2021.
It says that 13% of the world’s coastal thermal power plants, 25% of onshore liquified natural gas (LNG) facilities and 10% of coastal oil refineries are “already are at risk of experiencing severe coastal floods”, adding: “These levels of risk will increase as sea levels rise.”
Similarly, the IEA identifies risks to energy-related infrastructure as a result of rising water stress, with a third of existing thermal and nuclear power plants already subject to high water stress areas.
This is shown in the figure below, where thermal power plants (blue dots), nuclear power plants (purple triangles), refineries (green squares) and copper mines (blue diamonds) are mapped against water scarcity in 2020, with higher exposure indicated by darker shading.
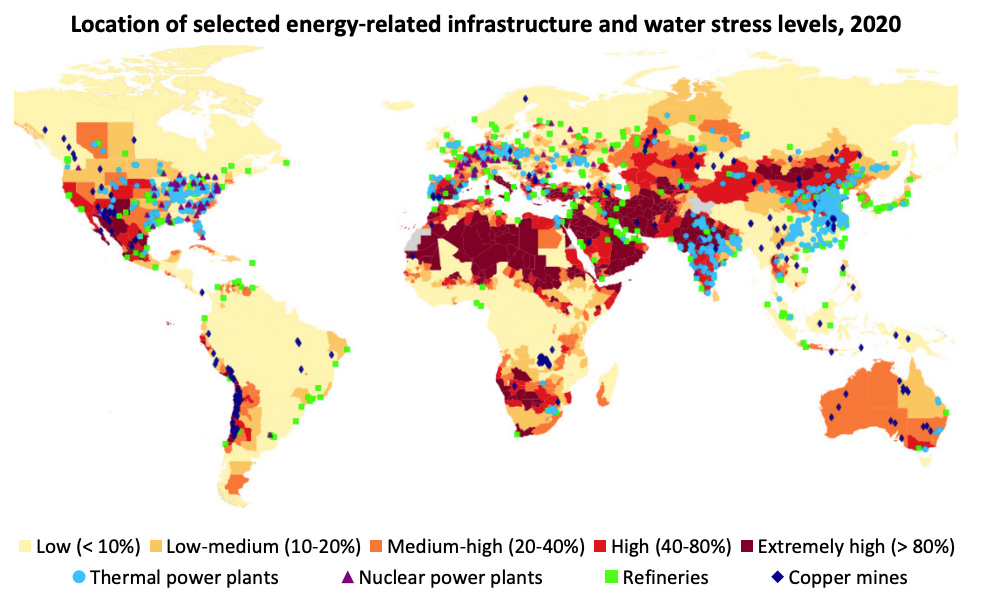
The outlook adds: “Based on the projected water availability under the IPCC RCP 4.5 scenario (an intermediate emissions scenario), over 40% of freshwater‐cooled thermal and nuclear fleets are projected to be in high risk areas by 2040.”
-
Fossil fuel use ‘will peak by 2025’ if countries meet climate pledges, says IEA