Guest post: How the Greenland ice sheet fared in 2021
Carbon Brief Staff
11.16.21Carbon Brief Staff
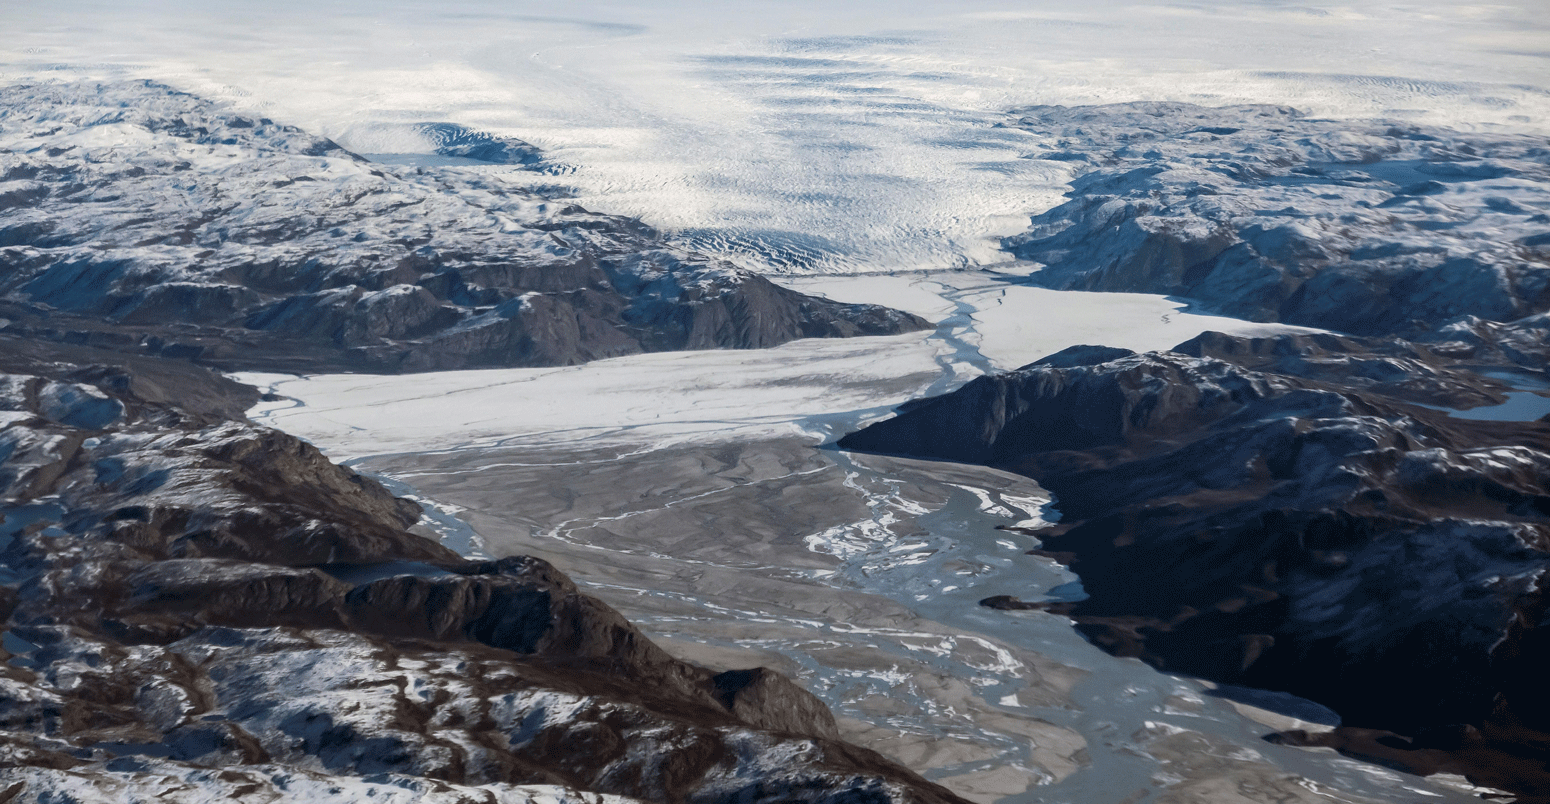
16.11.2021 | 3:17pmThis year, the Greenland ice sheet has provided a feast for scientists.
A cool and wet early summer with unusually large and late snowfall in June delayed the onset of the main melt season – which typically runs through the northern hemisphere summer – but a heatwave in late July subsequently brought higher ice loss.
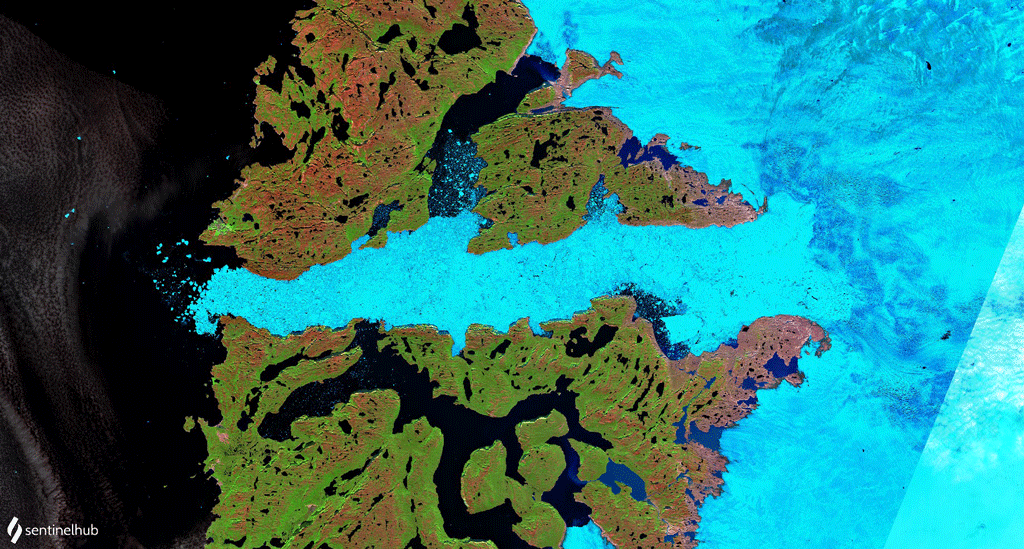
This year was also notable for the first recorded rainfall at the summit of Greenland, which is 3,200 metres above sea level. And a new acceleration of ice loss at Sermeq Kujalleq – sometimes known as Jakobshavn Isbræ or Ilulissat glacier.
Accounting for both surface melting and discharge of icebergs, the Greenland ice sheet lost around 166bn tonnes of ice over the 12-month period ending in August. This means that 2021 is the 25th year in a row where Greenland has lost more ice than it gained.
In this guest post, we unravel the processes of ice sheet melt, glacier calving, weather and climate that explain these losses.
(See our previous annual analysis for 2020, 2019, 2018, 2017, 2016 and 2015.)
Surface melt
As ever with our annual Greenland review, we focus on the 12 months up until the end of August.
Greenland’s annual cycle sees the ice sheet largely gain snow from September, accumulating ice through autumn, winter and into spring. Then, as the year warms up into late spring, the ice sheet begins to lose more ice through surface melt than it gains from fresh snowfall. This melt season generally continues until the end of August.
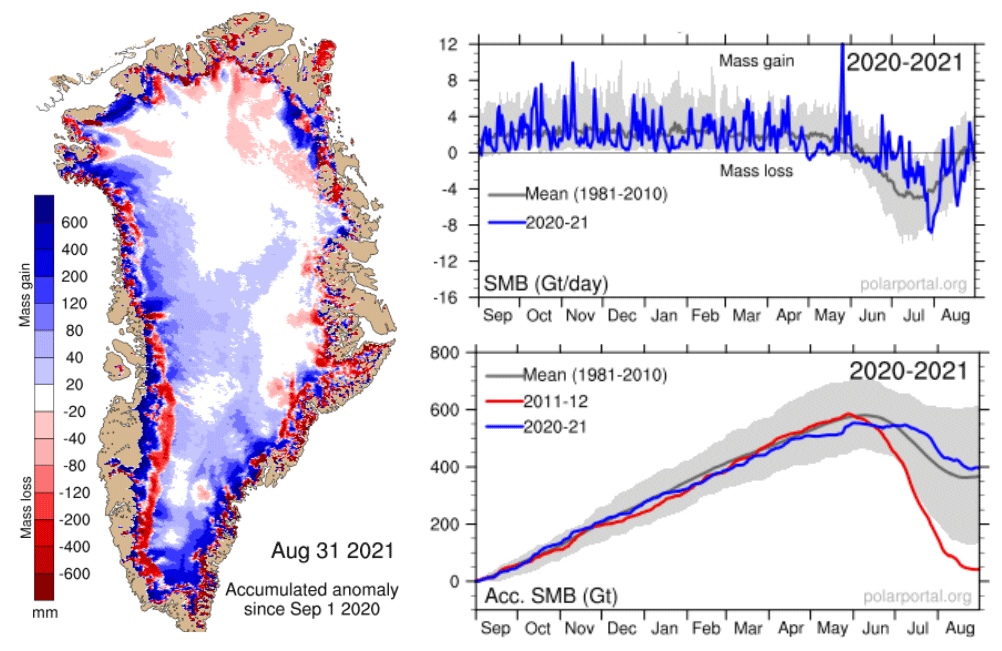
The snow gains and ice losses at the ice sheet’s surface over the past 12 months is Greenland’s “surface mass balance” (SMB). Below, the blue line in the top and bottom charts show the daily SMB and cumulative SMB for 2020-21, respectively. The grey line shows the long-term average and the red line shows the record low year of 2011-12 for comparison.
According to our calculations, this year the Greenland ice sheet ended with a total SMB of about 396bn tonnes (Gt). This means that the period September 2020 to August 2021 ranks as 28th lowest out of a 41-year timeseries. In the current climate, this can be considered a fairly average year. However, in the late 90s, this would be seen as a very low year.
The map below shows how the geographic spread of SMB gains (blue) and losses (red) for 2020-21 compare with the long-term average.
Blocking event
Closer inspection of the weather and ice sheet changes reveal some fascinating events and patterns.
Winter snowfall over 2020-21 was close to average, which is good news for the health of the ice sheet. For example, low winter snowfall in combination with warm summers – as in 2019 – can lead to very high ice losses.
Then, in the summer period, near-record snowfall in early June delayed the onset of the main part of the melt season. As fresh snow is bright white and reflects sunlight better than the old dark glacier ice underneath, melt was low at the start of the melt season. It was also rather cool and wet in June and early July.
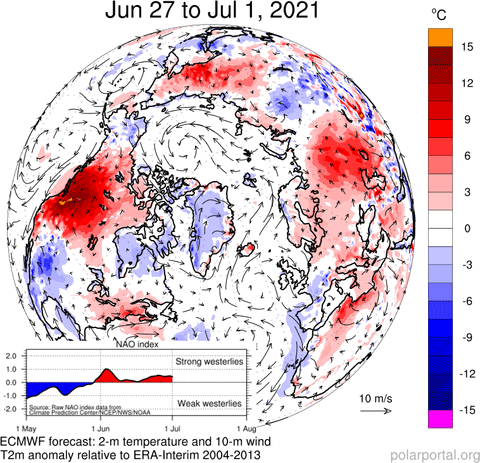
The reason for the cold and wet early summer over the Greenland ice sheet can be found quite far away, over south-western Canada and north-western US, which experienced a record-breaking “heat dome” at the end of June and the beginning of July.
While a rapid-attribution study revealed that such an extreme event would have been “virtually impossible” without the underlying influence of human-caused warming, it was primarily driven by a meandering jet stream.
Over the western part of Canada and the US, a huge “blocking” high pressure system formed. Shaped like the capital Greek letter Omega (Ω), such a flow pattern occurs regularly, but has never before been observed with such a strength.
The jet stream was diverted far to the north into the Canadian Arctic. At the “feet” of the Omega, troughs of low pressure – in this case one over Alaska and the other one over Greenland – led to the rather cool and wet summer.
The map below shows the cool, wet summer weather in Greenland (in the centre of the map, shaded blue) in late June and the abnormal heat over the western half of North America (red shading on left-hand side).
Despite the cool start, as the melt season got underway there was a period of very high temperatures at the end of July. This brought intense melt all around the ice sheet that led to very large ice losses over a few days.
The map below shows the area of ice melt on 28 July (red shading), and the chart beneath confirms that more than 60% of the ice sheet’s surface was melting on that day.
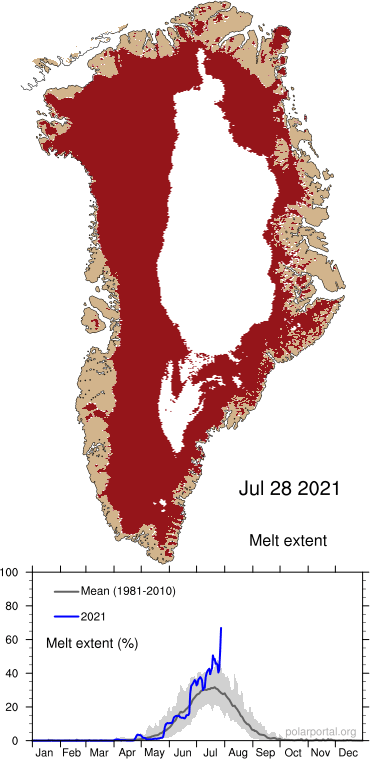
The eastern Greenland airport community of Nerlerit (also known as “Constable Pynt”) – close to Ittoqqortoormiit (previously known as “Scoresbysund”) – recorded a new record high of 23.4C at this time.
Rain at the summit
Rain was a continuing theme of the 2020-21 summer season. Qaqortoq in south Greenland recorded a new record daily rainfall of 145mm on the summer solstice (and Greenland National Day), while the summer also saw floods in the town of Qaanaaq in north-west Greenland.
The other remarkable event of summer 2021 was the rainfall at Greenland’s Summit Station, literally on the top of Greenland, on 14 August. This is a very remote place – 3,216 metres above sea level and with an annual average temperature of -30C.
Although the records of Summit Station go back only to the 1990s, the lack of refrozen water layers in the snow and ice cores taken here show that rain is unlikely to have ever occurred at the top of the ice sheet since at least the 1880s.
This is also the first time since direct observations began in 2008 that rain was seen by staff at the station.
The science tech up at Summit did make direct observations of rain on August 14. I can give you more details! 📷: Alicia Bradley, NSF. 6am, rain observed. pic.twitter.com/hGnFvRm0yT
— Zoe Courville (@ZoeCourville) August 19, 2021
Rain indicates temperatures close to or above the freezing point and melting at Summit is a very rare event.
As meltwater refreezes in the snow, it can be seen as a thin layer of ice in a shallow ice core that includes layers of snow and firn – the intermediate stage before snow becomes compressed into glacier ice. Summer and winter snow look different in such a core, so we can count the years and, therefore, find in which year the melt took place.
Over the past 2,000 years, melt layers are only seen nine times: in 2021, 2019, 2012 – these three were also directly observed by the station staff – and before that in 1889, 1094, 992, 758, 753 and 244. The warmest observed temperature at Summit was 2.2C on 13 July in 2012.
Total losses
A “positive” SMB – where the ice sheet gains more snow than it loses in ice – is the only means by which the Greenland ice sheet can gain ice. However, it also loses ice by other processes, such as the “calving” – or breaking off – of icebergs, melting underwater at the front of glaciers where they meet the ocean, and to a small extent by “basal melting” underneath the ice sheet as the ice slides over the ground.
Combining these losses with the SMB gives a “total mass balance” for the year.
Using satellites, we can measure the speed at which ice flows through control points – places around the edges of the ice sheet where we know the thickness and shape of the ice. Combined with data on how thick the ice is, we can estimate quite well the amount of ice being lost by the process of calving and submarine melting. This data is now processed in near real time and is openly available, allowing us to monitor the whole ice sheet budget.
This method shows that the year 2020-21 had the highest loss of ice to calving and ocean melt since at least 1986 when the satellite records began.
Importantly, in 2020-21, Sermeq Kujalleq – also known as the Jakobshavn Isbræ or Illulissat glacier, the fastest glacier in the world – has accelerated again after a few quiet years. At the same time the glacier produced a large amount of icebergs and we calculate it lost around 45Gt in the last year – more than 10% of the annual surface mass budget. This has a big impact on the total ice budget for the year.
Although this year was not a record ice loss year in Greenland, when we also account for calving, it was still the 25th year in a row where the ice sheet lost more ice than it gained.
The total mass balance for 2020-21 is a loss of around 166Gt of ice from Greenland – close to the average ice lost each year for the period 1986-2021.
This means that, from 1 September 1986 to 31 August 2021, we calculate the Greenland Ice Sheet has lost approximately 5,500Gt of ice. This is equivalent to 1.5cm of global average sea level rise.
Given the calving and ocean melt losses from Greenland this year, we were lucky the surface mass budget was so high, increasing snowfall and cool summers will not always help to balance the ice budget.