
In-depth: BP data reveals clean electricity matched coal for the first time in 2019
Simon Evans
06.18.20Simon Evans
18.06.2020 | 4:38pmRenewables were the largest source of new energy in 2019, but there were still record highs for oil, gas and CO2 emissions, according to new global data from oil giant BP.
Low-carbon electricity generation also matched global coal power for the first time in 2019, analysis of the data shows. Further gains for wind and solar drove clean sources to this new milestone, helped by a historic fall in coal output.
The 69th edition of the company’s influential annual statistical review of world energy is published amid a global pandemic that risks derailing global climate efforts, BP says. The firm joins a long list of others calling for a “green recovery” by saying the world should aim to “build back better”.
The backdrop to all this is laid out in BP’s new data, which describes a world that was using record amounts of energy in 2019, even though demand rose more slowly than in the previous decade.
Renewables posted record growth in 2019 (3.2 exajoules, EJ, 12.2%) and though they met the largest share of rising demand, a similar portion was from fossil fuels. Large increases for oil (1.6EJ, 0.8%) and gas (2.6EJ, 2.0%) offset falling coal use (-0.9EJ, -0.6%).
As a result, global CO2 emissions rose again, albeit by just 0.5%, leaving the gap to global climate goals larger than ever.
Here, Carbon Brief runs through the key details from this year’s BP data.
Covid context and corporate repositioning
BP has been producing its annual statistical review since 1952 and it has been circulating in public since 1955. This year’s 69th edition arrives at a time of grave global crisis, after the loss of hundreds of thousands of lives to Covid-19 and the world’s deepest recession since the 1930s.
- IEA: ‘Green’ coronavirus recovery would keep global emissions below 2019 peak
- Coronavirus: Tracking how the world’s ‘green recovery’ plans aim to cut emissions
- Webinar: What impact is Covid-19 having on global CO2 emissions?
- Q&A: Could climate change and biodiversity loss raise the risk of pandemics?
- Analysis: Coronavirus set to cause largest ever annual fall in CO2 emissions
- Coronavirus: What could lifestyle changes mean for tackling climate change?
- Analysis: Coronavirus temporarily reduced China’s CO2 emissions by a quarter
It also coincides with BP’s latest efforts to reposition itself as a company, following the appointment earlier this year of new chief executive Bernard Looney. In February, the firm pledged to reach net-zero emissions by 2050, a commitment Looney recently said was reinforced by coronavirus.
Just this week, BP wrote down the value of its oil and gas reserves, due to a revised price outlook and the expectation of a faster shift away from fossil fuels. BP will flesh out this expectation in its annual energy outlook, which has been pushed back from April to September.
In a foreword to this week’s statistical review, Looney warns that the coronavirus crisis “risks slowing progress” on “long-term, global challenges, such as climate change”. He adds that the world needs to respond to the pandemic “in a way that builds back better”.
This echoes the language coming from a diverse set of voices from the UN to the Pope, leading economists and many national leaders. Moreover, Looney says: “The technologies required to reach net zero exist today – the challenge is to use them at pace and scale.”
These changes in corporate rhetoric are accompanied by several small, but notable presentational changes in BP’s statistical review.
First, energy use is now reported primarily in exajoules, a standard unit, rather than as “millions of tonnes of oil equivalent”. Second, the table presenting data on global CO2 emissions appears near the top of the report, as opposed to at the end last year. Third, biofuel use is now counted with other renewable sources of energy, as opposed to being included within the total for oil.
(One final change in this year’s report relates to the “input-equivalent basis” for converting non-fossil fuel outputs into amounts of primary energy. This adjusts for the fact that most fossil primary energy is lost as waste heat. Refer to BP’s methodology for more details.)
Slower growth before coronavirus
The new BP data shows global primary energy demand having reached a new high in 2019 of 584EJ, up by 7.7EJ or 1.3% on a year earlier. Three-quarters of the increase came from China. Overall, this means global energy demand grew by the equivalent of the UK or Mexican total.
The increase in 2019 was slower than the 1.6% average for the previous decade and, BP notes, just half the 2.8% rise in 2018. This slowdown is “in line with weaker economic growth and a partial unwinding of some of the one-off factors that boosted energy demand in 2018”.
Some 41% of the increase in 2019 was met by renewables (3.2EJ), including wind, solar and biomass, making up the largest share of the total as the chart below shows. This was also the largest-ever annual increase for non-hydro renewables, breaking the record from 2017.
Large hydro met 4% of the increase in new demand in 2019 (0.3EJ) and another 10% came from nuclear (0.8EJ), meaning low-carbon sources met 55% of the total.
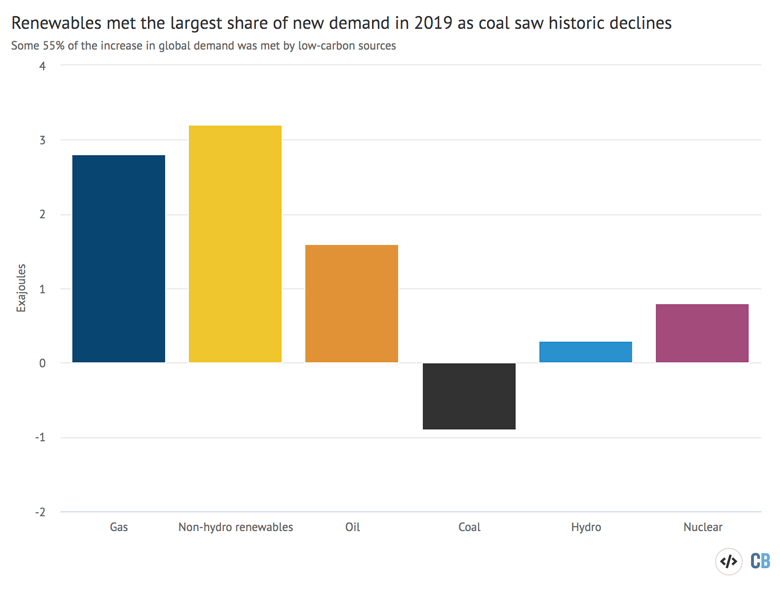
Fossil fuels still met much of the new demand in 2019, however, with 36% from gas (2.8EJ) and another 21% from oil (1.6EJ). Coal use fell by 0.9EJ after historic declines in the power sector.
Interestingly, the increases in nuclear and fossil energy demand were relatively concentrated, whereas renewables posted increases across a much wider geographical spread.
China accounted for more than four-fifths of the increase in global oil demand in 2019 and India another fifth. China also accounted for three-fifths of the increase in nuclear energy output. For gas, both China and the US made up around a third of the increase.
In contrast, renewables growth came from China (26%), the EU (18%), the US (10%) and Japan (7%), as well as a host of other countries including Brazil (6%), Indonesia (4%) and Mexico (4%).
Record share for low-carbon sources
Global primary energy demand has increased by 50% over the past two decades and is now double the level seen 40 years ago. This growth is intimately connected to rising CO2 emissions, as – unlike in 2019 – it has historically been largely met by fossil fuels.
In 2019, most energy sources continued to rise, with oil, gas, hydro and non-hydro renewables all reaching record highs, as the chart below shows. The stand-out exception is coal, which has seen declining demand in four of the past six years and remains well below a 2013 peak.
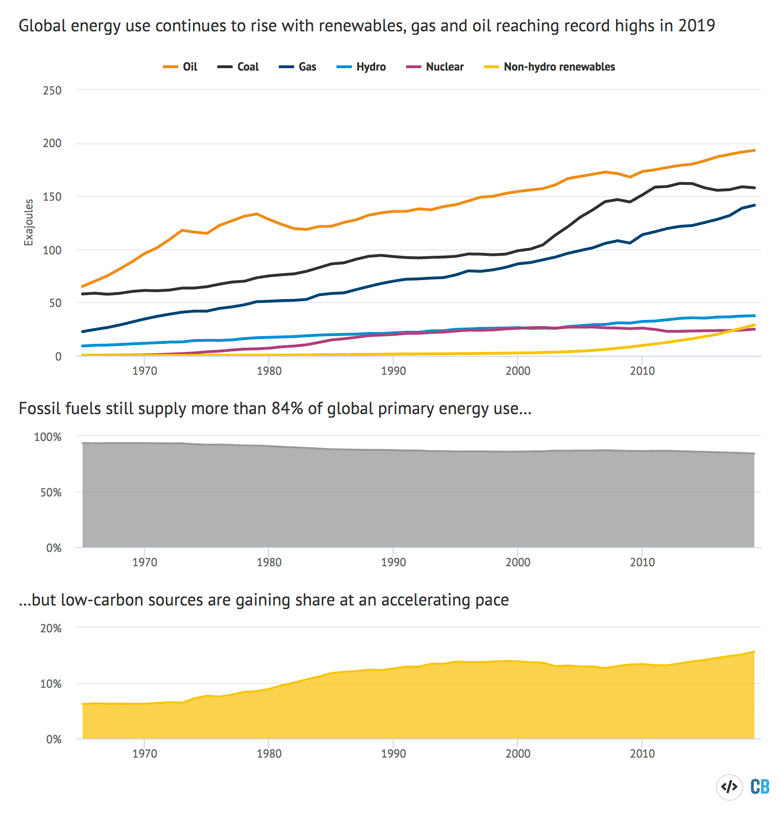
Renewables were once again the fastest-growing source of energy, up 12% in the past year and a massive 252% in a decade. This explains the growing share of global energy demand being met by low-carbon sources, which, at nearly 16% in 2019, was the highest in the 54-year BP data series.
Nevertheless, fossil fuels still met more than 84% of global primary energy demand in 2019. Although this is barely lower than their 86% share in 1999 or 88% in 1989, it is worth adding that the rate of change is increasing, with fossil fuels losing half a percentage point in the past year. (The shift is likely to be even larger in 2020 given the fallout from coronavirus.)
Both oil (+0.8%) and gas (+2.0%) posted continued growth in 2019, albeit at slower rates than in previous years. Global oil demand is now 15% higher than a decade ago, while gas use is up by 34% over the same period.
Coal use was down again in 2019 (-0.6%), the fourth drop in six years. Yet it remains broadly level over the past decade, whereas it would need to plummet to meet global climate goals.
CO2 emissions rose slightly
The latest small decline in coal was insufficient to offset the increase in CO2 emissions from oil and gas, meaning the global total rose slightly in 2019, by 0.5%.
(Note that BP’s methodology and coverage of CO2 emissions differs somewhat from that used by the International Energy Agency or the Global Carbon Project, which have both reported emissions in 2019 as having been more or less flat relative to 2018.)
Of the 161m tonnes of CO2 (MtCO2) increase in emissions reported by BP for 2019, the largest driver was once again gas, which accounted for roughly four-fifths of the total. Rising oil use was responsible for around three-fifths of the increase in emissions, with coal offsetting the difference.
The chart below breaks down those global emissions by country, showing a sharp increase in China’s CO2 output last year. (Note again that the 3.4% increase in 2019 for China, as reported by BP, is much larger than the 2.0% estimate from the Global Carbon Project.)
China’s contribution to global CO2 growth in 2019 is even more obvious in the lower panel, below, where its 319MtCO2 addition to the total (red) is partly offset by the declines in the US (-152MtCO2, light blue) and the EU (-136MtCO2, dark blue).
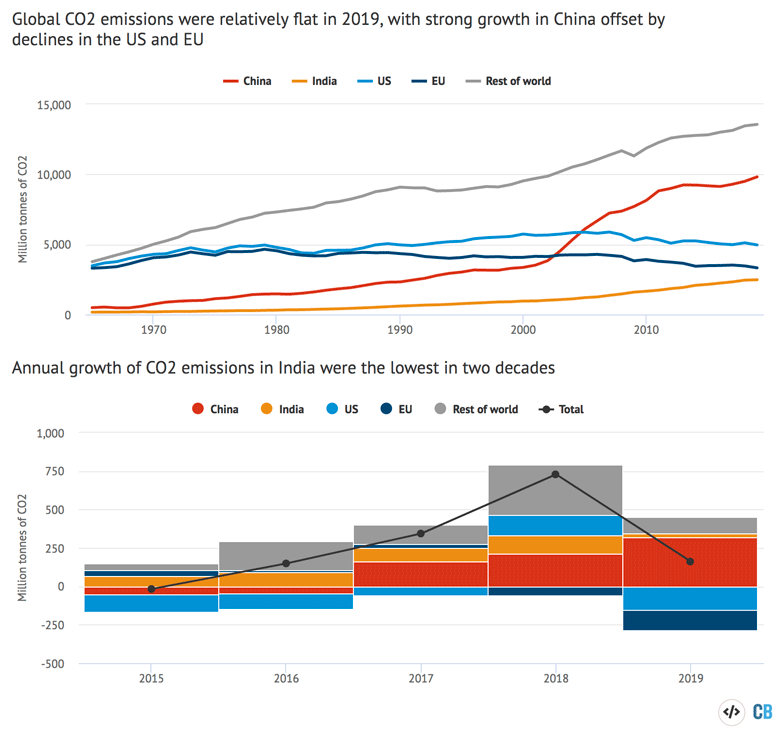
Also notable in the lower panel of the chart is the slow growth in CO2 emissions in India last year (28MtCO2, orange). As Carbon Brief reported in May, India’s emissions fell for the first time in four decades in the fiscal year to March 2020, with a slowing economy during 2019 a key factor.
Without the increase posted by China, Indonesia and Vietnam during 2019, global CO2 emissions would certainly have fallen, given the large declines in Europe and North America.
Clean electricity matched coal
One of the most striking nuggets buried in the BP data is the fact that low-carbon sources of electricity matched coal power for the first time in 2019, as shown in the chart below.
Clean power – including nuclear, hydro, wind, solar, biomass and geothermal – had come close to reaching this point early in the BP series, thanks to the rapid growth of nuclear. But coal had surged ahead during the 2000s as a result of China’s massive coal-fueled economic boom.
The new milestone for low-carbon electricity stems from historic declines in coal power last year and shown in the lower chart, below (black line), combined with continued rapid gains for wind and solar (with biomass and geothermal as non-hydro renewables, yellow).
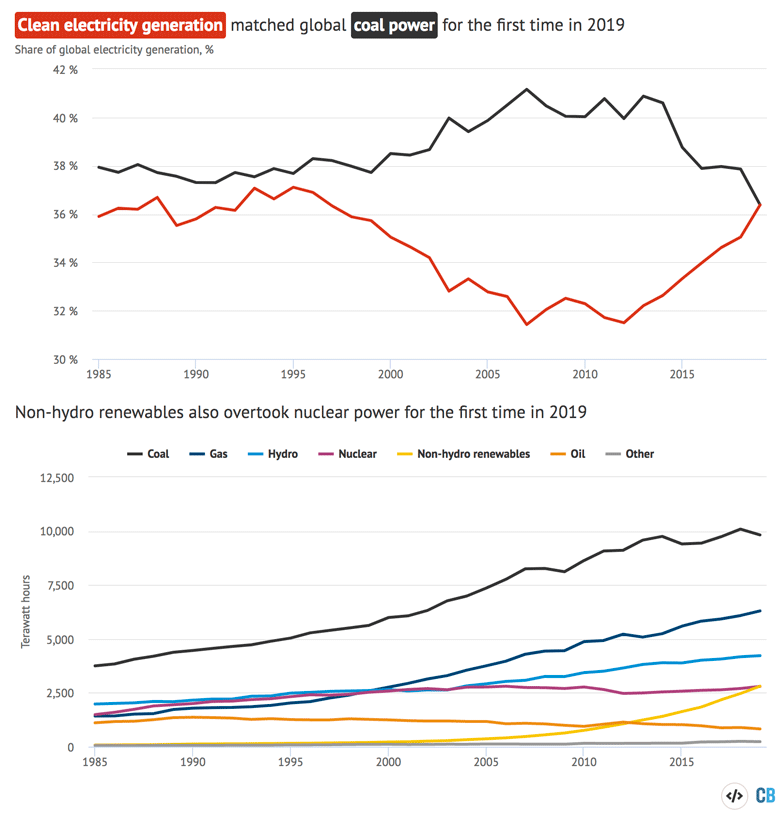
Notably, despite a relatively strong 3.5% increase for nuclear power output in 2019, it was overtaken for the first time by non-hydro renewables.
In total, global electricity output rose by a relatively modest 1.3% in 2019, reflecting the same drivers that kept energy demand in check. Alongside the 3% decline for coal there were rapid gains for wind (13%) and particularly solar (24%).
Low-carbon sources grew by more than the total increase in electricity demand, adding 484 terawatt hours (TWh) with the uptick from gas (215TWh) more than offset by declines for coal (-267TWh) and oil (65TWh).
Fossil fuels fell to their joint-lowest share of the global total, at 63%, matching the previous low seen in 1988.
South-east Asia overtook EU coal use
Coal use for electricity generation is the major driver of overall demand for the fuel. And, as the chart below shows, the future trajectory of global coal use depends on the balance between rising demand in Asia and the decline of coal in Europe and North America.
By the time China started its coal-fuelled boom in the 2000s, it was already the world’s single-largest user of the fuel (red line). Growth in India (orange) has been much less dramatic, overtaking the EU in 2009 (dark blue) and then the US only in 2015 (light blue).
Now, for the first time in 2019, the EU’s coal demand has also been overtaken by that of south-east Asia (purple), where consumption rose by 14% last year. This leapfrogging has been aided by declines in EU coal use, down another 18% last year, while the US also saw a 15% fall.
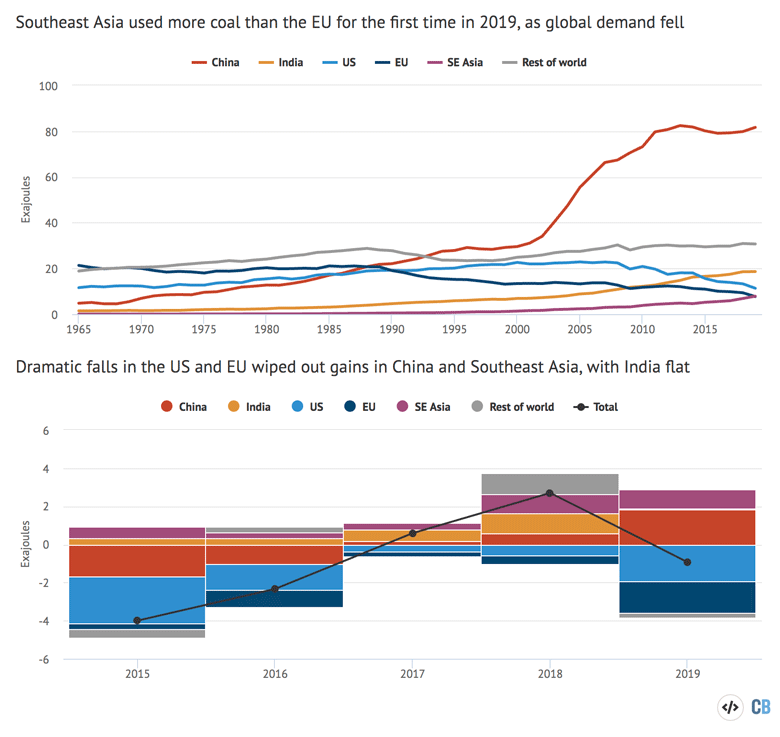
South-east Asia’a two major users, with the fastest-growing fleets of coal-fired power stations, are Indonesia and Vietnam, where demand increased by 20% and 30% in 2019, respectively.
Nevertheless, the future trajectory of coal still depends first and foremost on China, where internal debate continues over whether to build hundreds of new coal plants during the next five-year plan.
Any expansion of Chinese coal capacity would come despite extensive overcapacity and financial distress in the sector, the country’s own climate targets, plus the fact that a renewable-led electricity system would cost less money, according to recent research.
Recent moves by Beijing are the first signs of central government pushback against provincial plans to greatly expand coal capacity, but the debate is far from settled.
India’s plans to continue growing its own coal fleet face similar challenges, with the sector having taken the brunt of reduced demand – and lower revenues – during the coronavirus lockdown. Here, too, there is strong internal debate over whether to support the coal industry or not.
-
In-depth: BP data reveals clean electricity matched coal for first time in 2019
-
In-depth: BP data reveals renewables were fastest growing energy source in 2019