Six charts show UK’s progress on low-carbon energy slowing down
Simon Evans
07.31.17Simon Evans
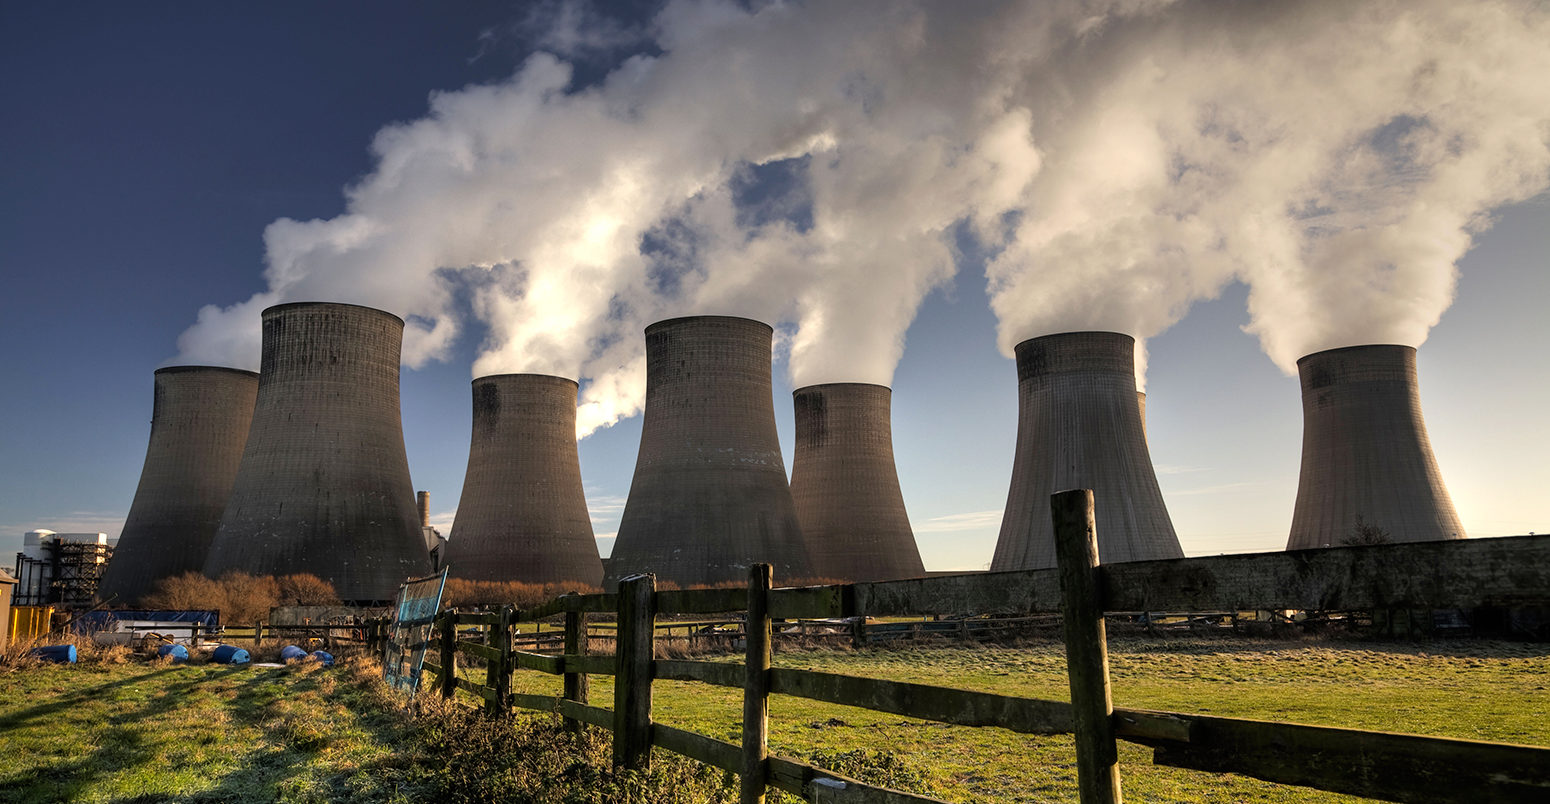
31.07.2017 | 2:01pmCoal supplied less than 10% of UK energy in 2016, probably its lowest share in hundreds of years. Yet progress in cutting demand and growing low-carbon sources of energy stalled.
These are some of the key messages in this year’s Digest of UK Energy Statistics (DUKES), published on 28 July by the Department for Business, Energy and Industrial Strategy (BEIS).
Carbon Brief has six interactive charts showing how UK energy use changed last year.
Falling demand
Fossil fuels supplied 81.5% of the UK’s primary energy in 2016, down by just half a percentage point compared to 2015. However, this is still a record-low share for the modern era. It should also be viewed in the context of falling demand for energy, down 1.4% in 2016. This is 18% below the 2005 peak.
The decline of coal has been particularly dramatic, falling a record 51% last year. Coal supplied just 6.4% of UK primary energy in 2016, down from 19.7% five years earlier and 47% in 1970.
Coal supplied close to 100% of the UK’s fossil energy supplies for hundreds of years until oil use took off in the early 20th century. Views differ on the contribution from biomass and animal power, making comparisons difficult. One estimate says only 6% of UK energy in 1820 came from coal, with biomass making up the remainder. Another estimate suggests coal use made up at least 10% of UK energy supplies as early as the 1500s.
Gas use was up 13%, as it replaced coal in the power sector, while oil use increased 1% (see below for more details). Overall, fossil fuels declined again, falling to a quarter below 2005 levels.
The share of renewable sources grew to 10% of UK energy needs, while nuclear remained the single largest low-carbon source, supplying 8% of UK energy.
It’s worth adding that these figures are for primary energy use, in other words energy inputs. This means that fossil fuels’ contribution to useful final energy services is exaggerated, as much of the primary energy they contain is wasted during combustion (see below).
Rising demand
Despite falling primary energy demand, final energy use across the UK economy increased last year. The largest increases came from homes and transport, as the chart below shows.
Energy demand has fallen, in part, as a result of energy efficiency improvements in appliances, buildings and vehicles. For homes, this progress risks stalling, given the large drop in the number of efficiency measures being added through government policy support.
Successful efforts to cut the amount of energy wasted in the UK economy are key to meeting carbon targets at lowest cost. There is still plenty of scope to make improvements, yet the government lacks a clear strategy to get there, according to the Committee on Climate Change.
Transport energy demand has now increased for three years running. This extra energy has come chiefly from higher diesel use in cars and vans, while a long-term switch away from petrol use continues. However, in the wake of the ‘dieselgate’ scandal, diesel sales are dipping, down 10% year-on-year, while sales of electric and hybrid vehicles grew by more than a quarter.
The number of miles driven in the UK has been increasing on the back of cheaper pump prices and the rise of home deliveries.
Domestic energy demand has been falling for a number of years, helping push bills below the levels seen in 2008. However, home energy use rose in the last two years, largely as a result of cooler temperatures.
Cleaner power
Reductions in electricity demand have also stalled over the past few years. Again, this is partly due to cooler temperatures in 2015 and 2016, compared to 2014, which saw record heat in the UK.
Within this total, the UK’s electricity supplies have been getting cleaner, in particular, as a result of coal’s decline. Last year, coal generated just 9% of the UK total, after a 60% reduction in output and the closure of three coal plants. As Carbon Brief first reported in January, coal’s 9% contribution was less than wind.
Note how the combined generation from coal and gas declined slightly last year, continuing the trend of more significant reductions across the years since 2010. The share of generation coming from renewables and nuclear remained relatively static, at 46% last year, similar to the 2015 figure.
Wind wobble
The lack of progress for renewable electricity last year was down to lower wind speeds and less favourable conditions for hydro. After 2015, which saw the highest wind speeds for 15 years, onshore windfarms’ output fell 8%, and offshore windfarms’ output fell 6%, more than offsetting a 13% increase in capacity.
In contrast, solar power output climbed 38% in 2016, with solar output surpassing coal during the half year from April through September.
Last year also saw recent rapid growth in biomass power levelling off. Drax, formerly the UK’s largest coal plant (it remains joint largest), has now finished converting half its units to burn wood pellets. It is considering converting one more unit, but has yet to secure a subsidy deal.
Extracting fossils
Alongside the decline in demand for coal, UK domestic mining output has also fallen. Last year, coal output fell a further 51%, leaving it down 90% since 1998 at an all-time low of 4m tonnes. The UK’s last three deep mines – Hatfield, Thoresby and Kellingley – closed in 2015. There are just a few surface sites remaining, employing 831 people across the UK (including contractors).
In contrast, the UK’s oil and gas sector has raised its production for the second year running. Oil output increased by 5%, and gas by 2%, despite investment virtually halving since 2014. The industry remains in longer-term decline. It faces significant challenges as it begins to decommission its ageing North Sea infrastructure and becomes a net drain on the UK exchequer.
Energy flows
Most of the information described above, and more, is summarised in the single animation, below, which Carbon Brief has produced from DUKES energy flow charts for 2012-2016. This animation shows at a glance how the UK’s energy inputs and outputs have changed in recent years. (Click to enlarge the animation.)
On the left, you can see energy inputs to the UK economy from coal, oil, gas, nuclear, renewables and bioenergy. For coal, oil, gas and bioenergy, lighter shades indicate imports and darker shades domestic supplies. Nuclear is light pink, while electricity imports and renewables are dark pink.
This leftmost part of the graphic shows the collapse in UK coal use, with the black lines shrinking dramatically. This is easily the most obvious and striking change in UK energy use over the past five years. You can also see the rise of renewables and bioenergy, as the dark pink and orange input lines get fatter.
Continuing from left to right, energy inputs flow through the economy, with energy exports dropping out of the chart in the bottom-left corner. On the right, the chart show final energy from different sources being consumed by industry, homes, transport and business.
In the centre, power stations and oil refineries, shown in yellow, convert energy inputs into petroleum products and electricity. Note here the large “conversion losses”, shown in grey, dropping off the chart as wasted energy. You can see this grey line shrinking over time, as UK electricity supplies switch from inefficient coal-fired power to more efficient gas, as well as renewables.
A shift away from fossil fuels, particularly coal, is one reason UK primary energy demand has been falling (the first chart, above). For similar reasons, primary demand will fall further if transport energy moves increasingly towards electric vehicles, given the planned ban on sales of petrol and diesel cars in 2040, while still providing the same final energy services as before.
-
Six charts show UK's progress on low-carbon energy slowing down
-
Coal supplied less than 10% of UK energy in 2016