
The Carbon Brief Profile: Australia
Politics
Australia’s economy ranks 13th globally in terms of gross domestic product (GDP), just after Russia and South Korea. Its population sits at 25 million – 53rd in the world – and is projected to increase to 33 million by 2050. The country has recently witnessed political turbulence, with five changes of prime minister over the past decade. The current government has been in power since 2013 and is formed of a longtime alliance between the right-leaning Liberal and National parties (L/NP), together known as the “Coalition”. The Liberal prime minister Scott Morrison has held office since August 2018. He was preceded by Malcolm Turnbull from 2015-2018 and Tony Abbott from 2013-2015, both Liberals. The left-leaning Labor party (ALP) was in power from 2007 to 2013 under Kevin Rudd and Julia Gillard. The country will return to the polls this year. The date is flexible, but widely expected to be in May. Opinion polls generally show a projected win for Labor, now led by Bill Shorten. Climate change policy has a long and complex history in Australia and has been highly politicised. Some polls show it as a top issue among voters in the federal election. Tens of thousands of Australian schoolchildren recently joined the global school climate strikes. Around 58% of Australians consider climate change a “major threat” to their country, second only to the 59% who considered ISIS a major threat, according to a 2017 poll from the Pew Research Centre. Another 2018 survey from the Australia Institute thinktank found 60% want coal-fired power to be phased out within 20 years. The same survey found 73% of people are concerned about climate change, a five-year high.
Paris pledge
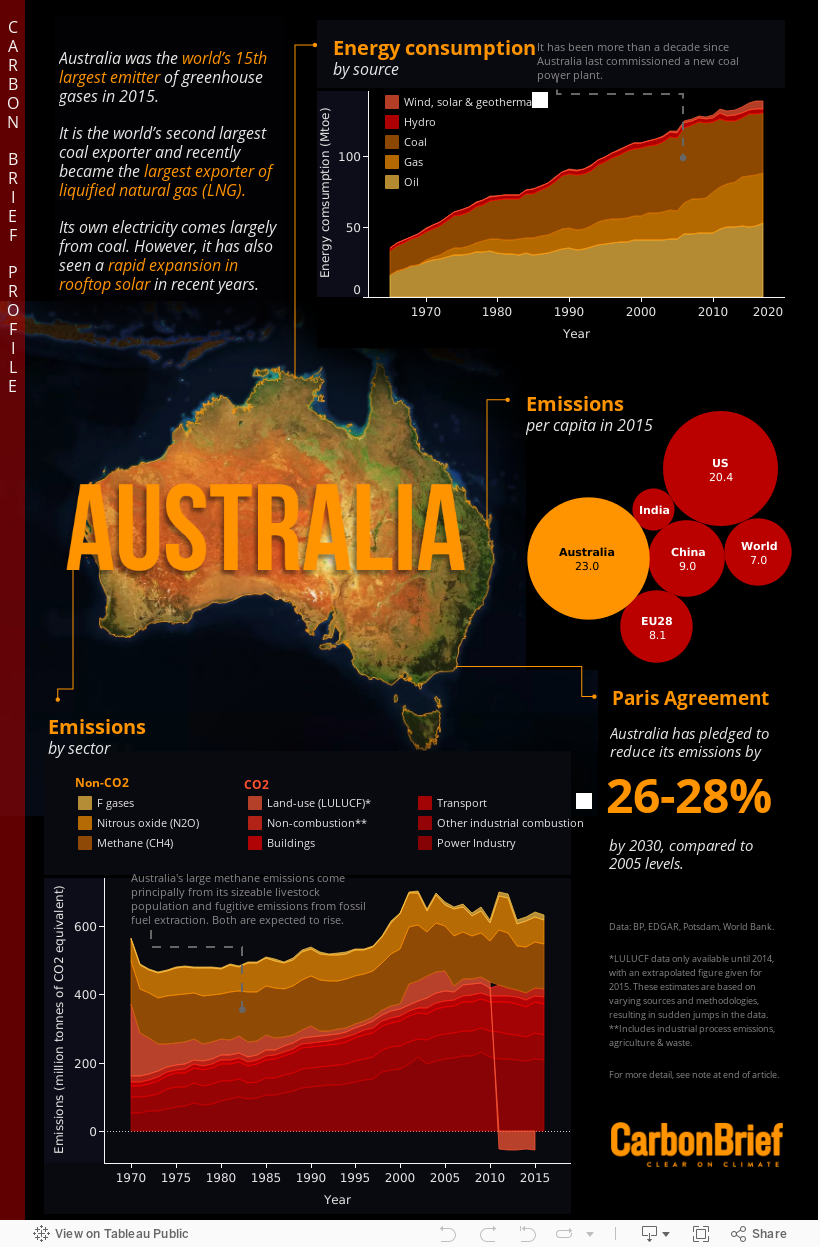
Australia’s annual greenhouse gas (GHG) emissions stood at 550m tonnes of CO2 equivalent (MtCO2e) in 2015 including land-use and forestry (LULUCF), according to data compiled by the Potsdam Institute for Climate Impact Research (PIK). (See “note on infographic” at the end of this article for details of this data. Note that LULUCF emissions were negative in 2015). Emissions excluding LULUCF have almost doubled since 1970. They peaked at 700MtCO2e in 2011 and stood at 630MtCO2e in 2016. In August 2015, Australia submitted its climate pledge towards the Paris climate talks. This “nationally determined contribution” (NDC) came under Liberal prime minister Tony Abbott. The pledge promised a 26-28% emissions reduction by 2030 compared to 2005 levels, including land use. This is equivalent to a 22–25% cut below 1990 levels including land use, but a 3-6% rise when land-use emissions are excluded. This sector is a net sink in Australia. The pledge says the target is “comparable to the targets of other advanced economies” and that Australia will achieve the upper 28% of its target “should circumstances allow”. It adds:“This effort takes account of Australia’s unique national circumstances, including a growing population and economy, role as a leading global resources provider, our current energy infrastructure, and higher than average abatement costs.”
The government’s independent advisors, the Climate Change Authority (CCA), had previously recommended a target of a 40-60% cut in emissions by 2030 compared to 2000 levels. Australia’s pledge represents only a 19-22% cut on emissions in 2000. The main policy outlined in Australia’s climate pledge was its Emissions Reduction Fund (ERF) (see more in the next section) and a scheme to source 23% of electricity from renewables by 2020. Several post-2020 policies were under development, it said, including a plan for a 40% improvement in energy productivity – the amount of energy needed to generate each unit of GDP – between 2015 and 2030. Australia’s per-capita emissions stood at 23tCO2e in 2015, according to PIK and World Bank data, around nine times those of India and more than three times the world average of 7tCO2e. Australia says its pledge represents a 50-52% cut in per-capita emissions by 2030, compared to 2005 levels. The 28% by 2030 pledge would see per-capita emissions fall to 16tCO2e in 2030, from 31tCO2e in 2005, according to PIK data and UN population projections. The pledge is rated as “insufficient” by Climate Action Tracker (CAT), an independent analysis by three research organisations. “If all government targets were within this range, warming would reach over 2C and up to 3C,” it says. There is disagreement over whether Australia is on track to meet its climate targets. According to CAT, a current lack of policies means it will not meet the targets within its pledge and is actually on a trajectory in line with 3-4C warming. CAT adds:“To meet its ‘insufficient’ 2030 emissions targets, Australian emissions should decrease by an annual rate of 1.5-1.7% until 2030; instead, with current policies, they are set to increase by an annual rate of around 0.3% per year.”
Climate Transparency, a research and NGO partnership, also says Australia’s GHG trajectory and NDC target are not compatible with the Paris goals. Policy is failing to address the need for structural change, with effective policies missing in every sector, it says. In contrast, a recent analysis from the Australian National University finds the Paris target will be met five years early, though its findings are disputed. In December 2017, a government review said Australia was “on track” to meet its target.
Climate policy
Over the past decade, several flagship climate policies have been announced and then adjusted or cancelled, including a scrapped economy-wide carbon tax. The current policy void means the next government could make a large difference to Australia’s emissions. In August 2018, Malcolm Turnbull removed an emissions reduction target for the power industry from his main proposed energy policy – the national energy guarantee (NEG) – due to pressure from his party’s rightwing. This same group later ousted him as prime minister, with Scott Morrison taking the helm and dropping the NEG altogether.
“Our government will take, and is taking, meaningful, practical, sensible, responsible action on climate change without damaging our economy or your family budget.”
In its latest budget, published earlier this month, the Morrison government said this new AUS$2bn of funding would need to last for 15 years, instead of 10 as initially proposed. The opposition Labor party’s climate change plan would raise Australia’s emissions reduction target for 2030 from a 26-28% to a 45% cut on 2005 levels. Labor leader Bill Shorten has called climate change “a disaster”. His party would bring in a new emissions trading scheme and target “net zero pollution” by 2050. In an effort to create cross-party consensus, Labor still supports the NEG and its emissions reduction mechanism, both dropped by the Liberals. The party would also raise the emissions reduction target. In the event this compromise fails, Labor has outlined a AUS$15bn (£8bn) plan to cut emissions in the energy system. Of this, AUS$10bn (£5.4bn) will go to the government-owned green bank Labor established in 2012, including for a AUS$1bn (£540m) plan to begin exporting hydrogen. It recently ruled out taxpayer support for new coal power plants. Australia’s Green party – which could hold the balance of power in the senate after the elections – has also announced a host of climate policies. These include 100% renewable electricity by 2030, bans on new fossil fuel extraction and a phaseout of coal exports by 2030, in favour of renewable exports such as “solar fuels”. Regional climate ambition in Australia is generally far stronger than at the federal level. All states and territories, bar Western Australia, have strong renewable energy targets, net-zero emissions targets, or both. South Australia is targeting net-zero emissions by 2050.Coal
In 2017, 61% of Australia’s electricity came from coal, as the chart below shows. However, coal power output has fallen from a peak in 2006, due to the rising use of gas and renewables. Around a third of Australia’s greenhouse gas emissions come from the power sector. Electricity generation in Australia by fuel, 1985-2017 (terawatt hours). Source: BP Statistical Review of World Energy 2018. Chart by Carbon Brief using Highcharts. As of January 2019, Australia has 24 gigawatts (GW) of operating coal plants, the world’s 11th largest fleet, according to the Global Coal Plant Tracker. It has been 10 years since a new coal power plant was commissioned and 9GW of planned capacity has been shelved or cancelled since 2010. There are currently no new coal plants in the pipeline. Nine coal power stations have been retired over the past five years in Australia, says CAT. Much of Australia’s coal fleet is ageing, posing questions over where the country will source its electricity in future. The risk of summer blackouts – a major political issue – could grow as old coal plants become less reliable and higher temperatures increase peak demand. The government is considering committing support for new coal power investment before the election, urged on by some factions of the ruling party. According to one assessment, Australia already has some of the world’s highest fossil fuel subsidies per capita. Natural resources, including coal and metals such as iron ore, uranium and gold, are a major part of Australia’s economy. They account for 8% of GDP and 70% of exports. Australia mined 500m tonnes of coal in 2017, making it the world’s fourth largest producer after China, India and the US, and just ahead of Indonesia. Mines are located mainly in Queensland, New South Wales and Victoria.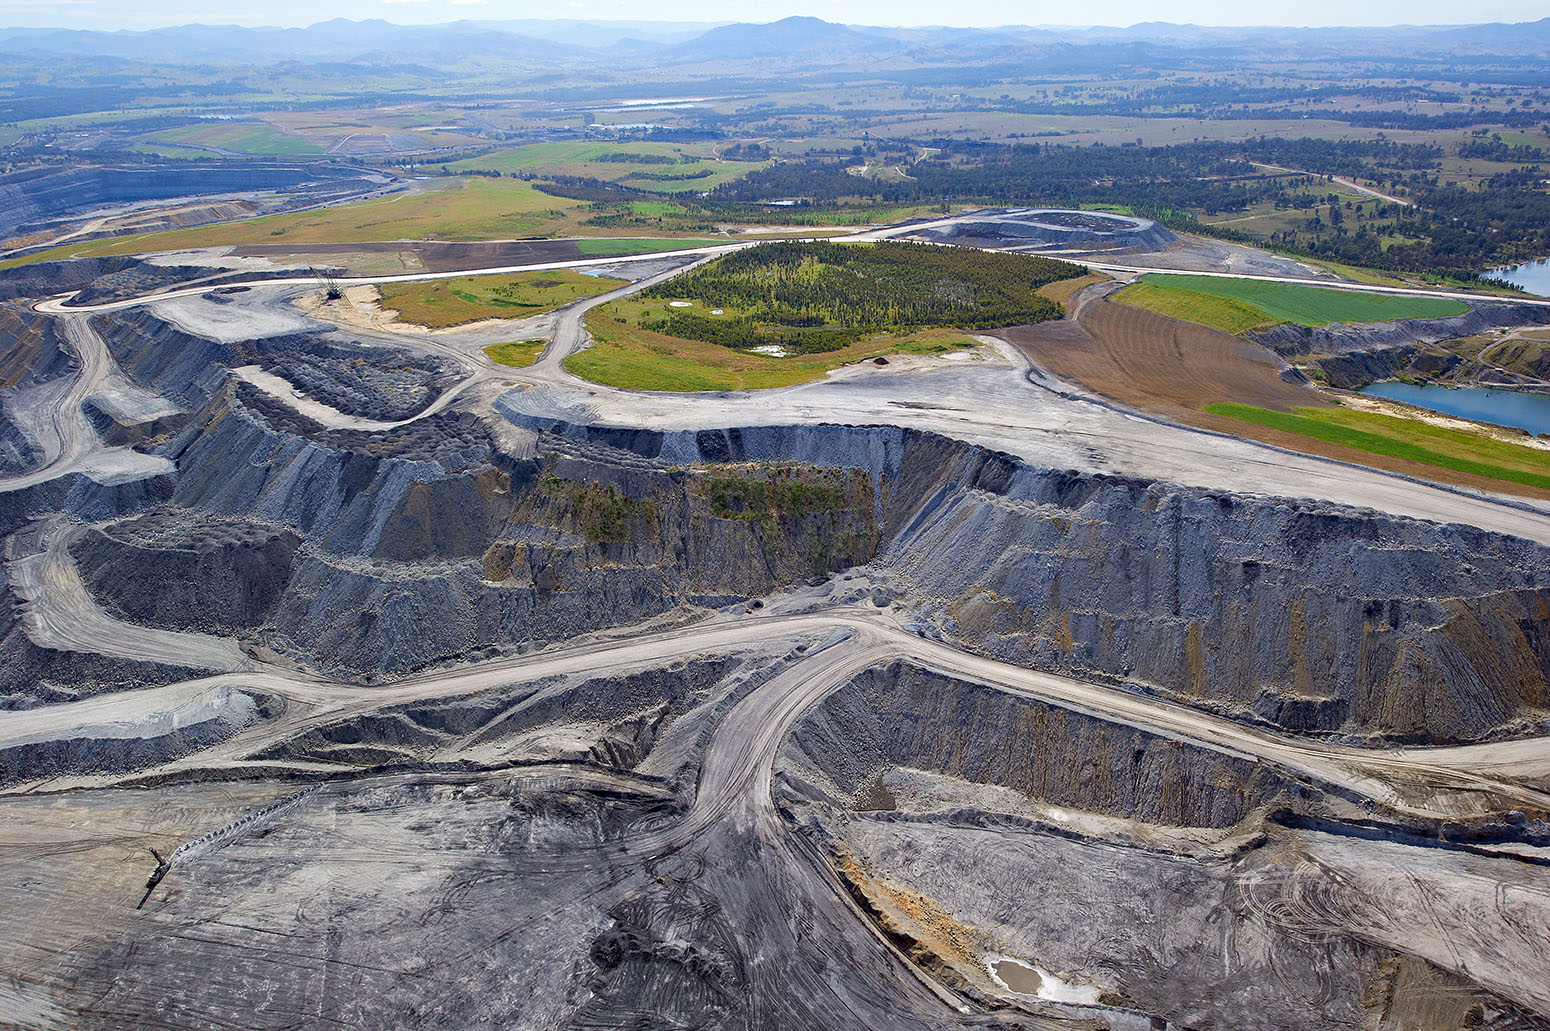
Renewables
Australia’s renewable capacity has increased rapidly over the past decade. By 2017, production from renewables other than hydro had more than tripled on 2007 levels, providing 10% of electricity. Australia has one of the highest rooftop solar rates in the world: a fifth of all households have it installed, rising to a third in some states. It provides around 4% of Australia’s electricity. Solar farms are also on the rise from an almost non-existent base five years ago. The country currently has more solar farms under construction than its total solar farm capacity. More than a million solar water heaters are installed on around an eighth of homes, while South Australia is set to build the world’s largest solar thermal plant.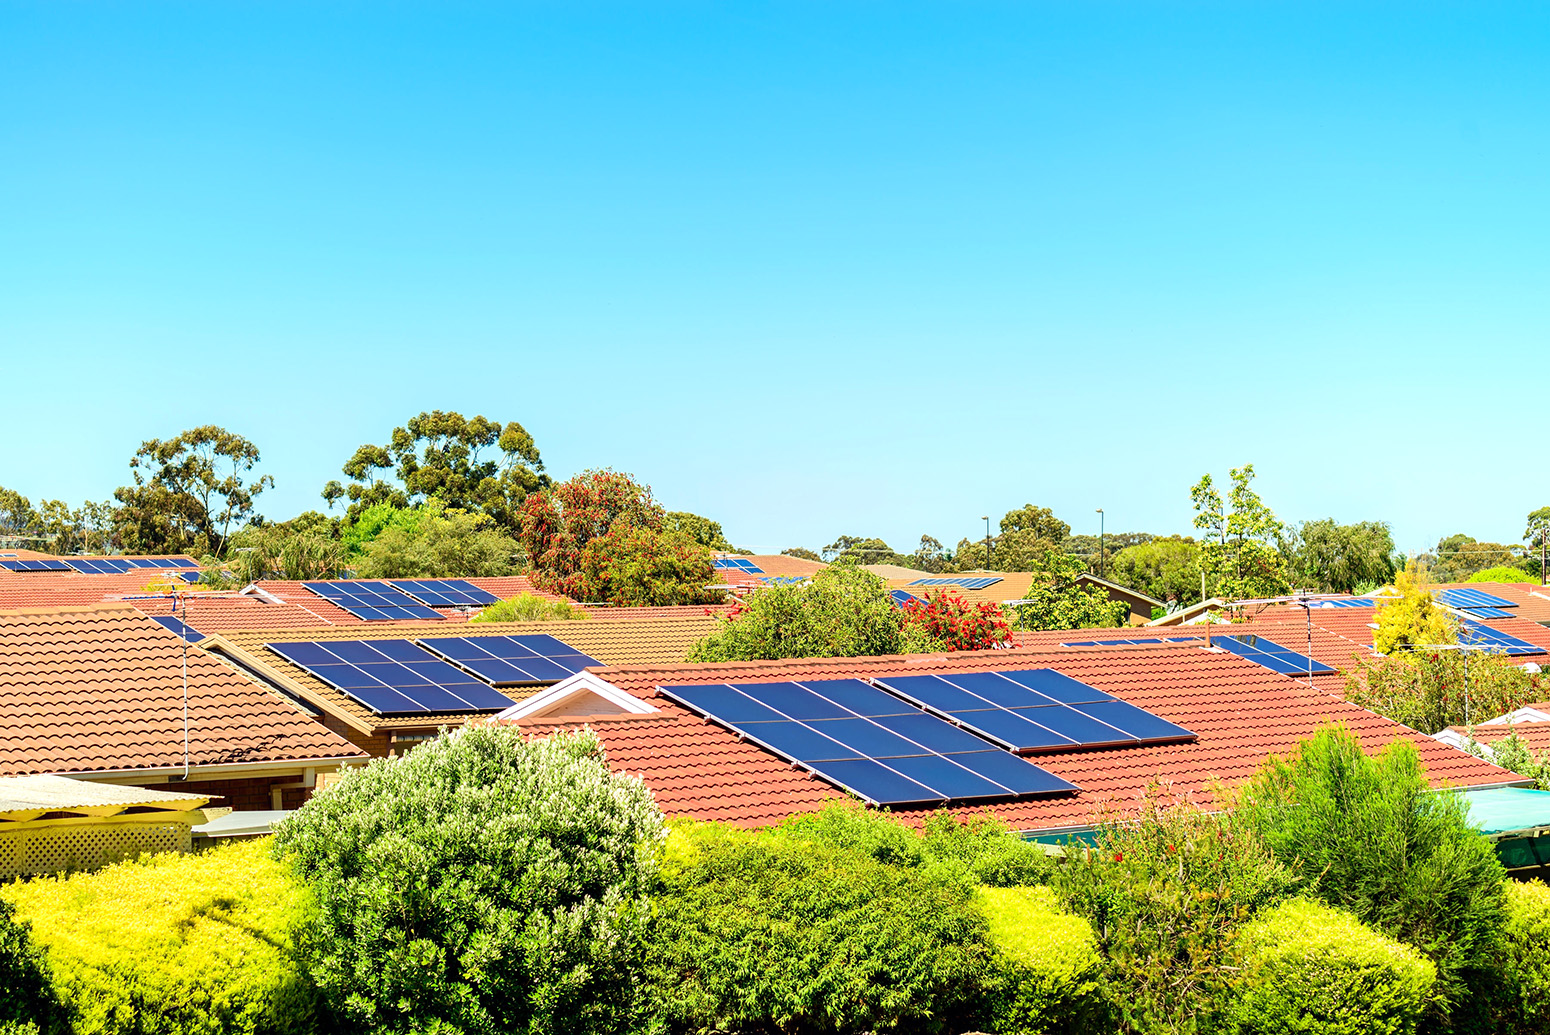
Oil and gas
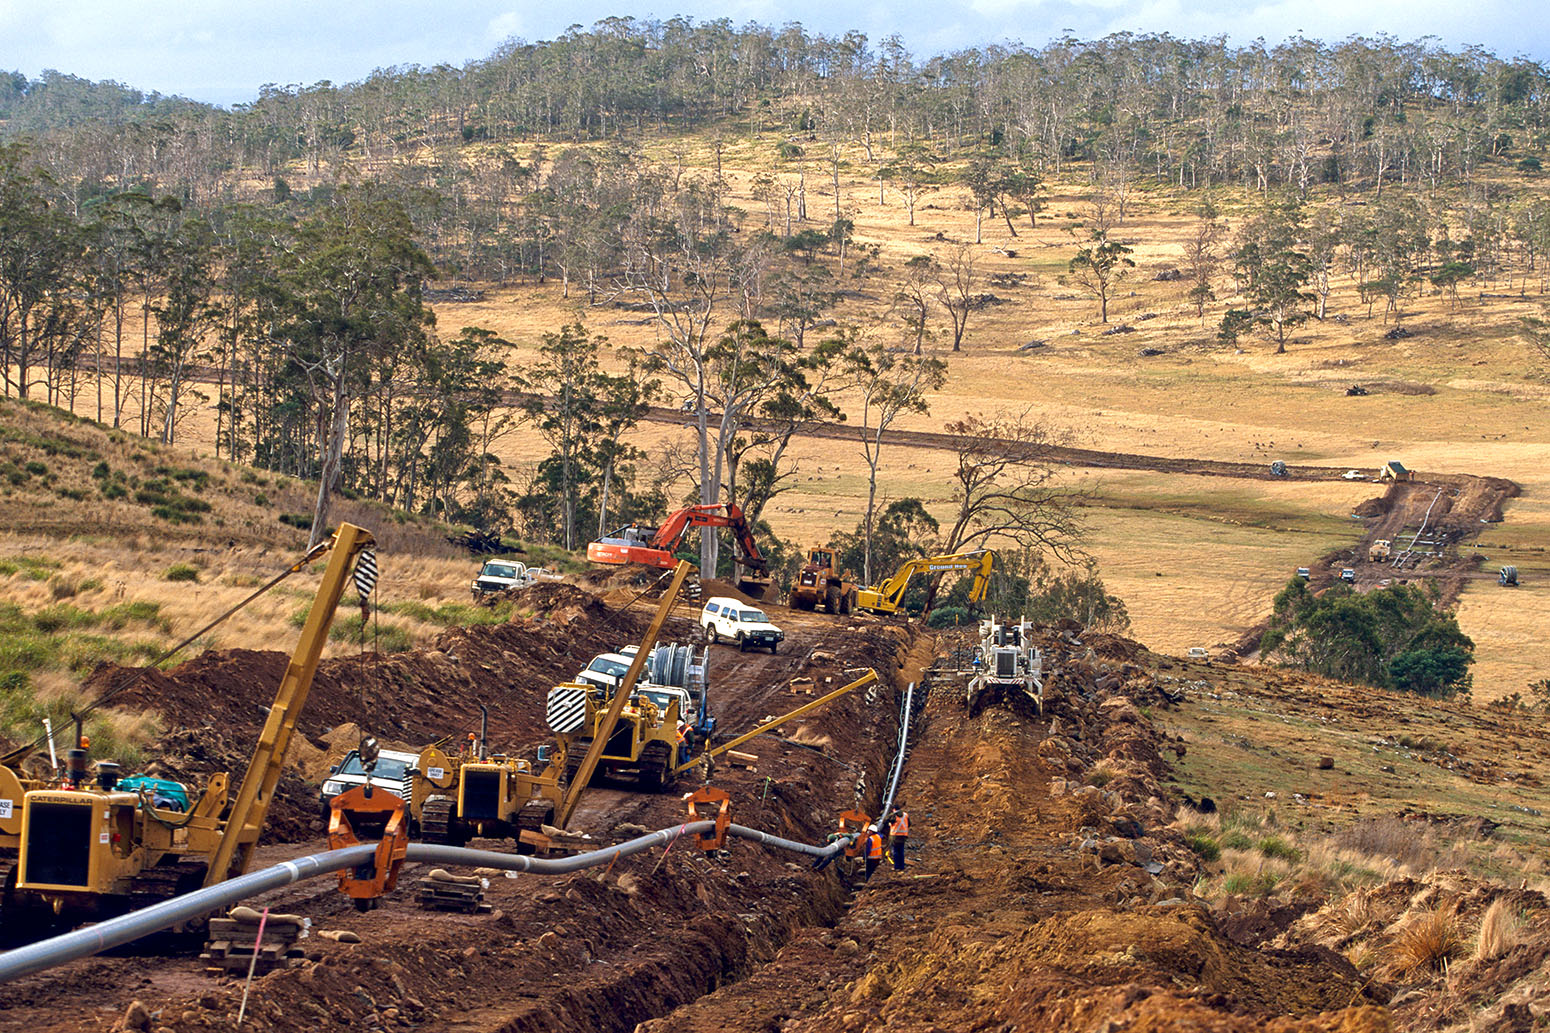
Australia has widespread gas resources both on and offshore, particularly off the north-west coast. It also has high onshore unconventional gas resources.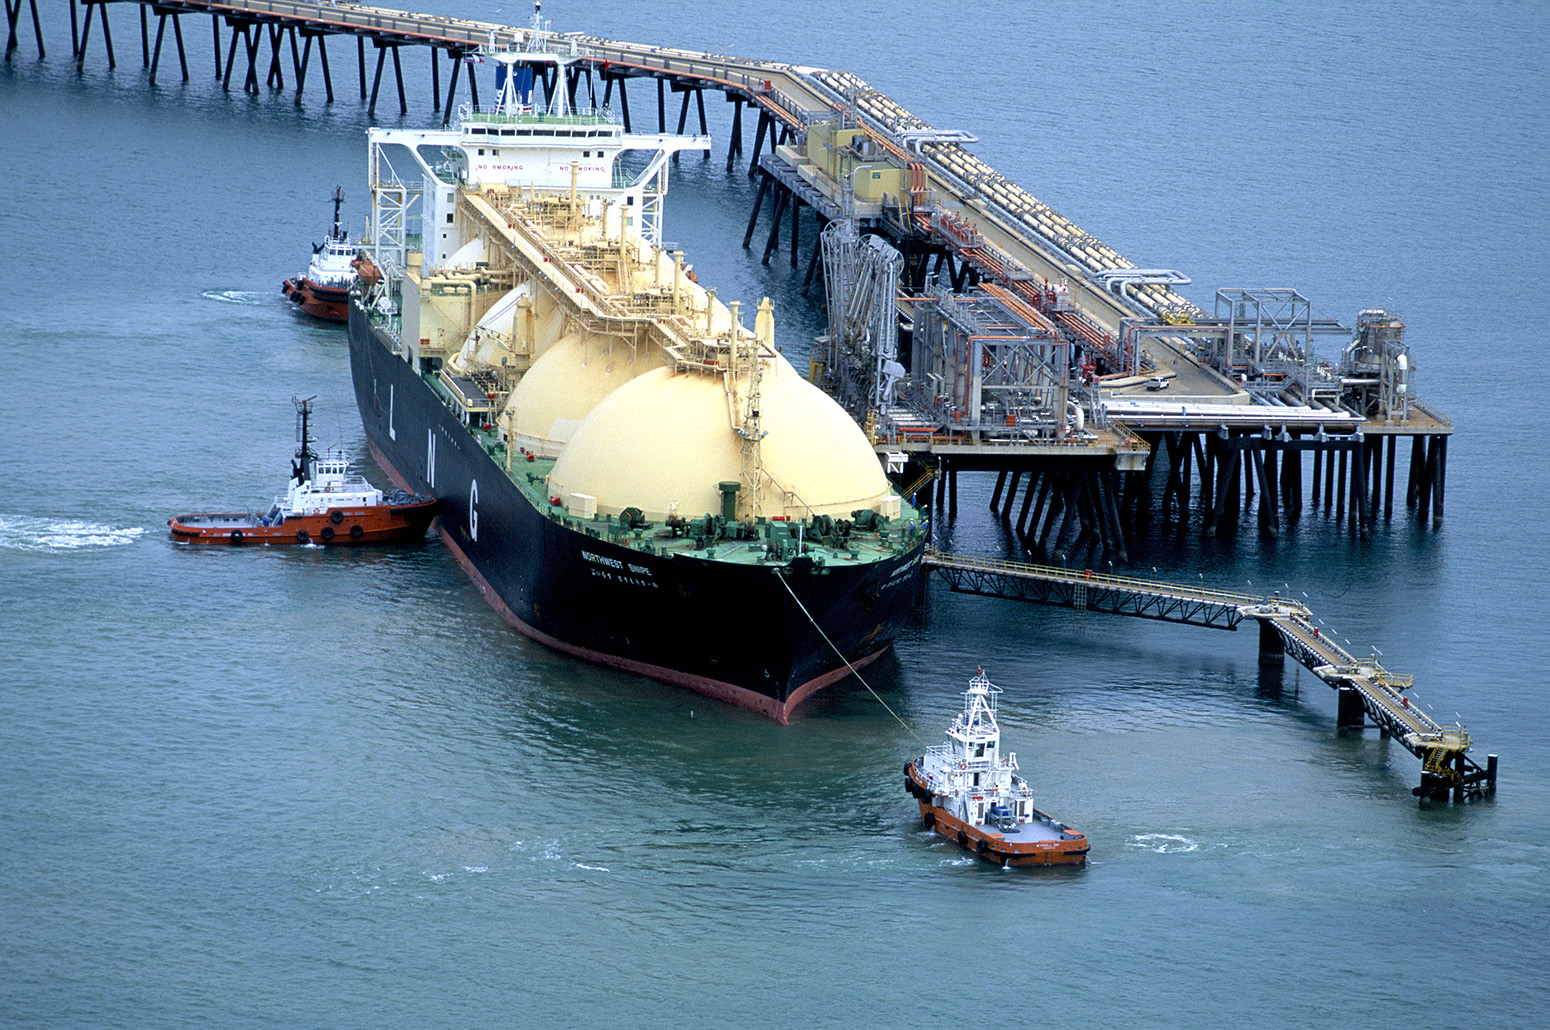
Transport
Transport accounts for 14% of Australia’s emissions. The government expects the sector’s emissions to increase over the next decade. Unlike 80% of the global market, Australia has no mandatory fuel-efficiency standards. Previous proposals were cut down by the ruling coalition after lobbying from industry. It also lags behind other countries in the rollout of electric vehicles (EVs). Just 2,300 were sold in 2017, according to Australia’s EV trade body, or 0.2% of total motor sales. There are small incentives for lower emissions cars. A recent senate select committee report outlined options to increase EV uptake, including consideration of a national target. In February, the government released a one-page EV strategy that still lacks support measures, according to critics. Labor recently proposed a national EV target of 50% new car sales by 2030, as well as fuel emissions standards for conventional vehicles. [contentbox id=”29536″]Agriculture and forestry
Australia has large agricultural emissions, principally due to methane released from its large livestock population. The country has around 26m cows, 2.2m pigs and 65m sheep. Nitrous oxide released from fertilised soils is also a large contributor.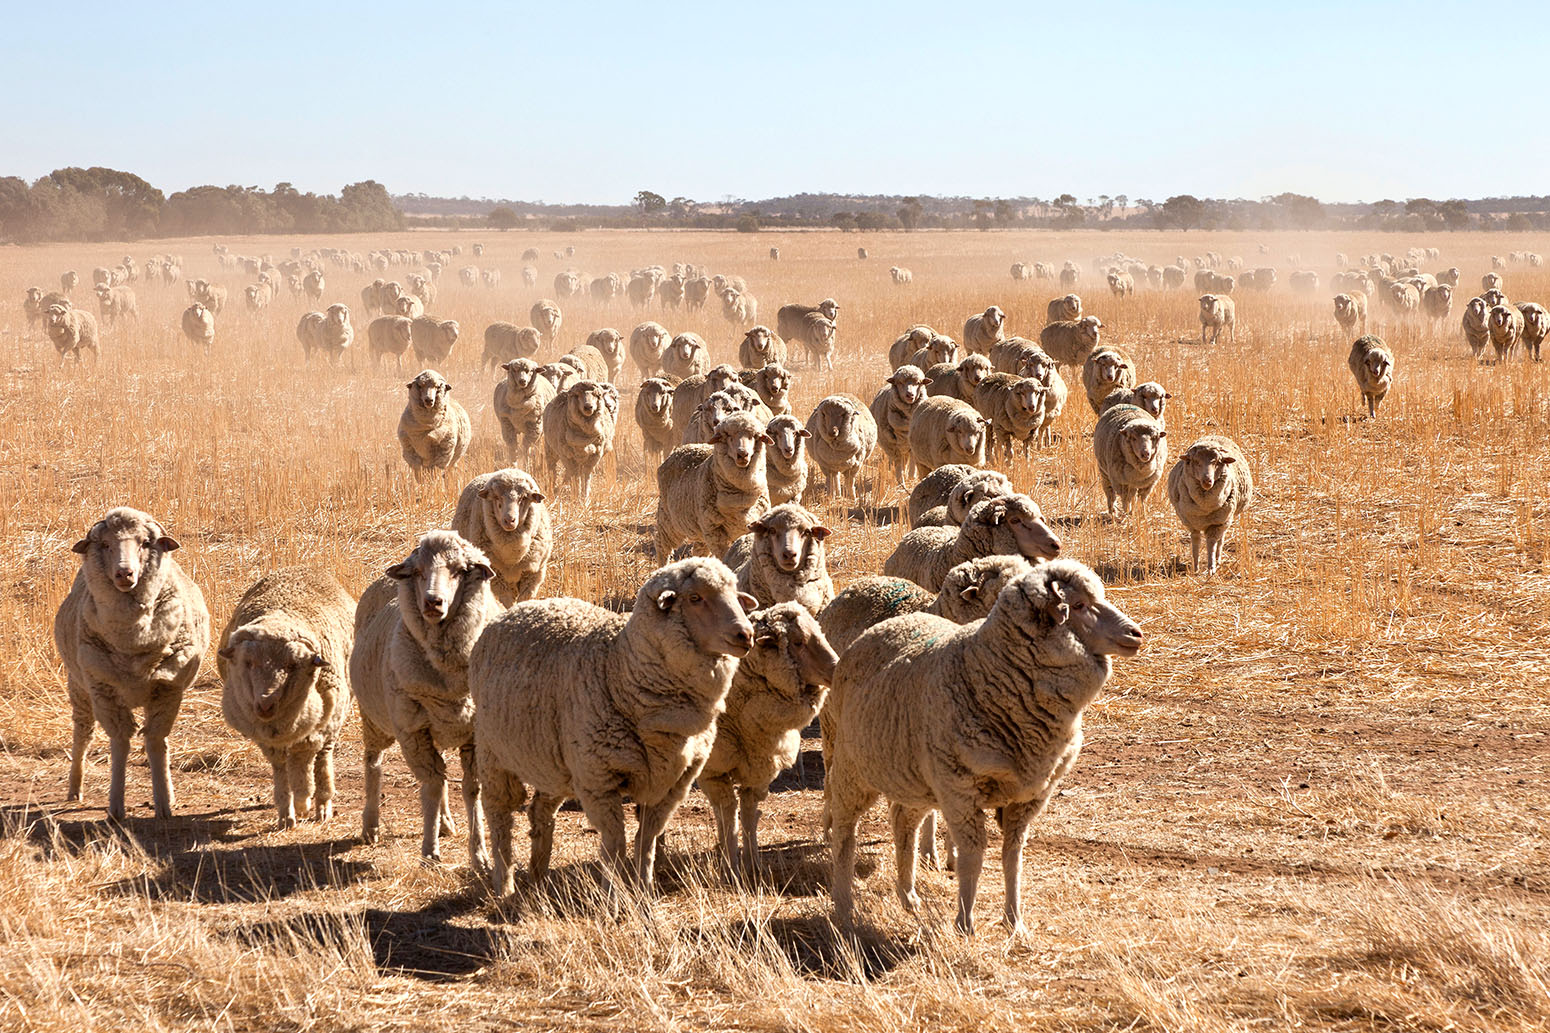
Climate laws
Australia’s CCA is a statutory body established in 2011 to advise the government on climate targets and policy. It is modelled closely on the UK’s Committee on Climate Change (CCC). All its proposals need to meet certain criteria, including being economically “efficient”, equitable and consistent with Australia’s trade objectives. Former prime minister Tony Abbott tried but failed to get rid of the CCA, though he did remove its advisory role on emission targets. The body has since shrunk significantly. In 2013, Abbot closed the Climate Commission, an independent science and public education body established by the government in 2011. However, it was resurrected as the Climate Council, a non-profit organisation, just days later. Meanwhile, a 2007 greenhouse and energy reporting act introduced a single national framework for reporting on emissions, in part to underpin any future emissions trading scheme. Australia’s renewable electricity target and ERF are also set in law, while a 2010 act obliges commercial buildings to disclose their energy efficiency when sold or leased.Impacts and adaptation
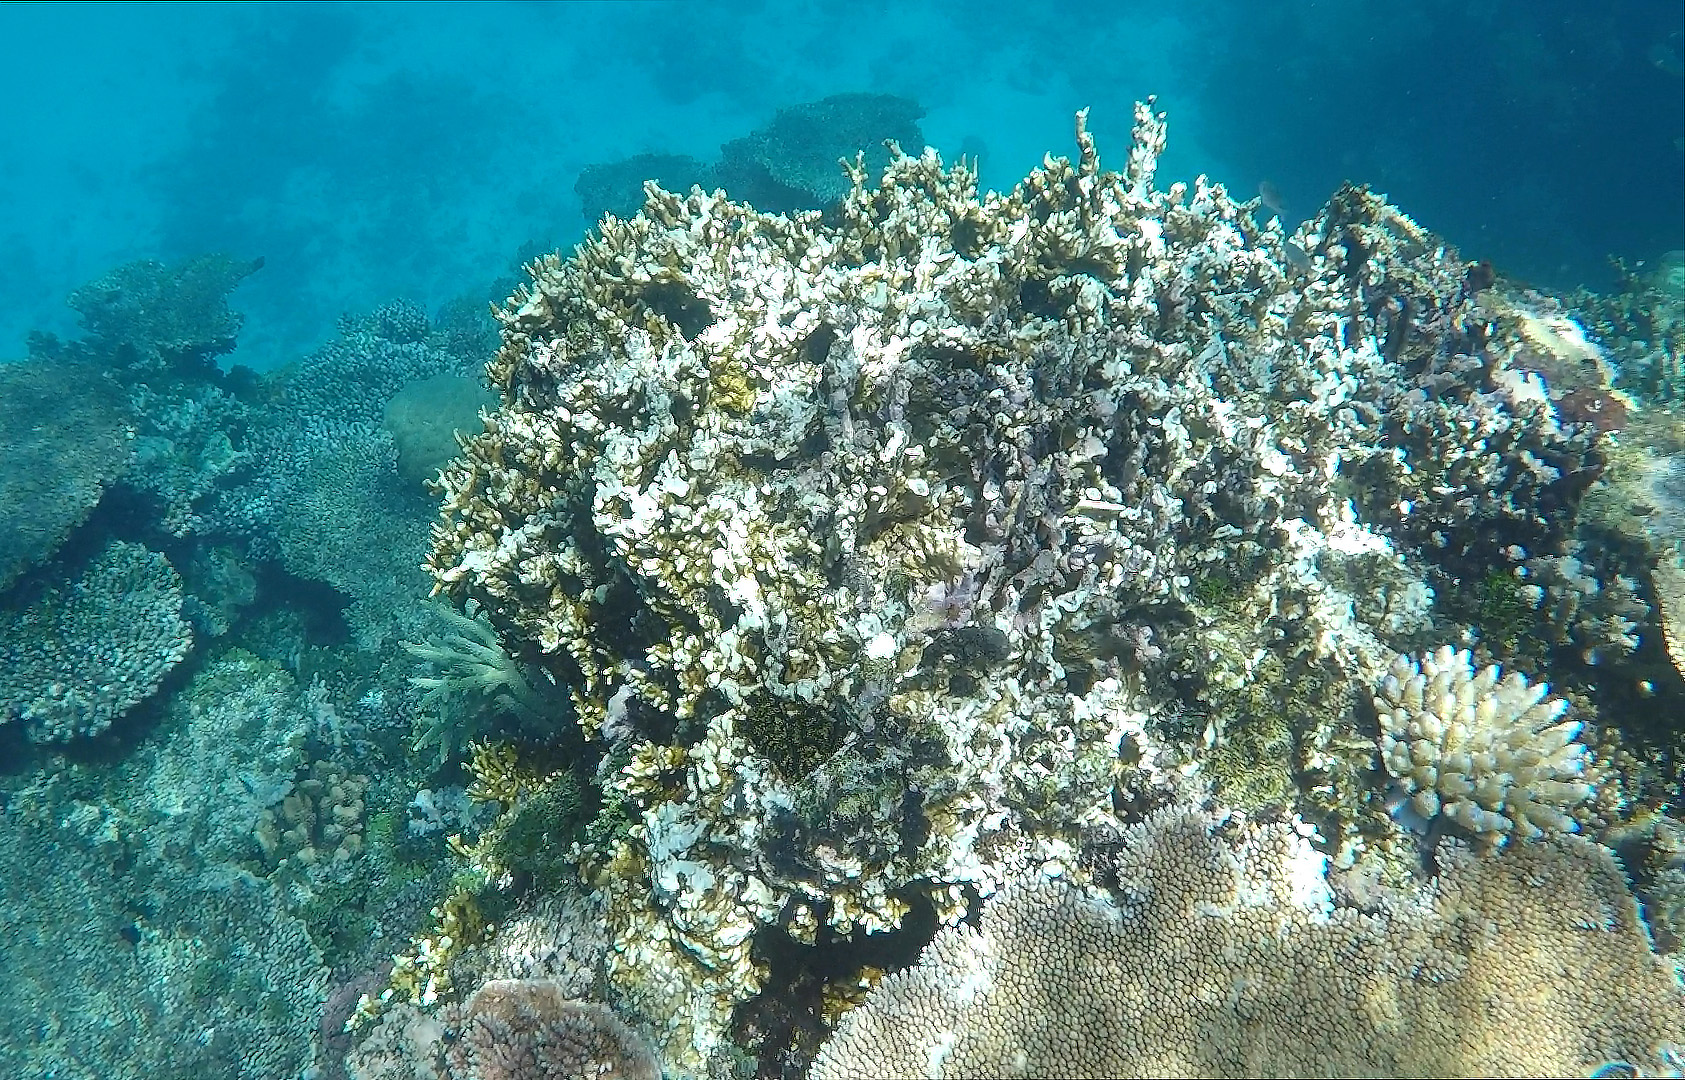
Australia is experiencing higher temperatures, more frequent and intense extreme heat events, and higher fire risk and drought conditions due to climate change, says the country’s 2017 national communication to the UNFCCC. “These changes in climate are expected to continue,” it adds. Annual mean temperatures in the country have already risen by around 1.1C since the late 1800s. They are expected to reach to 1.6-5.3C, depending on future emissions. This year, Australia experienced its hottest summer on record, with the national average temperature around 2.1C above the long-term average, as well as multiple other heat records broken. Long-term climate trends played a role in the heatwaves, its Bureau of Meteorology says. Drought is seen as a particularly serious issue in Australia. There are strong concerns about the Murray-Darling Basin in the southeastern interior, one of Australia’s most significant agricultural areas, which is already being affected by climate change. Rainfall patterns are changing and extreme storms, droughts and floods are becoming more frequent and intense, according to a recent paper by the region’s authority. The report came in response to three mass fish deaths at lakes within the basin, which a scientific panel concluded were caused by drought as well as over-extraction. A 2015 report from University of Melbourne researchers outlined how many of Australia’s major food commodities could be affected by climate change, from beef and dairy production to wheat and barley. Up to 70% of Australia’s winegrowing regions with a Mediterranean climate will be less suitable for grape growing by 2050, the report said.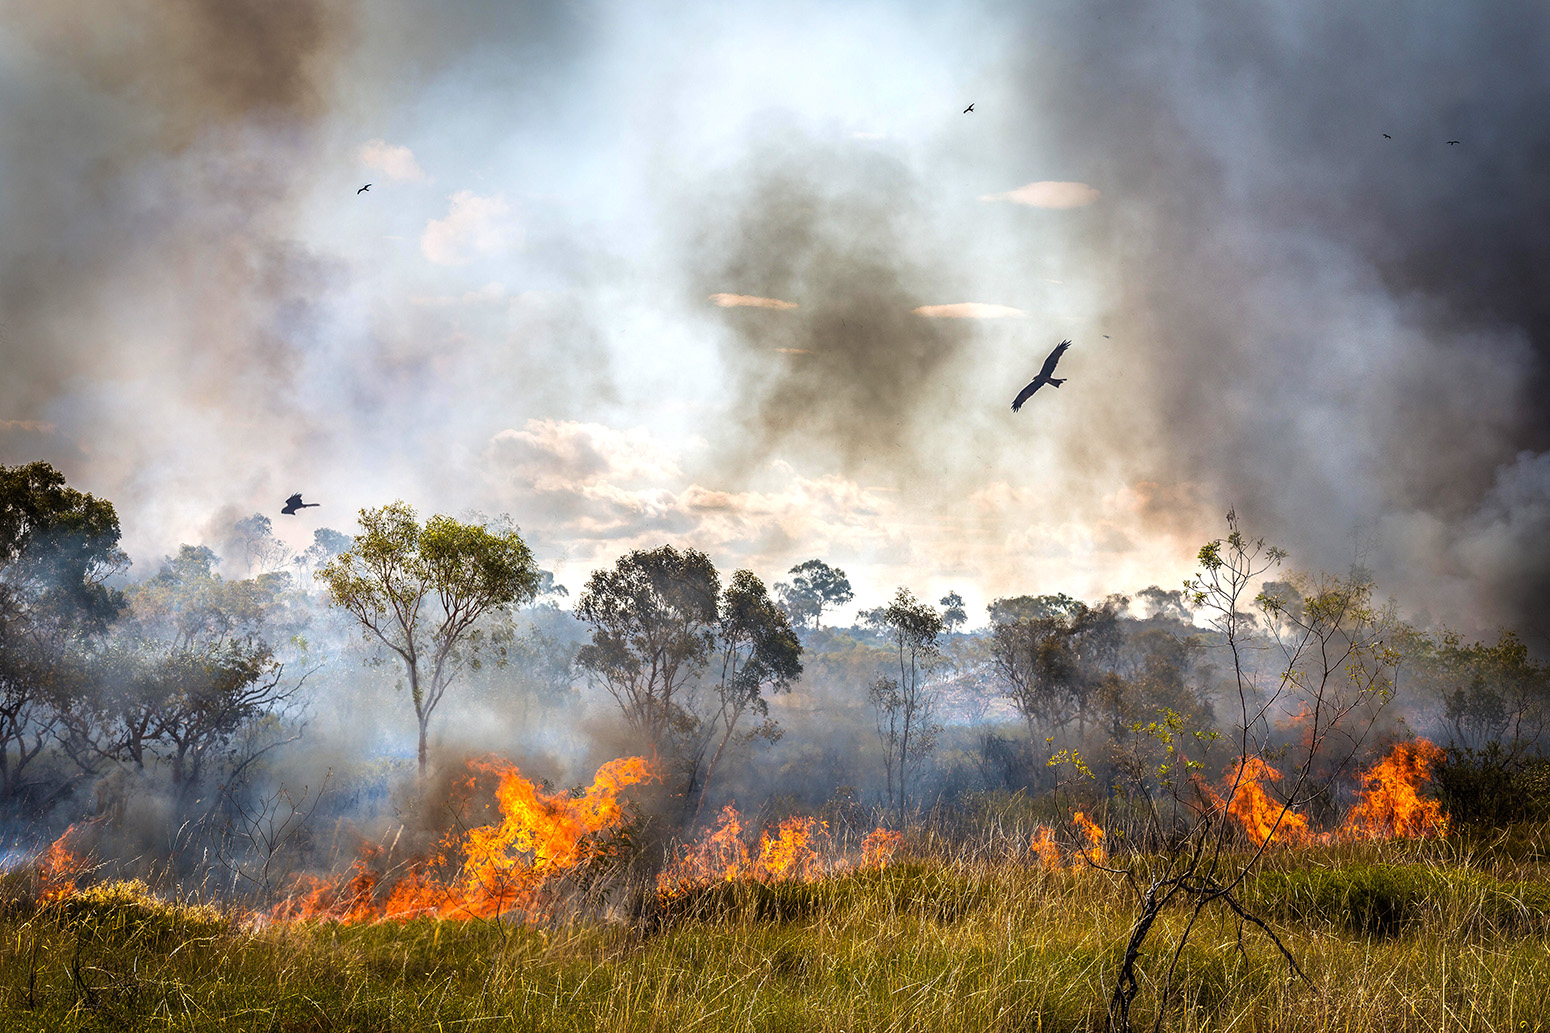
Article information
Note on infographic
Data for energy consumption comes from BP Statistical Review of World Energy 2018.
Data for greenhouse gas emissions by sector is a combination of two datasets compiled by the Potsdam Institute for Climate Impact Research (PIK) and EDGAR.
Values for methane (CH4), nitrous oxide (N2O) and fluorinated gases cover all sectors, including LULUCF, and come from the PIK primap database v2.0. Values for GHG emissions from LULUCF also come from the PIK primap database, however these are only available to 2015, and from the earlier v1.2 of the database. Note that LULUCF data for 2015 is an extrapolation made by PIK from previous years.
The remaining values come from the EDGAR CO2 emissions database, downloaded from the website OpenClimateData. The EDGAR categories described in full are as follows: Buildings (non-industrial stationary combustion: includes residential and commercial combustion activities); Transport (mobile combustion: road and rail and ship and aviation); Non-combustion (industrial process emissions and agriculture and waste); Industry (industrial combustion outside power and heat generation, including combustion for industrial manufacturing and fuel production); Power & heat (power and heat generation plants).
Combining GHG emissions in 2015 (bar LULUCF) from PIK primap database 2.0 database and LULUCF emissions in 2015 from PIK database v1.2 also shows Australia has the world’s 15th largest greenhouse gas emissions, including LULUCF, in 2015.
Per capita emissions in 2015 come from combining above 2015 figure for GHG emissions and Australia’s population in 2015 from the World Bank.
Australia’s pledge to reduce its emissions 26-28% below 2005 levels by 2030 comes from its NDC submitted to the UN in 2015.
Infographic by Tom Prater for Carbon Brief