As the year draws to a close, Carbon Brief takes a look at 2015’s top climate stories through the medium of numbers. Here are our top 15.
1.5C limit
Over the last 12 months, after years of taking the back seat, the idea of a 1.5C limit to global temperatures made steps into the limelight. The UN concluded its review of the 2C vs 1.5C debate, suggesting that the lower limit would be “preferable”. A study found that the 1.5C target was still technically possible, though difficult. A guest post by Prof Myles Allen looks at the chances and the challenge ahead, while Carbon Brief also captured the views of a broad range of scientists.
The mounting pressure paid off, with the goal recognised in the final UN climate deal. So unexpected was its inclusion that climate scientists were “caught napping”, says Prof Piers Forster, in another guest post which surveys the task ahead of finding pathways towards the lower limit, and the specific benefits of this long sought-after goal.
188 pledges
Over the course of the year, 188 countries submitted their “intended nationally determined contributions”, or INDCs, to the UN. These pledges, which outline how nations plan to reduce emissions, form the backbone of the new UN climate deal. Carbon Brief has been tracking these promises of action, and the money that they will cost to implement — a grand total of $3.5tn. We have also looked in-depth at the ambiguities and ambition of the major economies, including the EU, the US, Russia, Canada, China, Japan, Brazil, Indonesia, Australia and India.
Probably the most oft-repeated trope of 2015 was that these INDCs would not alone be enough to limit global temperature rise to below 2C. But according to a report from the UN Environment Programme, the INDCs had political significance that can’t be expressed by mere numbers.
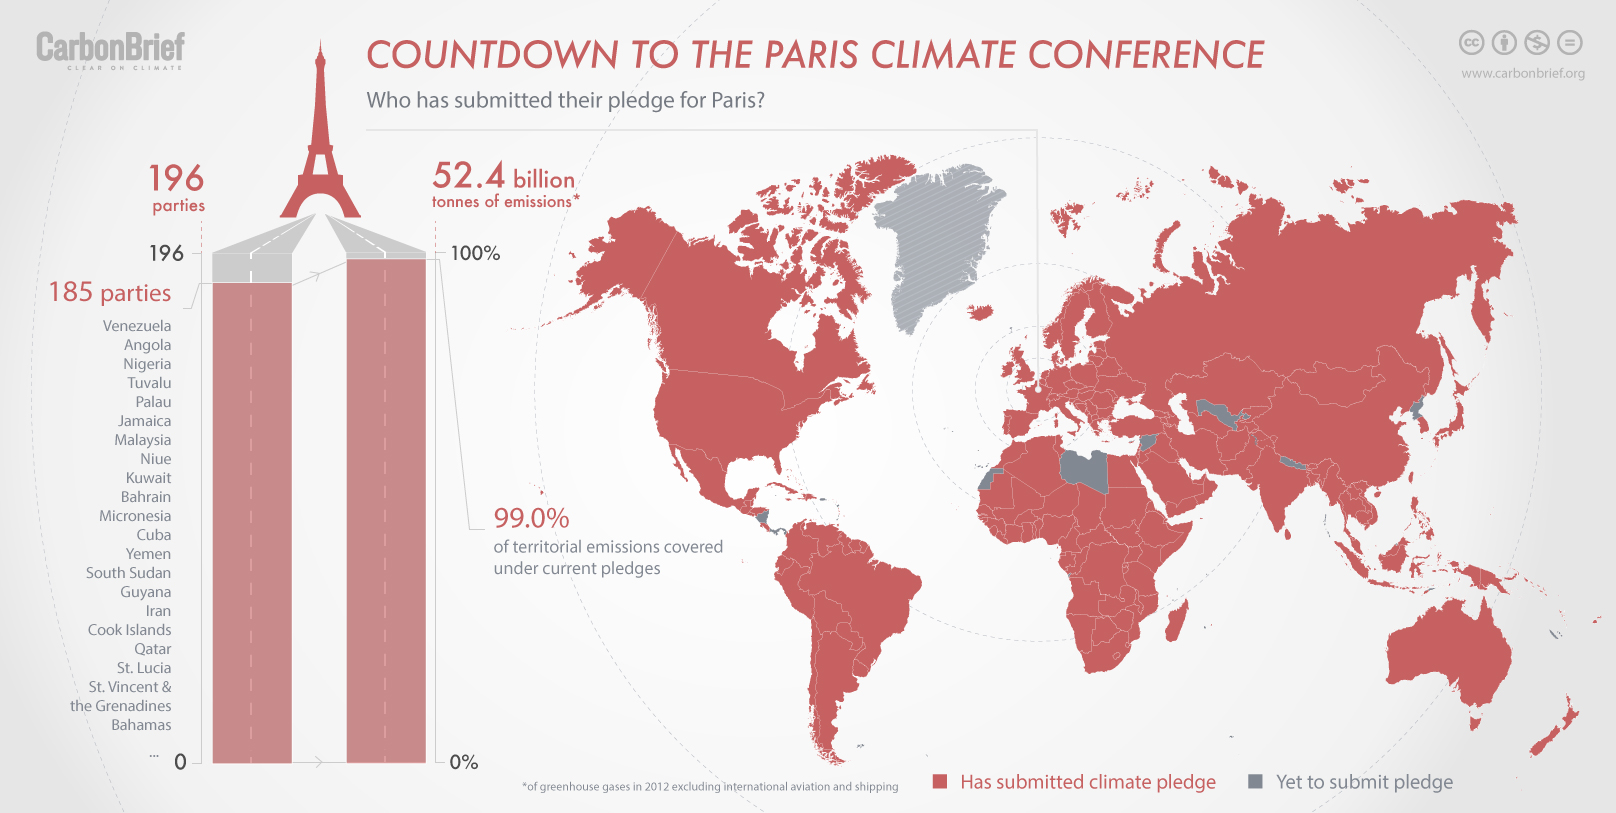
Infographic: Who has submitted their pledge for the Paris climate conference. By Rosamund Pearce for Carbon Brief.
331 seats
After May’s shock UK general election victory for the Conservatives, winning a narrow majority with 331 seats, we asked experts what it would mean for climate and energy. Their cautious welcome now looks optimistic. Apart from a commitment to phase out coal, there has been little positive policy news and plenty of surprise negatives.
The Tories’ efforts to cut support for renewables, ostensibly so as to deal with a projected overspend in green subsidies, arguably go far beyond their manifesto commitments. After good progress on renewables, the outlook looks gloomy and there are doubts over meeting future UK carbon budgets. Departmental budgets have also been cut.
184 pages
The release of Pope Francis’ 184-page encyclical in June brought with it a heightened interest in the subject of climate change, and not just among the world’s 1.2bn Catholics. The document, called Laudato Si’, contained strong words from the Pontiff on issues including urbanisation, the destruction of nature and carbon markets.
The encyclical was covered by media outlets around the world, although an Italian paper faced censure for leaking it early. Carbon Brief investigated the years of scientific consultations that went into the making of the document, including a scientific report from two Pontifical Academies that called for a zero-carbon world. The Vatican wasn’t the only religious institution to get involved in climate change this year. The Islamic Declaration on Climate Change, released soon after, called for a phase-out of fossil fuels.
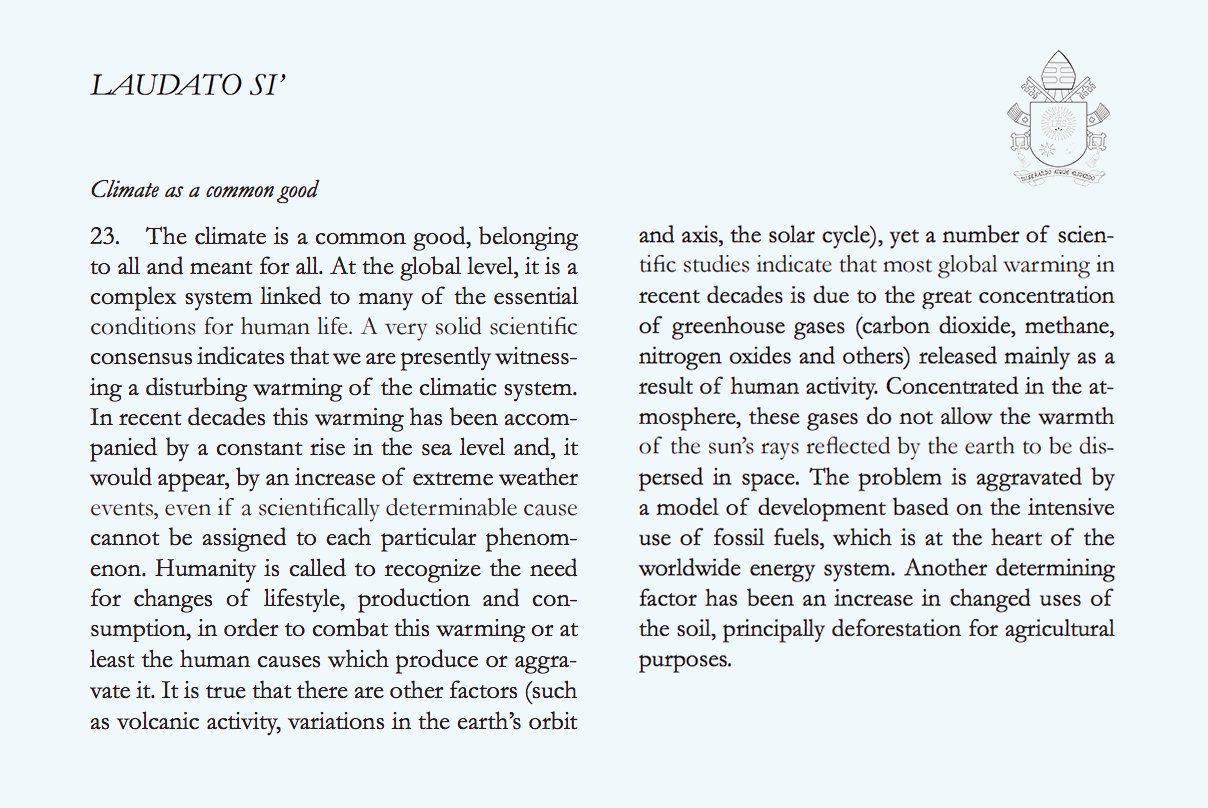
Credit: Laudato Si’, adapted by Rosamund Pearce for Carbon Brief
<$50 a barrel
Oil prices have continued to surprise in 2015. After starting around $50 a barrel, prices rose slowly before plumbing new depths as the year end approaches. The International Energy Agency said fuel efficient vehicles and reduced oil subsidies were helping create a “new normal” of sluggish demand despite low prices.
Carbon Brief took an early look at what $50 oil might mean for the global energy mix, as well as climate and energy policy back in the UK, where cheaper gas has also played a part in coal use reaching historic lows.
1,600,000,000 tonnes
In Indonesia, 2015 will be remembered as the year that their forests went up in flame with even more ferocity than usual. Peat fires, resulting largely from illegal “slash and burn” clearance techniques, spread rapidly in dry conditions related to 2015’s strong El Niño, and released 1.6bn tonnes of greenhouse gases. In just six weeks, this bumped Indonesia up from sixth to fourth place in terms of largest emitting countries, putting it ahead of Russia. Carbon Brief looked at the scale of the disaster.
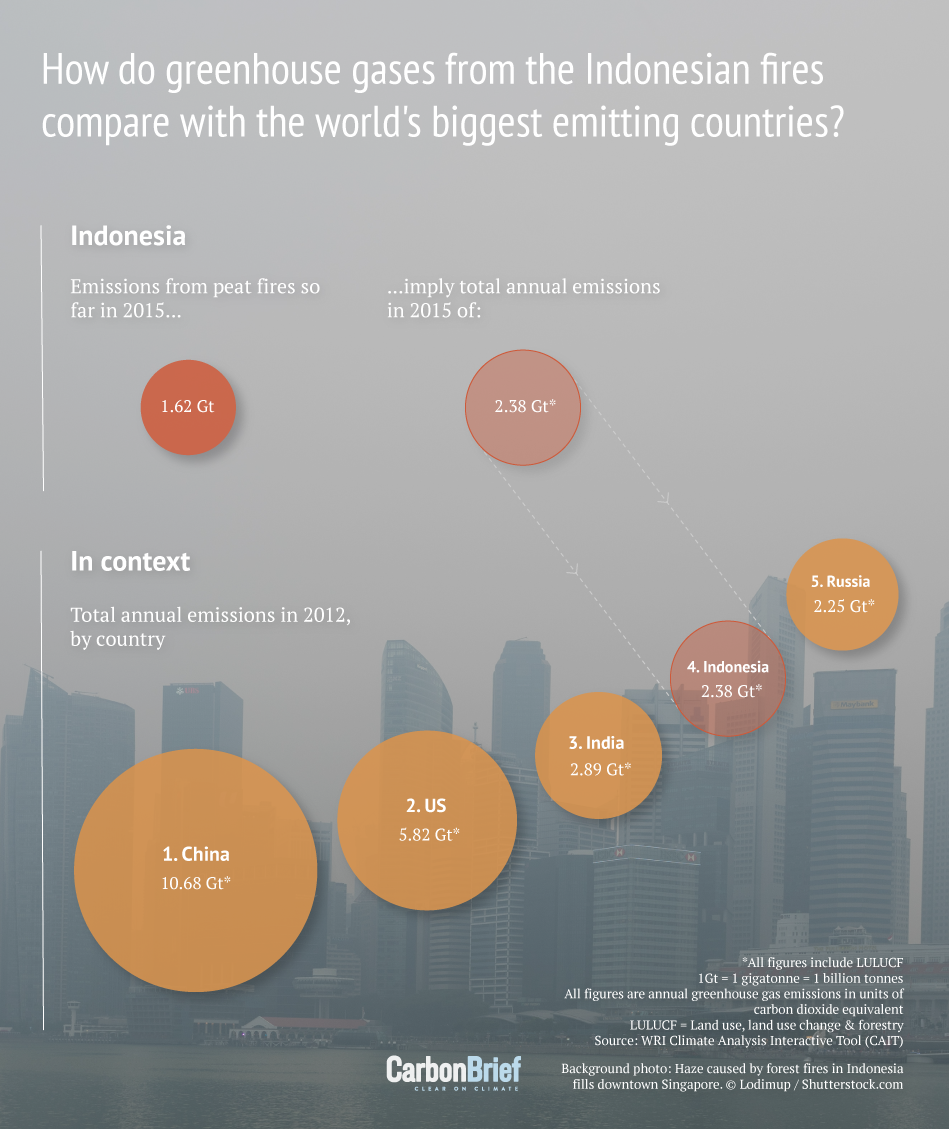
Infographic: How do greenhouse gases from the Indonesian fires compare with the world’s biggest emitting countries? By Rosamund Pearce for Carbon Brief
⅓ of adults
More than a third of the world’s adults have never heard of climate change, according to new analysis of a global survey from 2007-08. In some developed countries, including Japan, US, and the UK, almost all adults have heard of climate change — although it turned out to be a different story when the pollsters asked them if it was a threat. Liberia, which came bottom of the list, had an awareness rate of just one fifth.
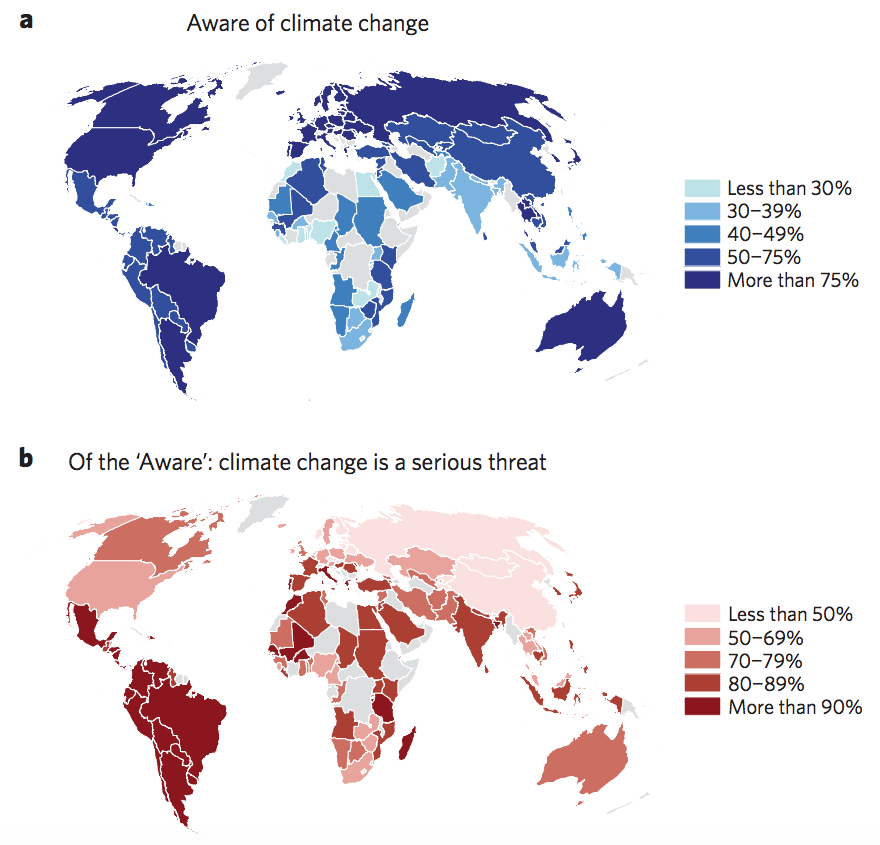
Source: Lee et al. (2015)
1 in 6 species
Climate change will accelerate the speed at which species become extinct, according to a review of scientific papers released in April. Scientists found that as many as 16%, or one in six, of plants and animals would be under threat of dying out if global temperatures should rise by 4C. The risks increase exponentially as the planet warms. The study found that South American species have the highest extinction risk at 23%, followed by Australia and New Zealand’s at 14%.
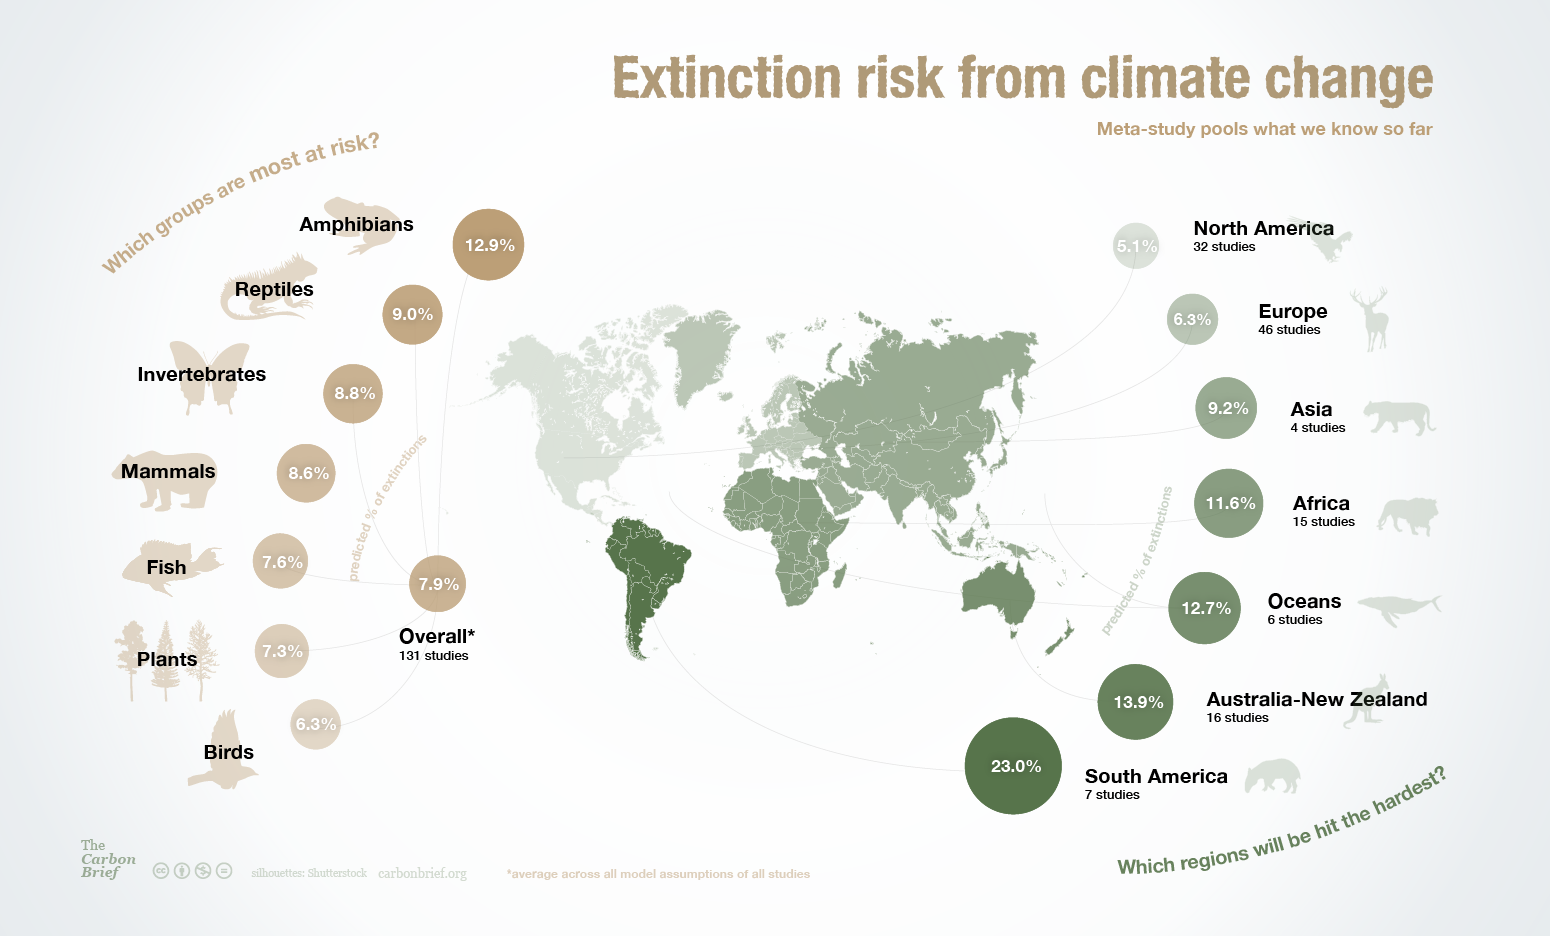
Predicted extinction rates from climate change by region and group. Credit: Rosamund Pearce, Carbon Brief, based on data from Urban (2015).
2 times
Consumption of meat in Europe is twice as high as healthy levels, and this is bad for the climate, according to a Chatham House study released in November. Global demand for meat is predicted to rise by 76% by the middle of the century, which could put upward pressure on greenhouse gas emissions. But it wasn’t all bad news, with the study’s authors suggesting that government action to nudge people towards sustainable diets would not be as politically toxic as is often assumed.
Zero emissions
This year, the nations of the world collectively agreed to aim for zero, or more precisely net-zero greenhouse gas emissions. The goal is firmly based in climate science, but its adoption was still unexpected.
Over the course of the year, the aim has been expressed in different ways. The G7 called for complete decarbonisation. The Vatican wanted zero carbon. COP21 briefly flirted with emissions neutrality. In the end though, the long-term goal of the final Paris climate deal is a “balance” between greenhouse gas emissions and sinks. That’s zero to you and me.
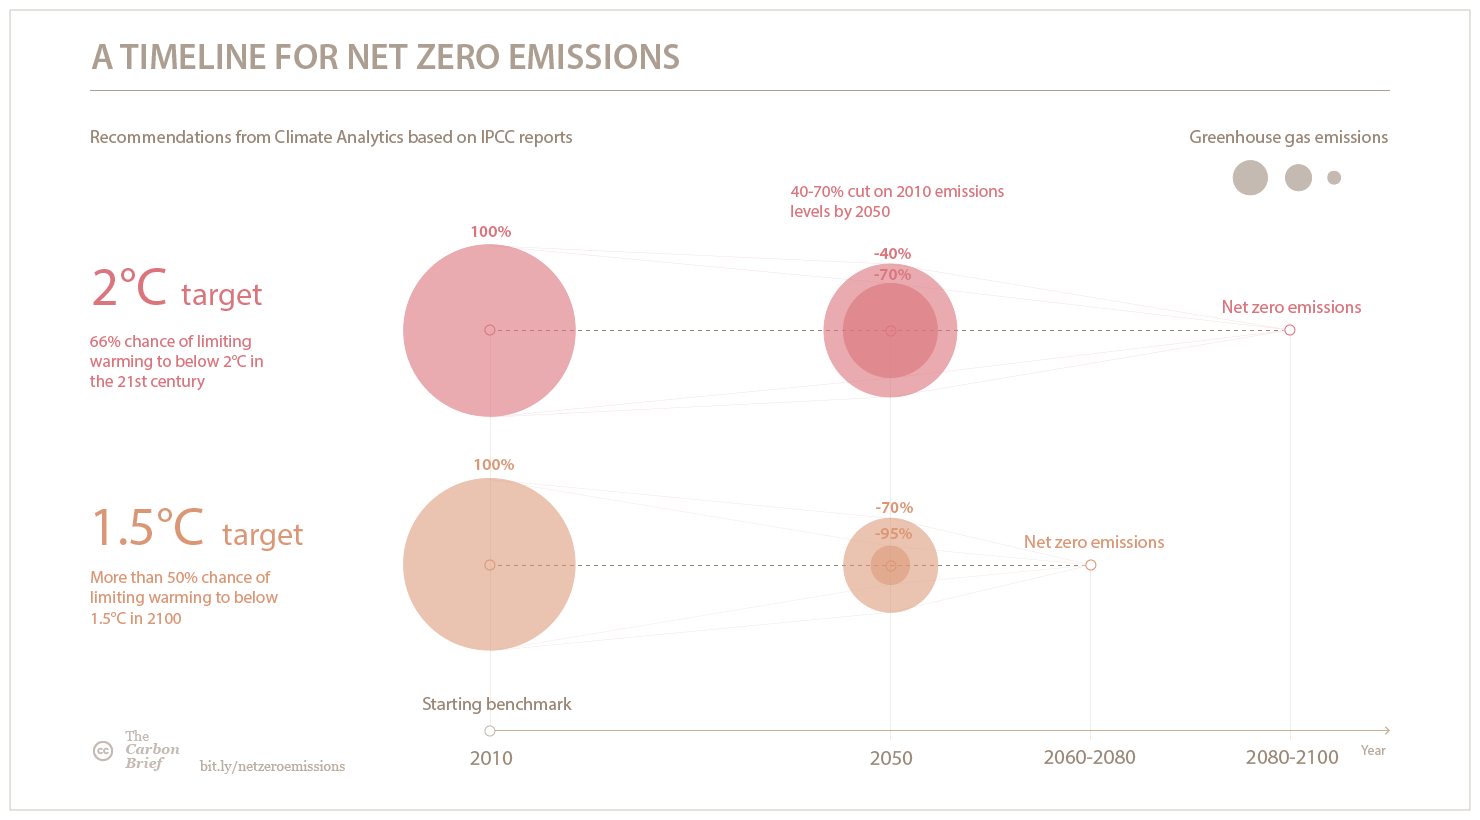
Infographic: Timeline for net zero emissions. By Rosamund Pearce for Carbon Brief.
1C of warming
Scientists have said they expect 2015 to be the first year where the global annual average temperature surpasses 1C above pre-industrial levels. As the halfway point of the 2C limit embedded in international climate policy, this is a significant milestone for the planet. The World Meteorological Organisation (WMO) says we’ve just had the hottest five-year period on record.
While this year’s El Niño was responsible for boosting 2015 temperatures higher than usual, scientists told Carbon Brief that it’s only a matter of time until temperatures rise beyond 1C more permanently. Indeed, the Met Office has already forecast that 2016 will surpass previous records to become the hottest ever year.
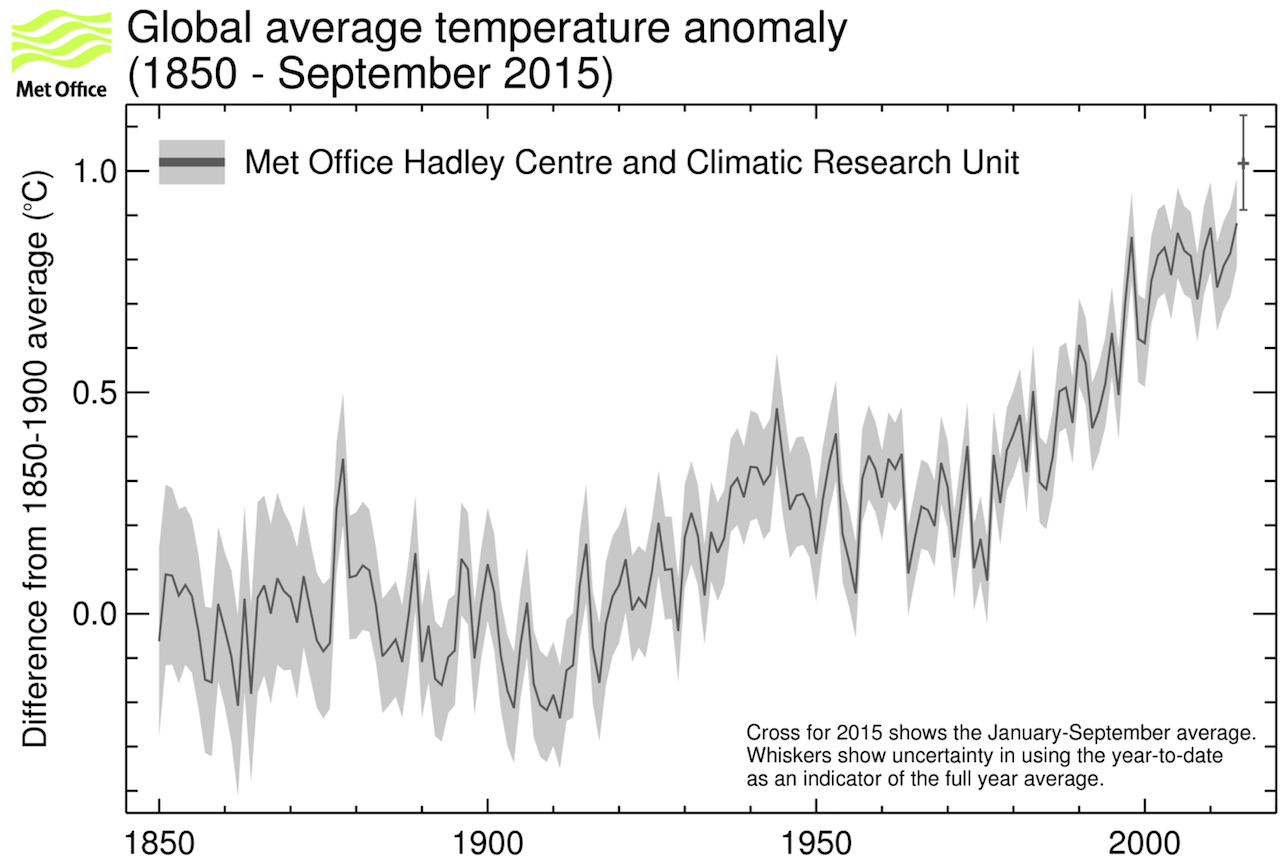
Observed global annual average surface temperature, relative to 1850-1900 average (in degrees C), according to HadCRUT4. Source: Met Office
0.6% fall in emissions
During the second week of COP21 in Paris, scientists announced that global emissions look set to fall by 0.6% this year on the back of reductions in Chinese coal use.
After a decade of rapid increases, there’s now growing evidence that emissions have stalled worldwide, while UK emissions are falling through the floor. However, this is unlikely to signal a peak in global emissions just yet, the researchers caution.
The shift could mark a turning point for climate efforts, though even if the stalling of emissions is maintained, the world would remain a long way from its zero-emissions goal.
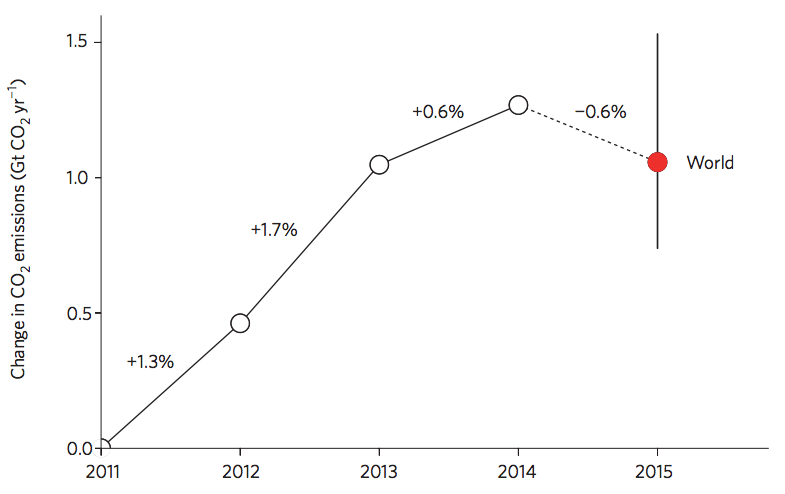
Yearly changes in global CO2 emissions from fossil fuel use and industry since 2011. Source: Jackson et al. (2015)
9 lowest ice extents
The nine lowest September ice extents in the Arctic have all occurred in the last nine years — a sign of the impact that climate change is having on the northernmost part of the planet. This summer, the Arctic saw its fourth lowest summer minimum on record, with ice shrinking to 4.41m square kilometers on the 11 September, according to the US-based National Snow and Ice Data Center.
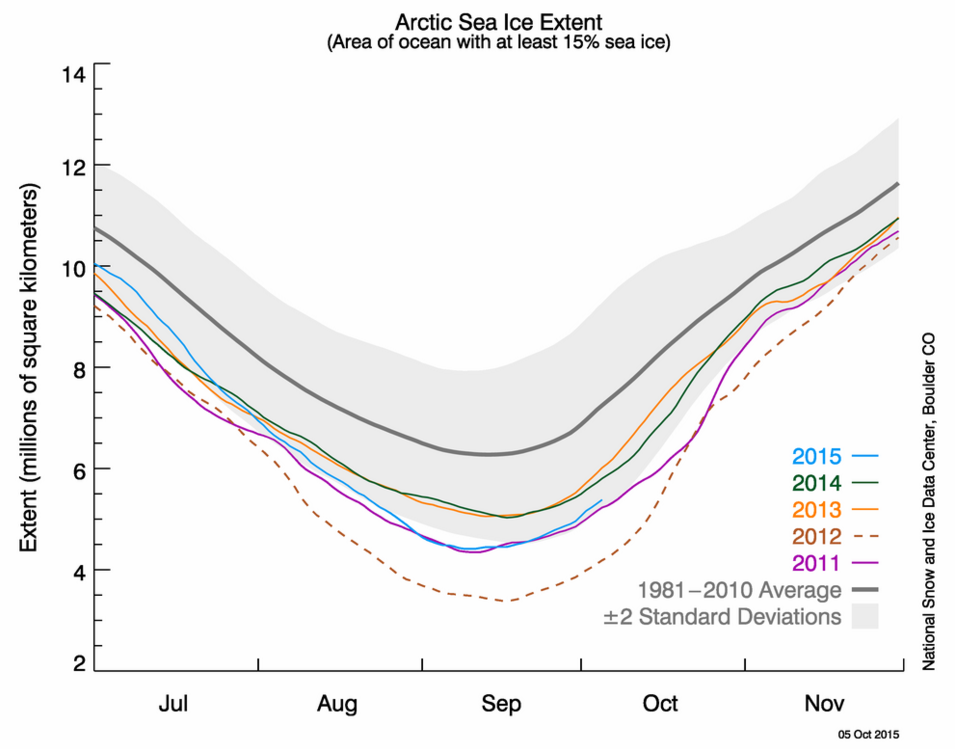
Arctic sea ice extent as of 5 October 2015 (blue line), along with daily ice extent data for four previous years: 2014 (green), 2013 (orange), 2012 (brown, dotted), and 2011 (purple). Source: National Snow and Ice Data Center
341.4mm of rain
Storm Desmond swept across the UK in early December, bringing a 24-hour record 341.4mm of rain in Cumbria, flooded homes and a renewed debate over the role of climate change in UK flooding. Carbon Brief wrapped up the media response and scientists’ views.
The year also brought record-breaking winds in the form of October’s 200mph Hurricane Patricia, though this caused less damage than March’s 190mph Hurricane Pam. Are these powerful storms linked to global warming? August’s 10-year anniversary of Hurricane Katrina offered a chance for Carbon Brief to reflect on the latest science.
Visualisation of estimated UK rainfall for the period from 30 November to 7 December 7, 2015, using data from NASA’s Integrated Multi-satellitE Retrievals for GPM (IMERG). Credits: SSAI/NASA/Hal Pierce
94 points
To celebrate its fifth birthday and the launch of its new website, Carbon Brief held its inaugural quiz night in the basement of a central London pub. The winning team was DECC (Department for Energy and Climate Change) Science, which scored a grand total of 94 out of 125. We published the full quiz online, including questions set by the likes of Christiana Figueres and Amber Rudd, for those who feel like testing their brains.
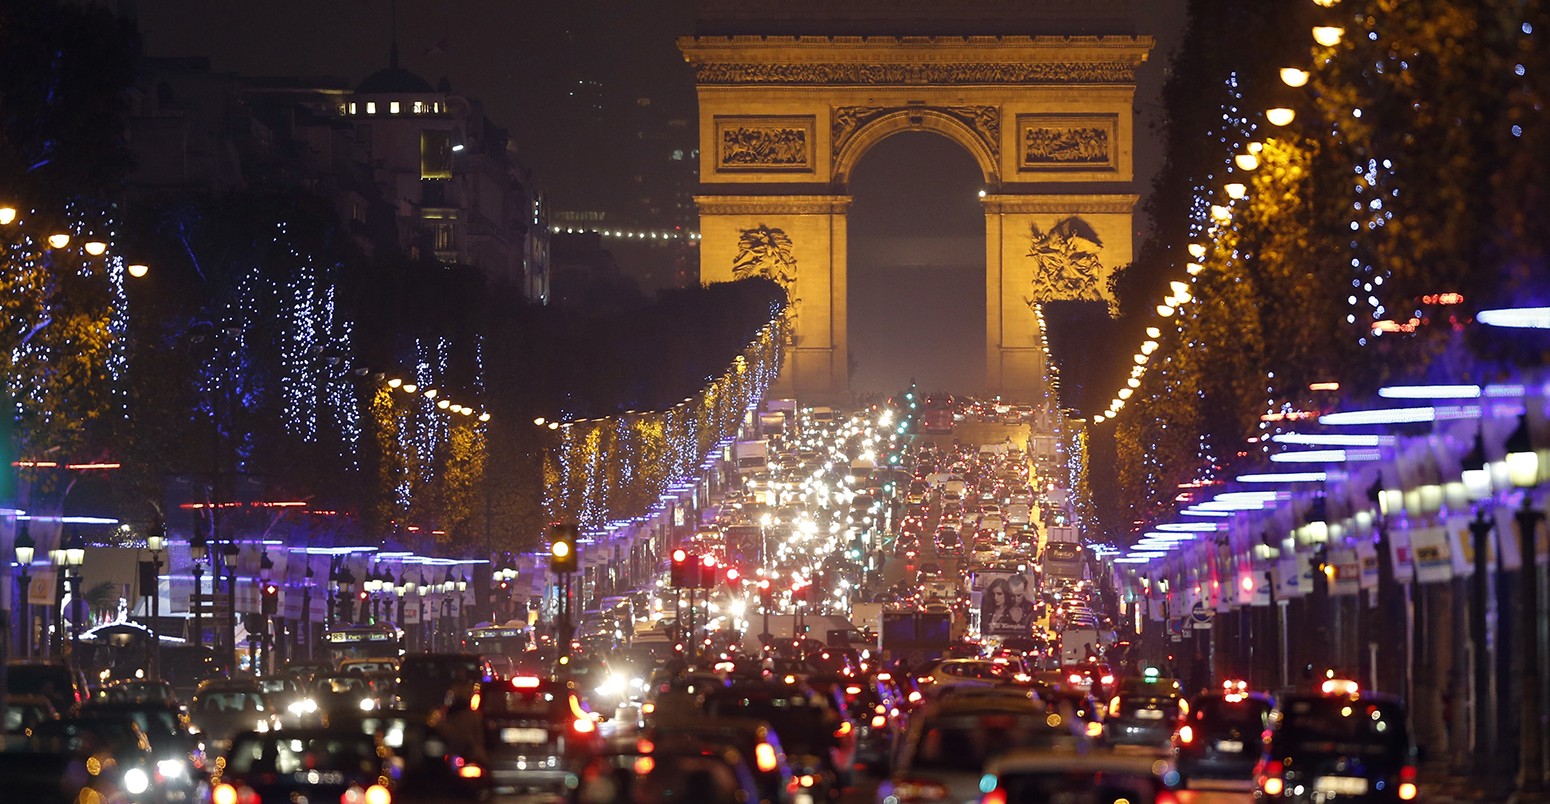
Main image: Christmas lights along the Champs Elysees. © CHARLES PLATIAU/Reuters/Corbis.