Guest post: Global warming edges closer to Paris Agreement 1.5C limit

Prof Richard Betts MBE
07.09.20Prof Richard Betts MBE
09.07.2020 | 7:46amThe latest forecast (pdf) from the World Meteorological Organization (WMO) suggests that over the next five years there is a 24% chance of the global average temperature exceeding 1.5C above pre-industrial levels for at least one year.
While this is another reminder of the Earth’s rising temperatures, it is important to note that it would not mean that the Paris Agreement’s long-term goal to limit warming to 1.5C will have been breached.
This is because the warming limit refers specifically to long-term human-caused warming and not the added effect of natural fluctuations in the climate.
In this article, I delve into the details of the Paris Agreement 1.5C limit, showing why they matter and what the risks are if they are misconstrued.
Human-caused warming
Under the Paris Agreement, almost all the countries of the world have committed to “pursue efforts to limit the global average temperature increase to 1.5C above pre-industrial”.
As a previous Carbon Brief guest post has noted, the Paris Agreement itself does not spell out explicitly how such temperature limits should be used in climate policy and practice. However, a common interpretation of this is that 1.5C refers here to the long-term global warming attributable to human influence – and not the added effect of natural climate variability.
This is important here because the WMO five-year forecast does encompass natural climate variability on top of the long-term temperature trend. These forecasts are produced with a large set of computer models that calculate weather and ocean processes over the coming few years, including natural fluctuations as well as human impacts.
Since weather cannot be precisely predicted more than a few days ahead, these forecasts give the probabilities of particular changes. Hence they can be used to estimate the chances of global temperature changes reaching specific levels such as 1.5C. But importantly, they do not refer to the Paris target of limiting the long-term human-caused global warming to 1.5C, as they are predicting natural changes as well as human impacts. They do, however, show how close we are getting to breaching this limit.
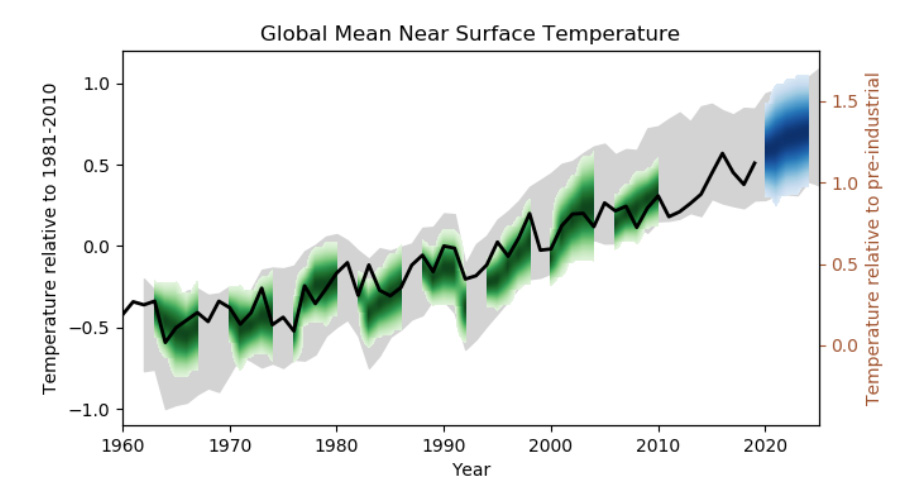
The blue band in the chart below shows the WMO forecast for the next five years, with the darker blue shading indicating higher probabilities. The green bands show testing of the forecast method against observations of past global temperatures (black line).
The forecast suggests that annual global temperatures are likely to be at least 1C warmer than pre-industrial levels in each of the coming five years – and they are all very likely to fall within the range 0.91-1.59C.
The chance of at least one year exceeding 1.5C above pre-industrial levels is 24%, with a very small chance – just 3% – of the five-year average exceeding this threshold.
Human and natural influences
The ongoing build-up of CO2 and other greenhouse gases in the atmosphere is causing global temperatures to rise. But, on top of that, temperatures are also affected from one year to the next as large-scale weather and ocean systems shift back and forth.
For example, El Niño events can contribute to record high global temperatures, but as the world continues to warm, even years without El Niño events could see records fall. There is a chance that this year might witness such an occurrence, although emerging La Niña conditions could still prevent that.
The latest data published by the Copernicus Climate Service shows that the past 12 months saw global temperatures around 1.3-1.4C above 1850-1900 levels. This is tied as the warmest 12 months on record with a period in 2015-16 when there was a very large El Niño event.
However, although these recent temperatures are not associated with El Niño, it is likely that human-caused warming is not solely responsible for the tied record – there is still some natural variability adding to the human impact. The monthly global temperature anomalies are now slightly lower than earlier in the year.
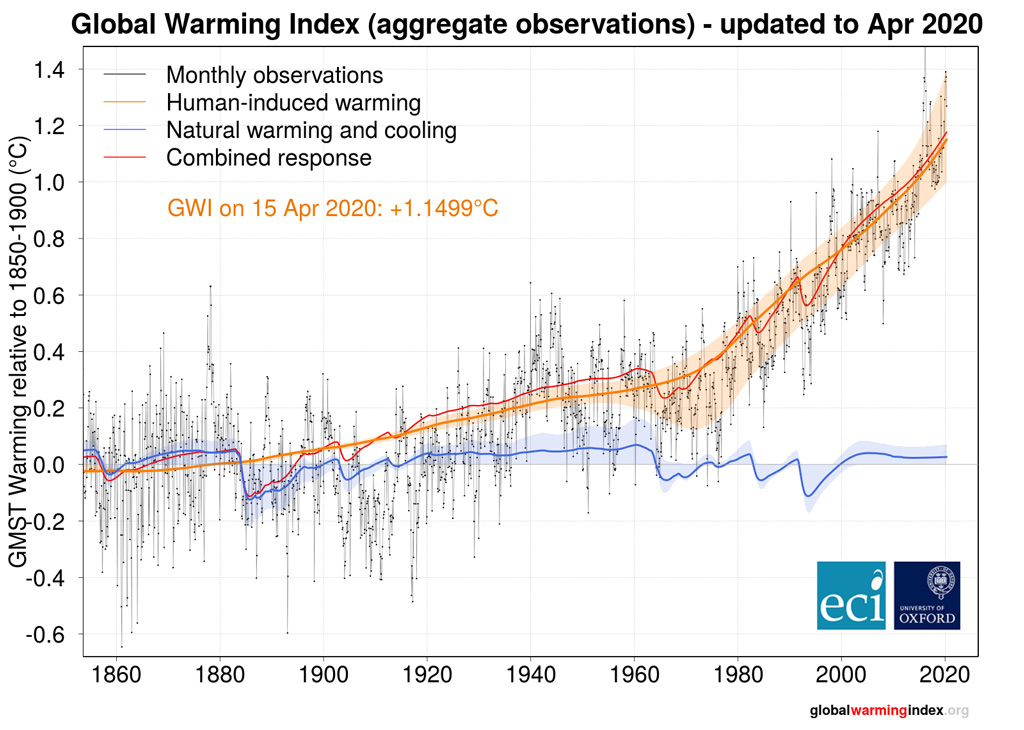
As the chart below highlights, the human-induced contribution to global average surface temperature (orange line) is currently calculated to be around 1.15C.
No set baseline
There are other more technical issues about the 1.5C limit and its exact meaning.
One is that the baseline for the change – described as “pre-industrial” – is not precisely defined.
Most scientific studies consider modern warming to be relative to the average from 1850 to 1900 – and the 2018 special report on 1.5C by the Intergovernmental Panel on Climate Change (IPCC) and the WMO forecast both use this.
However, this is not the “true” pre-industrial climate because substantial fossil fuel burning began a century earlier at the start of the Industrial Revolution. The earlier date has not typically been used in climate science since there is not enough coverage of weather data before 1850 to allow a confident estimate for an earlier baseline – and it was originally considered that the difference would be small.
Recent work shows that the difference is, indeed, fairly small and still uncertain – possibly up to 0.2C. But this is enough to make a difference of up to about a decade to the year at which 1.5C could be considered to be breached.
It is important to note that this would not affect the timing of impacts projected using climate models, as they were assessed on the basis of a simulated change between 1850-1900 and the future 1.5C state.
Another issue is the exact measure of global average temperature. In observational datasets, this is estimated from numerous measurements of temperature across the continents and oceans.
But slightly different things are measured in each case. Over land, the measurements are typically of the air temperature at 1.5 metres above the ground. But over the ocean, the measurements are actually of the water at the surface, so they refer to the actual surface temperature. In climate models, however, the output is generally the near-surface air temperature. This introduces a minor inconsistency, which is relatively small, but again may make a difference to the precise time at which 1.5C is defined to have been surpassed.
In addition, there are four major global datasets for global temperature – each with slightly different approaches to calculating temperatures for the world as a whole.
These issues of baseline years and observational datasets make only very small differences to estimates of human-caused warming, but when the threshold for 1.5C is so close, these become important for the timing of reaching it. The same technical issues have arisen in calculating the remaining carbon budget for meeting the 1.5C limit.
Impacts are not immediate
The human-induced warming trend is currently between 0.1C and 0.3C per decade. If this continues at the current rate, the increase in global average surface temperature is likely to reach 1.5C between about 2030 and 2050. Climate model projections that do not include rapid, urgent mitigation give similar timings.
The latest WMO forecast does not change that – it shows how close we are to reaching 1.5C in the long-term, but it does not suggest an acceleration of human-induced warming.
It is also important to note that impacts associated with 1.5C of global warming would not be expected to appear suddenly in the first year or first month with temperatures at that level.
Climate change is already increasing many types of weather extremes and other impacts, but 1.5C is not a physical threshold when new changes suddenly kick in. The impacts quantified in the IPCC’s 1.5C report relate to the long-term average at 1.5C.
Furthermore, some of the impacts of 1.5C would take a long time to fully emerge, even though they would already be committed by the time temperatures reach that level.
Sea level rise, for example, takes decades, centuries or even millennia to fully respond to warming, because glaciers and ice sheets do not melt instantly – they take time to melt and release their water into the oceans. It also takes time for heat to penetrate into the deep ocean and cause the water to expand there.
This means that low-lying coastal areas and small island states will continue to see increasing risks of coastal flooding, even if global warming is stabilised at 1.5C. This all emphasises how vital it is to stop the warming.
Why does this matter?
It is important to avoid misconceptions about the meaning of 1.5C and its impacts because it could lead to complacency when this level is first reached temporarily and major, catastrophic impacts do not occur.
A lack of immediate climate impacts should not be used to claim that 1.5C is benign and it was all a fuss about nothing. Such claims would be disingenuous and would not reflect what the science has actually said. A rise of 1.5C is expected to lead to major risks and impacts in the long-term, but not as soon as the threshold is crossed.
Another reason is that the Paris limits are intended to motivate action, but if they are wrongly thought to be about to be missed and that immediate catastrophe will result, this could have the opposite effect. “Doomism” – the view that it is now too late to avoid catastrophic climate change – can be seen as one of the “discourses of delay”. It could actually obstruct climate action rather than motivating it.
The IPCC special report showed that limiting global warming to 1.5C is incredibly challenging and requires very deep cuts in greenhouse gas emissions starting immediately. That was nearly two years ago and, despite temporary reductions in emissions in the first part of this year due to the global coronavirus lockdown, CO2 is still building up in the atmosphere.
Current worldwide policies still put global warming on track to reach anywhere between about 2C and 4C global warming by 2100 – or possibly more if carbon cycle feedbacks are strong.
The likelihood of global warming breaching 1.5C increases with every year that passes. But this is because global emissions are not yet falling, not because the predictions have changed.
So while the WMO five-year forecast does not bring forward the predicted date for 1.5C global warming, it does show starkly just how close we are to reaching that limit and that meeting the goals of the Paris Agreement are in real danger of slipping out of reach.