
Guest post: How climate scientists should handle ‘hot models’

Guest authors
05.04.22Guest authors
04.05.2022 | 4:00pmThe latest “CMIP6” generation of climate models includes a subset of “hot models” that point towards much greater warming than expected.
These models have high climate sensitivity, a measure of how much the planet warms in response to rising atmospheric carbon dioxide (CO2) concentrations.
Yet multiple lines of evidence based on observations and our understanding of planetary physics suggest we can confidently narrow the range of climate sensitivity and, crucially, give less weight to high-end estimates.
The recent sixth assessment report (AR6) from the Intergovernmental Panel on Climate Change (IPCC) reconciled these findings with the idea of “assessed global warming” – warming projections that combine model results with observational constraints.
While giving a more realistic picture of future warming, this approach has created a problem for scientists wishing to study climate impacts and adaptation, particularly at local or regional scales, based on daily or monthly extremes, or on non-temperature variables such as rainfall.
In a new comment in Nature, we propose a set of simple approaches to this problem so that studies on climate impacts and adaptation can avoid giving too much weight to “hot models”.
Assessed warming
In the lead-up to the IPCC AR6, the report’s authors faced a dilemma.
On one hand, a new generation of models (CMIP6) had recently been released and showed a notably larger range of climate sensitivity – how much the planet warms in response to increasing atmospheric CO2 concentration – with a number of models running much hotter and showing greater levels of future warming than those in the prior generation.
On the other hand, a sizable number of studies were being released suggesting that the very high sensitivity subset of new climate models did a poor job of reproducing historical temperatures, and those tested had trouble simulating the conditions of the last ice age.
A community review of climate sensitivity came out – Sherwood et al 2020 – using multiple lines of evidence from historical observations, paleoclimate proxy records of the Earth’s more distant past and physical process models to show that the range of climate sensitivity should be narrowed, not expanded.
To reconcile this new, narrower sensitivity range with CMIP6 models, the AR6 authors made two notable changes in their use of climate models relative to prior reports. The first was to create “assessed global warming” projections that went beyond a simple model average. The second was to consider impacts as a function of global warming level (GWL) as opposed to time.
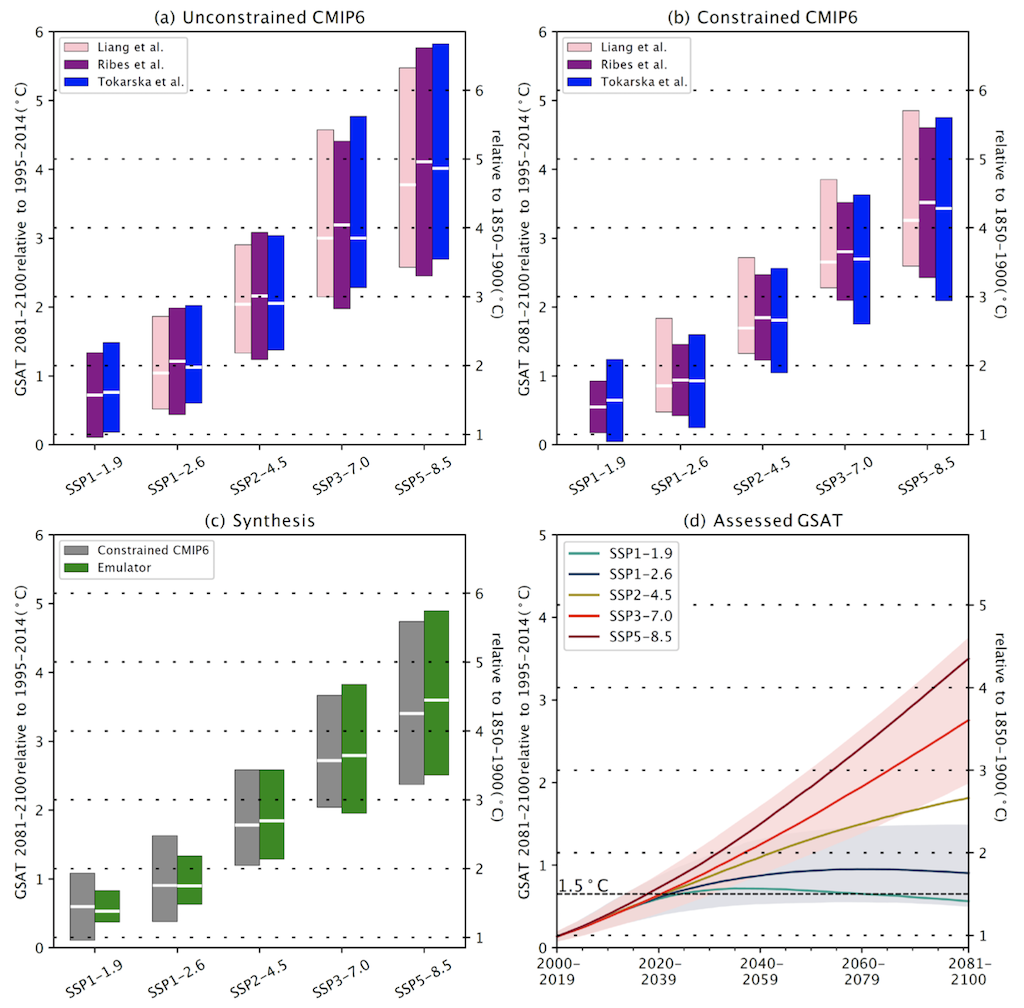
The IPCC’s assessed warming projections differed substantially from the raw CMIP6 ensemble, shown in the top left panel of the figure below. They were based on three different methods that incorporated the historical global mean temperature record (top right) combined with a climate model emulator tuned with the latest climate sensitivity constraints (bottom left).
However, this combination of three separate analyses and an emulator only produces a global average estimate of future changes and makes it difficult for the broader scientific community to replicate the IPCC’s approach more generally.
This has left the broader climate community in an unfortunate bind. On one hand, the IPCC has created assessed warming projections consistent with the latest observational constraints on climate sensitivity. On the other hand, only simple time series of global-mean, annual-mean surface air temperature and estimated sea-level rise were provided for impact studies.
Any study seeking to evaluate regional or local impacts of climate change, monthly or daily extremes, or non-temperature variables must rely on the CMIP6 ensemble rather than the AR6 assessments.
In the absence of community-wide guidance on model weighting or observational constraints, many analysts default to the prior approach of treating each model the same, regardless of sensitivity, performance or independence, or develop ad hoc approaches to filter them.
In a new comment in Nature, we argue that adaptation and impact studies should use future warming projections consistent with the recent IPCC report and other independent lines of evidence, rather than simply relying on the average of models as has been the common practice in the past. A lack of community awareness of this issue and the absence of tools to effectively replicate the AR6 assessed warming approach is already leading to a widespread publication of studies that give too much weight to a subset of “hot models”.
Too many high-sensitivity models
Around a fifth of the new CMIP6 models lie outside the very likely (90th percentile) equilibrium climate sensitivity (ECS) range in both Sherwood et al 2020 and the range adopted by the IPCC AR6, with 18% of CMIP6 models having an ECS above 5C per doubling CO2 and 27% of CMIP6 models having an ECS higher than the most sensitive model in the prior generation (CMIP5).
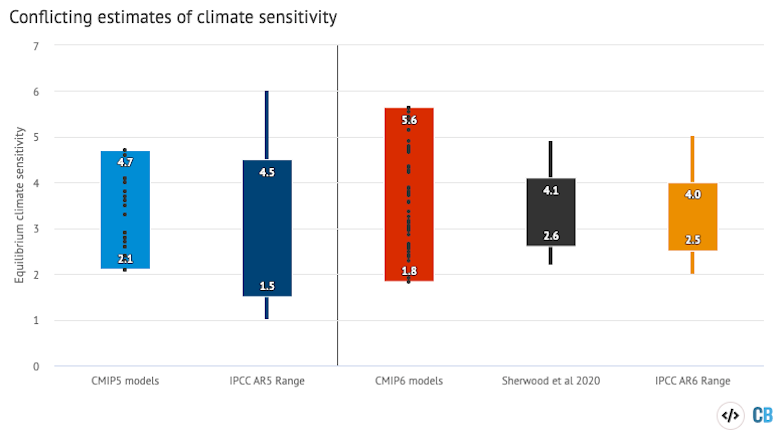
By contrast, the Sherwood et al review combined multiple lines of evidence from paleoclimate, observations and physical process models to conclude that ECS is likely (66% chance) to be in the range of 2.6C to 4.1C and very likely (90% chance) between 2.2C and 4.9C.
The IPCC AR6 authors, following these more recent observational constraints, also significantly narrowed their assessed likely range of climate sensitivity to between 2.5C and 4C.
This is not to say that the high-sensitivity subset of CMIP6 models should be discarded; while we have notably narrowed our estimate of climate sensitivity in recent years, there is still a greater than 5% chance of an equilibrium sensitivity over 5C per doubling of CO2.
There is an important role for assessments of low-probability high-impact tail risks for which high-sensitivity models are well-suited. The problem is not that these high sensitivity models exist, but rather that the preponderance of them in the CMIP6 ensemble biases the mean and uncertainty range upwards, relative to other independent lines of evidence of the climate’s sensitivity.
In our commentary, we suggest that researchers may want to focus on a subset of CMIP6 models consistent with AR6 assessed warming when focusing on likely outcomes, while using a higher-sensitivity subset to examine tail risks.
Beyond ‘model democracy’
In the past, the IPCC primarily used the multi-model mean and spread to make a ‘best’ estimate of specific impacts and their uncertainties, effectively treating each model as an independent and equally valid estimate of change. This produced a reasonable estimate of uncertainty, in large part because the range of model sensitivity was consistent with the range constrained by other lines of evidence.
This notion of ‘model democracy’ received a great deal of scrutiny, but no generalisable and better performing alternative was found. This is despite clear evidence that CMIP models are not truly independent.
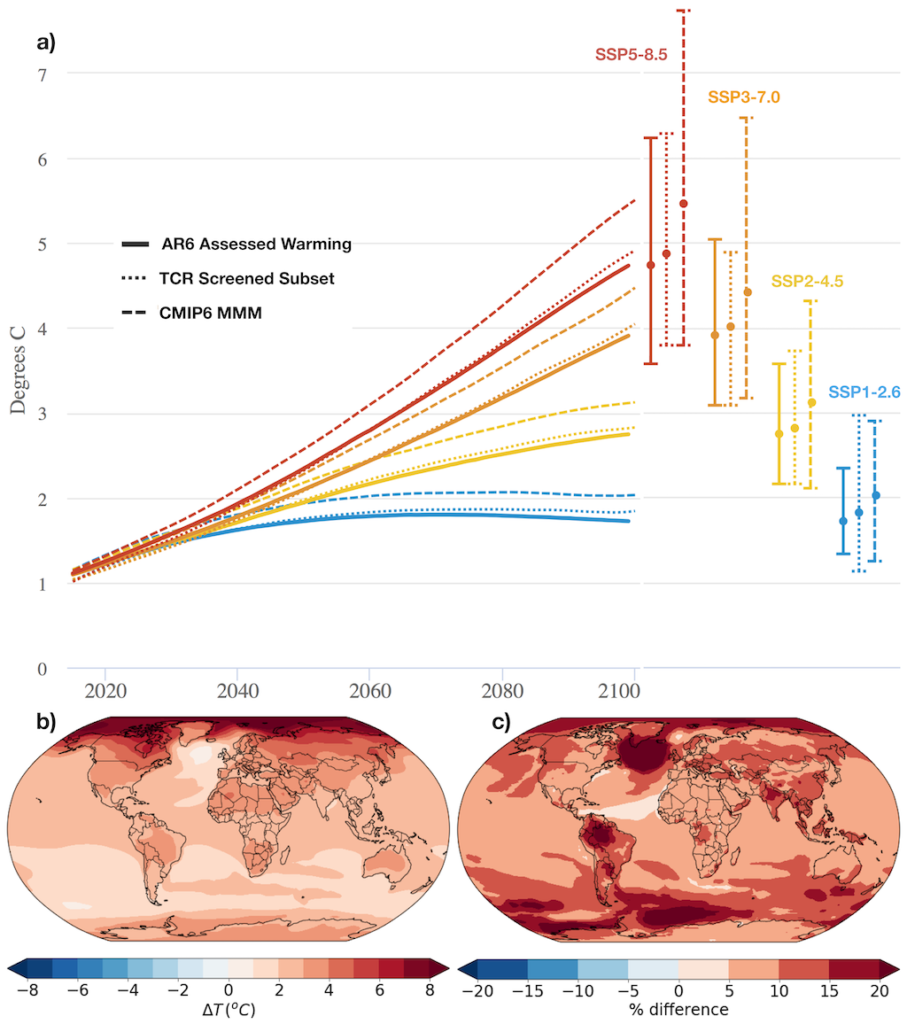
There are substantial differences between 21st century climates projected by the IPCC’s assessed warming (solid lines in the figure below) and the CMIP6 multimodel average (dashed lines). Depending on the scenario, the assessed warming projections show between 0.2C and 0.7C less global surface temperature change in 2100 – or between 15% and 29% less warming by 2100 relative to the 2015-2020 period. The assessed warming projections have a mean and uncertainty range that is similar to the prior generation of climate models.
We have already begun to see studies published, highlighting differences in climate impacts between the older CMIP5 models and the new CMIP6 models, that are at least in part driven by differences in model sensitivity.
The absence of easy-to-use climate model outputs consistent with the IPCC assessed warming makes it hard to take advantage of the important work that has been done to constrain climate sensitivity and consequently, may lead to exaggerated likelihoods of extreme climate outcomes in future studies.
For example, the CMIP6 multimodel mean will show a greater prevalence of extreme heat events and marine heatwaves, loss of arctic sea ice, impacts on agriculture, water scarcity, infectious disease and other temperature-related impacts than would be consistent with the assessed warming projections from AR6.
There are important advances in CMIP6 models relative to CMIP5 that are unrelated to the magnitude of future warming projections and enable more accurate assessments of climate impacts; however, the inclusion of a subset of unrealistically high-sensitivity models risks conflating the effects of excessive warming with other model revisions.
There is also a growing trend to use simplified climate model emulators in the literature – which played a large role in AR6. These emulators are often tuned to the AR6 climate sensitivity range and, again, will result in notably less future warming than the CMIP6 multimodel mean.
The continued use of raw CMIP6 models by one part of the community and emulators by another risks exacerbating these differences going forward, resulting in inconsistent and conflicting information for policymakers and other stakeholder communities.
In our Nature comment, we point out that researchers can relatively easily reproduce the AR6 assessed warming projections by screening out any models whose sensitivity is too high or low compared to other lines of evidence.
Specifically, we find that screening out models whose transient climate response (TCR) lies outside the “likely” (66% likelihood range) of 1.4C to 2.2C in AR6 effectively reproduces the AR6 assessed warming projections for global mean surface temperatures, as shown in the figure above.
This broadly reflects the approach taken to create assessed warming projections in the AR6, which relied on constraints based on agreement with observed temperatures that are strongly correlated with TCR. Using a “likely” 2.5C to 4C ECS screen similarly reproduces AR6 results, though at the expense of discarding 60% of the models in the CMIP6 ensemble versus 40% when using the TCR screen.
Unlike the IPCC’s assessed warming, the TCR-screened subset provides regional as well as global projections across a range of climate variables, with large regional differences in projected future warming relative to the raw CMIP6 multimodel mean, as panel C above shows.
Using a subset of models for the sake of consistency with assessed climate sensitivity has the drawback of discarding all of the other climate change information available from high-sensitivity models. Differences in the projected severity of many climate impacts do not necessarily map to differences in climate sensitivity.
A subset of models will not necessarily provide the best representation of all regional climate processes, even if it is still preferable to using the raw CMIP6 ensemble in most cases. For example, future projected drought risk in the North American southwest is highly uncertain but largely unrelated to model sensitivity.
However, there is an alternative, relatively straightforward way to use all the CMIP6 model information and produce consistent results: use global warming levels (GWLs).
Assessing impacts at ‘global warming levels’
Rather than assess the outcome across an ensemble of models at a particular time – say, 2100 – GWLs sample the ensemble of models at a specific level of global mean warming. For example, if policymakers wish to understand the climate impacts at a particular temperature target, such as 1.5C, 2C, or higher, they can draw from the full CMIP6 ensemble when each model reaches the neighborhood of that warming level, regardless of scenario.
The GWL approach has been in use for nearly a decade for extracting projections as a function of global temperature from multiple simulations and scenarios. The AR6 made important strides in advancing the use of GWLs, featuring them extensively throughout the reports, and the IPCC WG1 Interactive Atlas can display a variety of projected variables in a GWL context. There is an easy mapping for each model and GWL now available for researchers to calculate GWLs.
This approach has a number of benefits over time-dependent outcomes for researchers who want to understand the effects of global warming. It allows researchers to study climate impacts across a wide range of variables in a way that ensures consistency independent of the plausibility of either the model sensitivity or the underlying emissions scenario chosen.
It better accounts for the range of uncertainties – across emissions, climate sensitivity and carbon cycle feedbacks – rather than an overly-deterministic focus on storyline-based emission scenarios. It also frees assessments from the somewhat arbitrary focus on 2100 as a time horizon.
There are, however, some limitations associated with the use of GWLs. Policymakers need information both about the impacts at different warming levels and the time at which those warming levels will be reached, so GWLs need to be paired with some assessment of their likelihood of being reached over time under different emissions scenarios.
However, this pairing may be conceptually beneficial, as it distinguishes uncertainty associated with the future trajectory of global temperatures from uncertainty associated with the implications of a given trajectory.
In addition, while most climate variables will be comparable across models at a particular GWL, in some cases the speed at which the GWL is reached may affect the climate response, as will the pattern of aerosol emissions – which may differ in space and time across scenarios.
Ways forward for the community
Climate researchers currently face a dilemma with the new generation of climate models: use the raw CMIP6 models whose mean future warming projection is biased high, compared to the currently available evidence; or create their own custom weights that best fit the region and climate variable in question.
While there are many ways to create custom weights for models that best match the region and climate variable of interest, this requires both an awareness of the problem and involves considerable additional work and expertise in model assessment.
In practice, the absence of easy-to-use model outputs consistent with the AR6 will result in the use of the CMIP6 model mean, as we are already starting to see in the impacts literature.
The first and most important step in addressing this is to create greater awareness in the community that the multi-model mean and spread of the CMIP6 ensemble cannot simply be used in the way that it was for the prior CMIP5 generation.
We have outlined a few options – some more straightforward than others – for researchers to effectively use the CMIP6 ensemble. These include calculating impacts with respect to global mean temperature levels or changes where possible and relevant, or using a subset of models within the ensemble that have sensitivity values within the independently constrained range, in cases where the time dimension is essential.
Acknowledgements We would like to thank many colleagues for discussions about this topic, including Prof Ed Hawkins, Dr Kasia Tokarska and Dr Erich Fischer. We acknowledge the World Climate Research Programme, which, through its Working Group on Coupled Modeling, coordinated and promoted CMIP6. We thank the climate modeling groups for producing and making available their model output, the Earth System Grid Federation (ESGF) for archiving the data and providing access, and the multiple funding agencies who support CMIP6 and ESGF. We have made data needed to replicate our TCR-Screened approach including model TCR and ECS values available at: https://zenodo.org/record/6476375