Met Office: A review of the UK’s climate in 2021
Carbon Brief Staff
01.11.22As 2021 came to a close with a record New Year’s Eve high temperature for the UK, 2022 started in a similar fashion with its own record high for New Year’s Day.
Despite the record-breaking turn of the year, a look back at 2021 reveals a fairly average year for the UK’s weather – especially compared to the dramatic and memorable conditions of 2020.
However, “average” in today’s climate is still the UK’s 18th warmest in a record stretching back to 1884.
In this review, we unpack the UK’s climate in 2021 – for the year as a whole and each individual season. Our analysis also shows that the likelihood of seeing a year as warm as 2021 in a world without climate change is just 2.5% – but could be as likely as 89% by the end of the century.
Shifting baselines
Was 2021 an average year for UK climate? The answer rather hinges on what we define as “average” – a rather tricky concept in a shifting climate.
All national meteorological agencies, including the Met Office in the UK, retain extensive historical records of weather and climate observations. In order to facilitate international consistency in the way these statistics are reported, the World Meteorological Organization provides guidance on climatological best practice (pdf).
These define “reference” climatological periods as being the most recent 30-year period commencing with a year ending in “1”. The current reference climate period has, therefore, recently been updated to 1991-2020, replacing the previous reference period of 1981-2010. For long-term climate monitoring, 1961-1990 is also retained as a standard.
The UK mean temperature for 2021 was 9.28C. This is a mere 0.12C above the 1991-2020 reference period, making it a decidedly “average” year in comparison to the climate of the recent past.
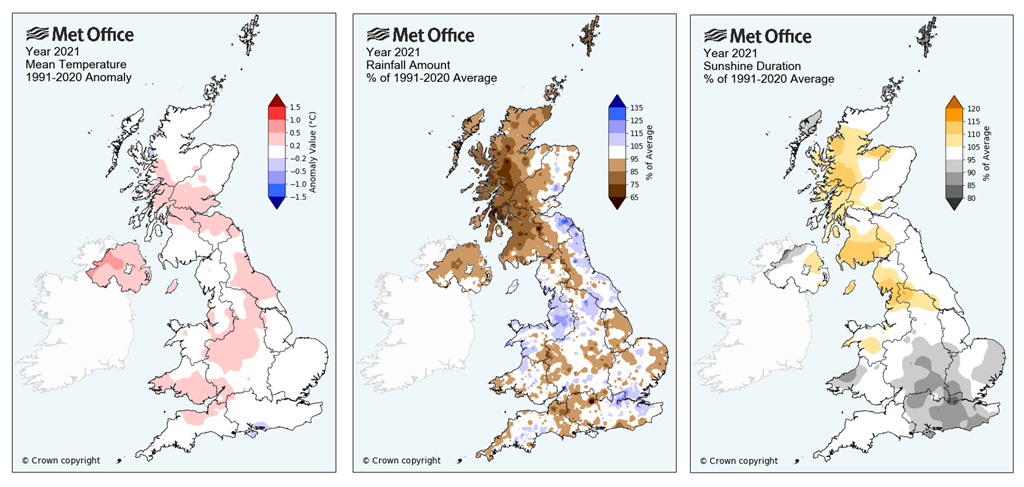
The maps below show average temperature (left), rainfall (middle) and sunshine duration (right) compared to 1991-2020, across the UK last year. Rainfall was slightly below average overall – particularly for north and west Scotland – and sunshine was slightly above average in the north and west and below in the southeast of the UK.
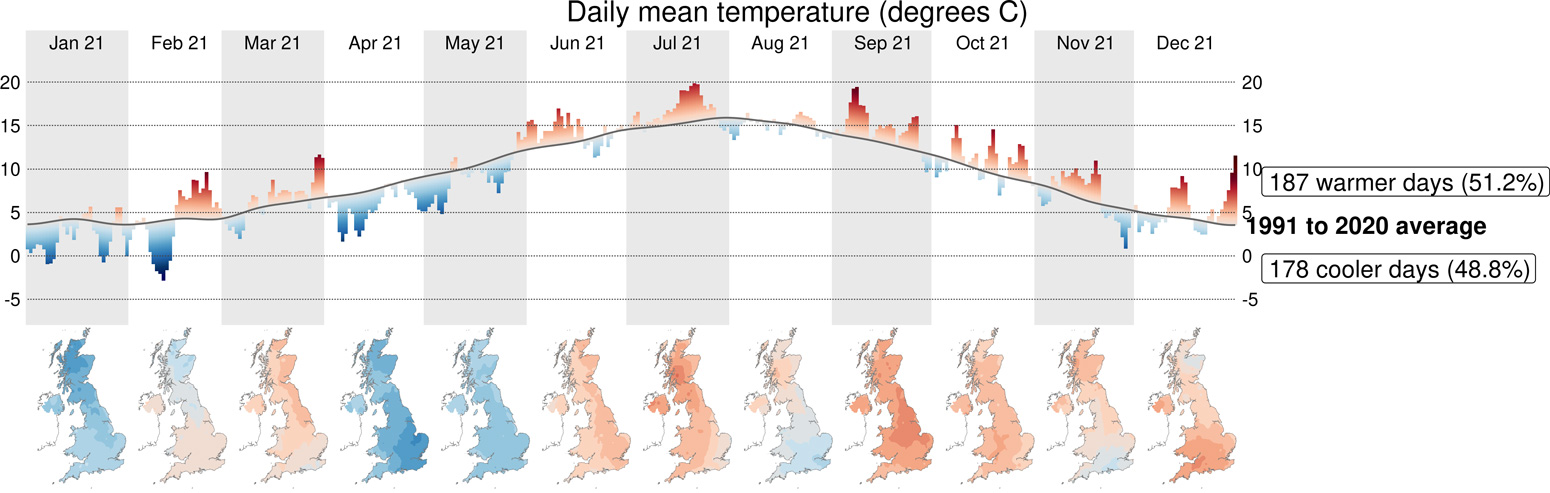
However, looking at the annual average temperature masks a lot of interesting weather within the year. The figure below shows UK daily average temperatures for the year. Overall, there is a fairly even split of days above (red shading) and below (blue shading) the 1991-2020 climatological average.
It is important to note the impact that the new reference period has on these figures. The UK’s national temperature observations span more than 100 years. The climate of the UK has warmed by close to 1C since the late 20th century, so it comes as little surprise that a relatively “average” year by today’s standards is notably warm if we compare it to the longer historical record.
Last year was the 18th warmest year in a series dating back to 1884 – and 13 of the 17 warmer years have all been in the 21st century (with a further three in the 1990s, and just 1949 any earlier than that).
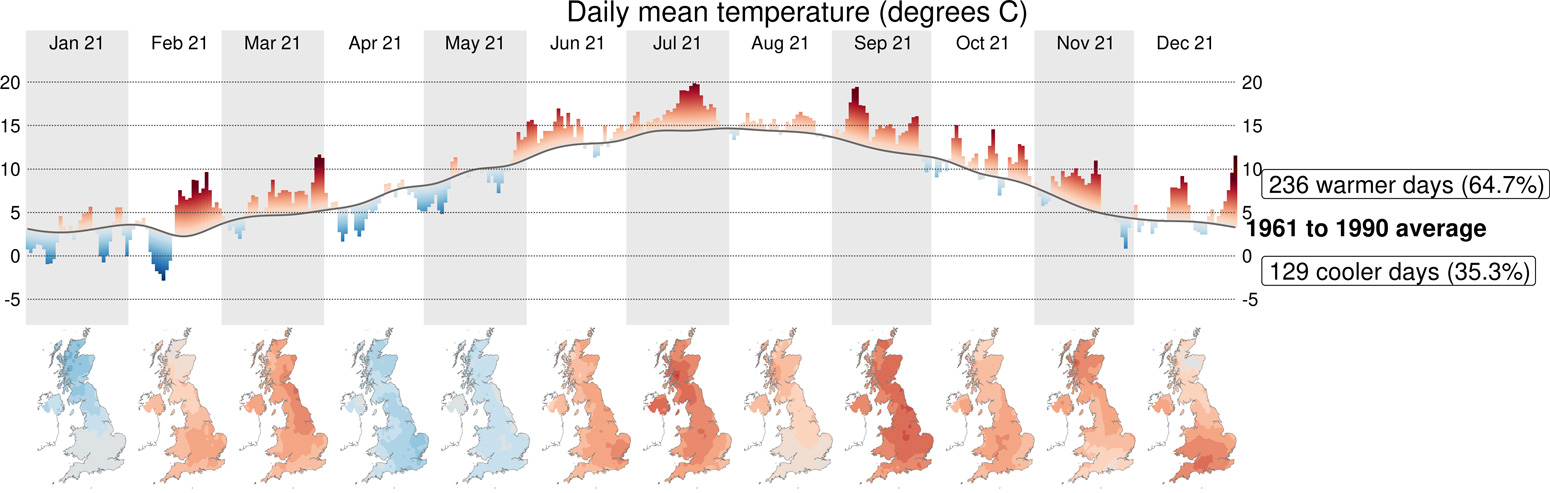
Right up until the 1990s, a year as warm as 2021 would have been regarded as quite extreme. This is highlighted in the figure below, which shows the same daily average chart as above but with a 1961-90 reference period, rather than 1991-2020.
The year 2021 is 0.97C warmer than the 1961-90 average, and against this baseline nearly 65% of days in the year would be warm (red shading) and just 35% cooler (blue shading) than average. This compares to 51% and 49%, respectively, for 1991-2020.
Attribution
The 2021 UK average temperature is an example of a situation that was previously quite rare and unusual, but is now commonplace. Thanks to climate “attribution” science, we can quantify the role of human-caused climate change on these statistics using now well-established attribution methods.
We have conducted analysis using a collection of climate models from the sixth Coupled Model Intercomparison Project (CMIP6). This provides a set of 83 simulations with “all climate forcings” included and 71 with “natural-only forcings” – that is, without the influence of human-caused greenhouse gas emissions included – from 14 contributing models.
The all-forcings scenario extends to 2100 based on the emissions scenario SSP2-4.5 – a “middle-of-the-road” narrative for future human-caused emissions – to indicate the UK’s potential future climate.
From these simulations, the likelihood of experiencing a year warmer than 2021 is 2.5% for a natural climate without human emissions of greenhouse gases, 66% for the present day climate (2011-30) and 89% for a potential future (2081-2100) climate scenario.
It is useful to reflect further on these figures. Human-caused climate change does not mean a continual year-on-year increase in UK temperature, because our local climate is still heavily influenced by natural variability. So, even by the end of the century, we can still expect to experience some years cooler than 2021.
However, the odds are very clearly shifting, such that 2021 temperatures are amongst the warmest relative to our pre-21st century climate, are close to average for the present day and will likely be relatively cool in the future.
Therefore, the use of multiple climatological references, our long legacy of climate observations and state-of-the-art climate modelling allows us to place today’s weather and climate into past, present and future context whether an event is extreme or, as in this case, rather more average.
Winter
Looking at each season specifically, 2021 began on a relatively cold theme. It was overall the coldest January since 2010, and the coldest for any calendar month since the cold and snowy March of 2013.
Storm Christoph (pdf) saw some exceptional rainfall totals during 18-20 January, requiring evacuation of homes in parts of Warrington, Chester and Manchester – complicated by the coronavirus pandemic and snow. The 18-20 January period was provisionally the wettest three-day period on record for the northwest England and north Wales region in a series from 1891.
The cold theme persisted into February with a temperature of -23.0 C recorded at Braemar on 11 February. This was the lowest temperature recorded in the UK since 1995.
As the chart below shows, experiencing temperatures below -20C (dark blue bars) is not overly common. Between 1961 and 1990 it occurred in 14 of 30 winters, but in the period 1991-2020 it occurred in just three years. Seeing temperatures below -15C (light blue bars) has also become much less frequent in recent decades, with 2010 a notable exception.

The meteorological winter (December 2020 to February 2021) was 0.6C colder than the 1991-2020 average, with 119 % of average rainfall and 95% of average sunshine. This is a “cold” winter in our current climate, but not as severe as cold winters of the past.
Spring
A maximum temperature of 24.5C was recorded at Kew Gardens on 30 March, which is only the third day on record with a UK March temperature exceeding 24C. A daily minimum of 12.7C at Kinloss in Moray that day was also Scotland’s equal highest March daily minimum.
After this brief warm interlude, cold and snowy conditions returned rather abruptly with UK average temperatures dropping by almost 10C (pdf) from near-record highs to near-record lows in just a week. The precipitous drop in temperatures from late March into early April can be seen in the dark blue line in the chart below.
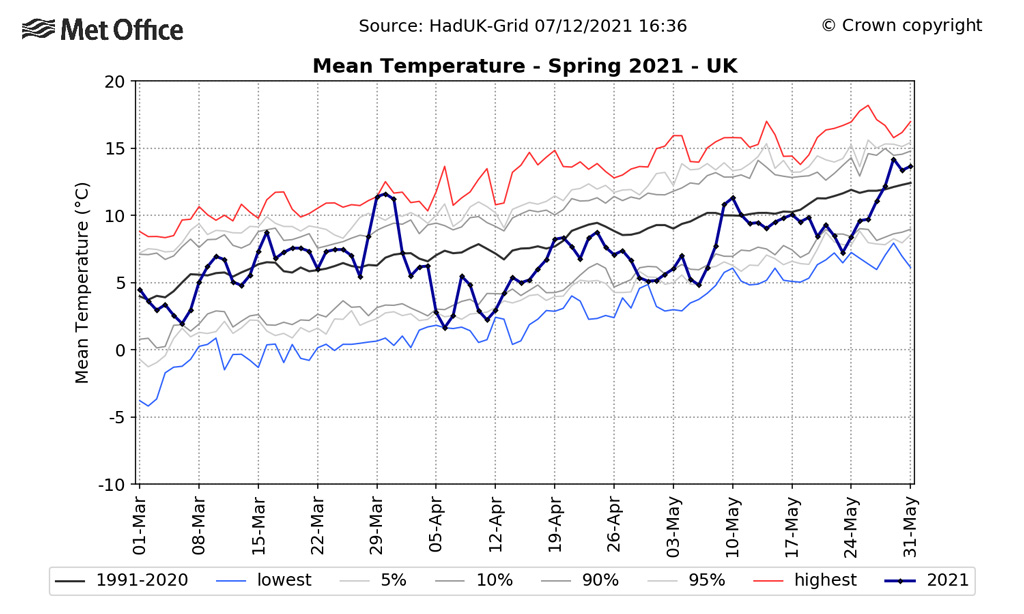
After its cold start, April proceeded to be the frostiest and sunniest April on record for the UK.
In contrast, May was exceptionally wet – the fourth wettest on record for the UK and wettest on record for Wales. Very few days in April or May were warmer than average and the spring overall was the coldest since 2013.
Summer
Early summer was relatively uneventful for UK weather, although parts of southeast England received up to twice their average rainfall for June.
During mid-July there was a more significant heatwave and the Met Office issued its first-ever amber extreme heat warning for western parts of the UK.
On 17 July, Ballywatticock in County Down recorded a temperature of 31.2C, which broke the Northern Ireland temperature record and is the first time a temperature in excess of 31C has been recorded in the region. Temperatures above 30C are rare, having occurred in only eight of the last 60 years. This record did not last for very long though with Castlederg in County Tyrone recording 31.3C a few days later on the 21 July.
Overall, Northern Ireland experienced its third-hottest summer on record, Scotland its fourth, and for the UK as a whole it was the ninth hottest. For Glasgow, ahead of the COP26 climate summit that would be held in November, it was the hottest summer on record in a series going back to 1884.
Storm Evert at the end of July was the first named storm to occur in July, bringing unseasonably strong winds to southern and southwest England with a peak of 77mph at Needles, Isle of Wight. July is climatologically the calmest month of the year, but we do occasionally experience such weather systems at this time of year.
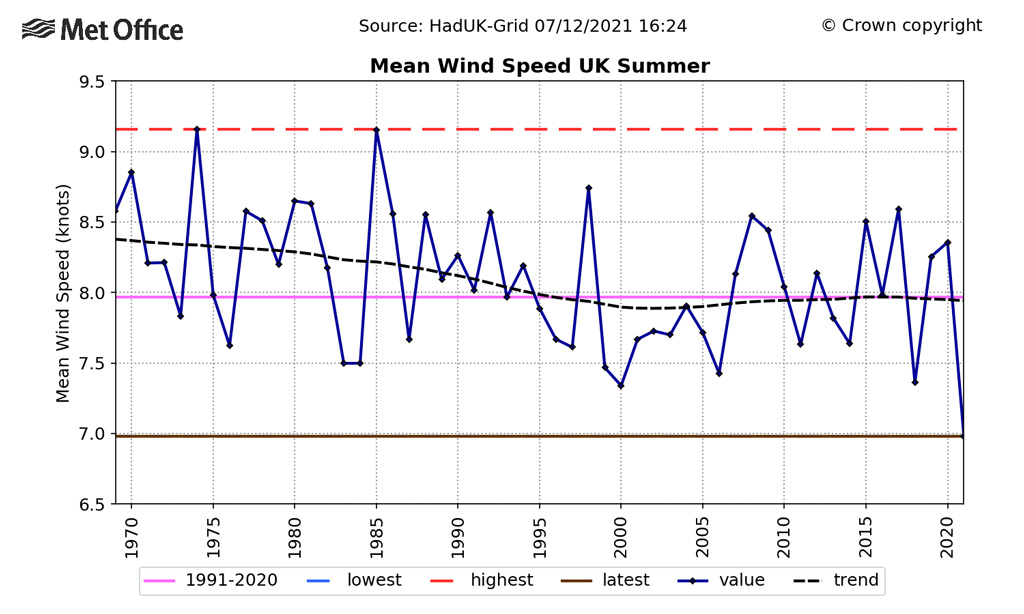
Despite storm Evert, the summer overall was notably calm, with the lowest UK summer average wind speed in a Met Office series since 1969. This is indicated in the chart below, which shows the average summer wind speed each year (dark blue line), with the record low of 2021 highlighted by the brown line.
Atmospheric pressure was anomalously high to the north of the UK – a pattern resulting in calm conditions for many parts of Europe and marginally the warmest summer on record for the continent.
The southeast of England saw rainfall in parts reaching 150% to 200% of the summer average – in contrast to most of the rest of the UK, which had a drier than average summer. This was reflected in sunshine statistics too, with northwestern areas recording a sunnier than average summer season and central and southeast England recording below average.
Autumn
Autumn was persistently warmer than average, with a temperature of 30.8C recorded at Hartpury College in Gloucestershire on the 7 September.
It was the second warmest September on record for the UK, and for Northern Ireland its warmest – with temperatures approaching 2C above the 1991-2020 average. With an average temperature of 14.7C for the UK, September of 2021 was in fact only a little cooler than an “average” August (15.1C).
October was also warm, but a significant wet spell late in the month saw some fairly exceptional rainfall totals, exceeding 400mm over parts of the Cumbrian fells in the last six days of the month. This was a result of a “warm conveyor” (pdf) – a situation associated with an “atmospheric river” bringing moisture-laden air from the subtropics – and shared some similarities with extreme rainfall events of December 2015 and November 2009 (pdf).
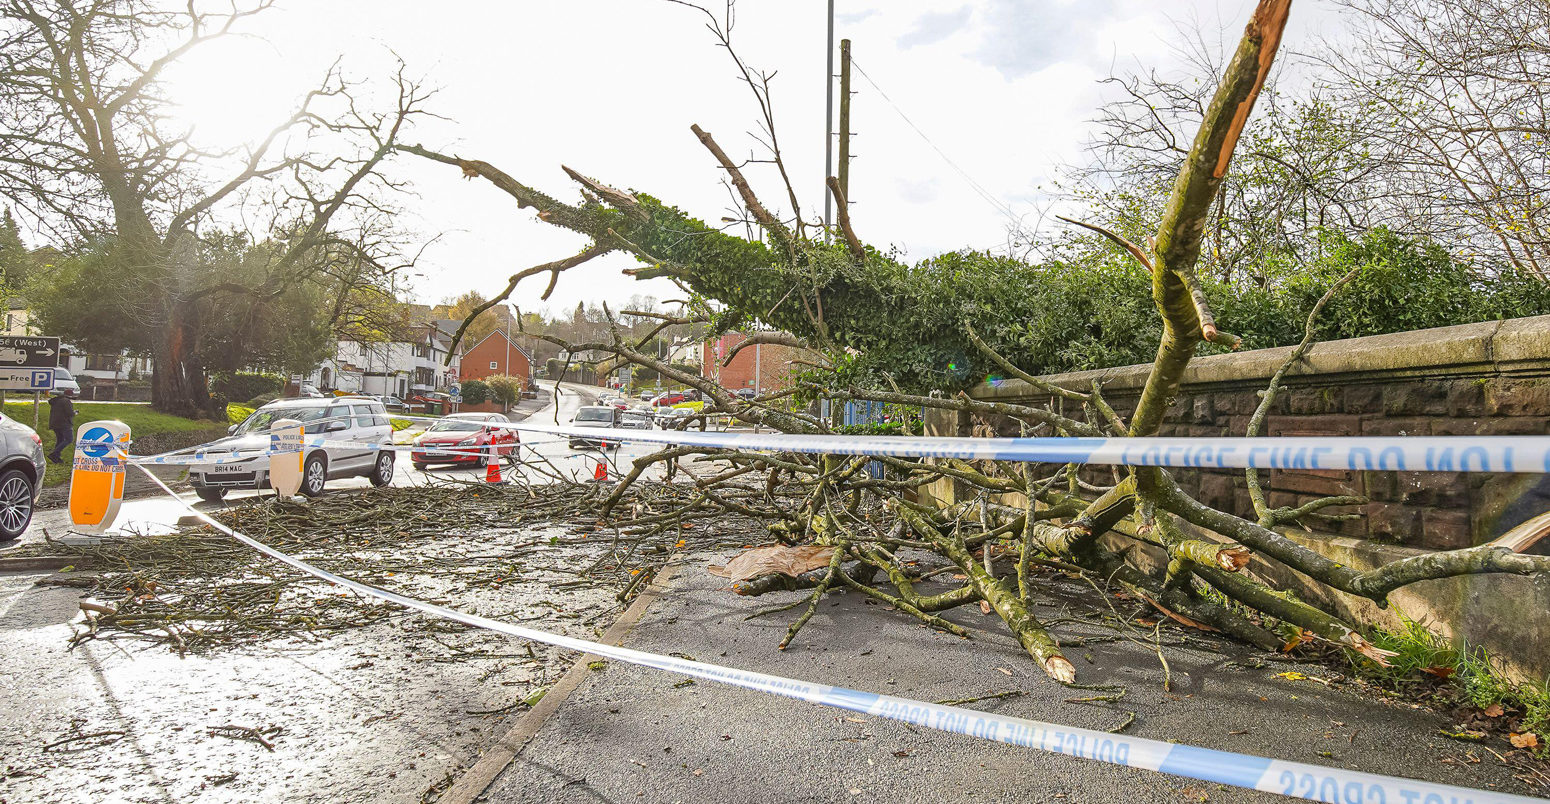
Storm Arwen affected the UK on 26 and 27 November and was accompanied by a rare “red” severe weather warning from the Met Office for wind along the northeast coast of England and Scotland. This was a particularly damaging wind storm and the northerly direction of the winds – as opposed to the prevailing (south)-westerlies – would have been a contributing factor, with cold and snow further complicating some of the recovery. Snow was recorded as falling as far south as Dorset and over higher ground in northern England there were some significant accumulations.
Overall, it was the warmest autumn on record for Northern Ireland and third warmest for the UK (behind 2006 and 2011). The attribution method described previously has also been applied to the autumn statistics. This suggests that UK autumn average temperatures at or above 2021 would be approximately a 1-in-500 year event in a natural climate (with an uncertainty range of 395 to 771 years), which has become a 1-in-4 year event for the present-day climate (uncertainty range of 4.0 to 4.6).
While this autumn is relatively extreme compared to the historical climate, it is expected to become increasingly likely to exceed these temperatures in the future.
As the final month of the year – and the first month of the new winter, December was mild and rather cloudy. The year concluded with the highest New Years Eve temperature on record for the UK – provisionally 16.5C at Bala in north Wales, but this could be replaced by 16.8C at Colwyn Bay once verified. However, these temperatures did not threaten the all-time December UK extreme (18.7C recorded at Achfary, Sutherland on 28 December 2019). The warm spell also meant a provisional record-breaking high temperature for New Year’s Day to see in 2022 – 16.3C at St James Park in London, which beats the previous record of 15.6C at Bude in Cornwall in 1916.
The record breaking warmth over the #NewYear2022 is thanks to a flow of warm subtropical air from the Azores🌡️
— Met Office (@metoffice) January 1, 2022
But the weather is set to briefly turn wintry this week with cold winds originating from the Arctic leading to overnight frosts, and snow for some by Tuesday😰❄️ pic.twitter.com/Vr9yvtOAvy
Further analysis and statistics for 2021 will be published in the Met Office annual State of the UK Climate report in July 2022.