In-depth Q&A: The IPCC’s sixth assessment on how to tackle climate change
Multiple Authors
04.05.22Limiting global warming to 1.5C or 2C would mean “rapid and deep” emissions reductions in “all sectors” of the global economy, says the latest report from the United Nations’ Intergovernmental Panel on Climate Change (IPCC).
Instead, emissions have continued to rise – albeit at a slowing rate – and it will be “impossible” to stay below 1.5C with “no or limited overshoot” without stronger climate action this decade, says the new document, which forms part of the IPCC’s sixth assessment report (AR6).
-
WG1
- In-depth Q&A: The IPCC’s sixth assessment report on climate science
- Scientists react: What are the key new insights from the IPCC’s WG1 report? WG2
- In-depth Q&A: The IPCC’s sixth assessment on how climate change impacts the world
- Scientists react: What are the key new insights from the IPCC’s WG2 report? WG3
- In-depth Q&A: The IPCC’s sixth assessment on how to tackle climate change
- Scientists react: What are the key new insights from the IPCC’s WG3 report?
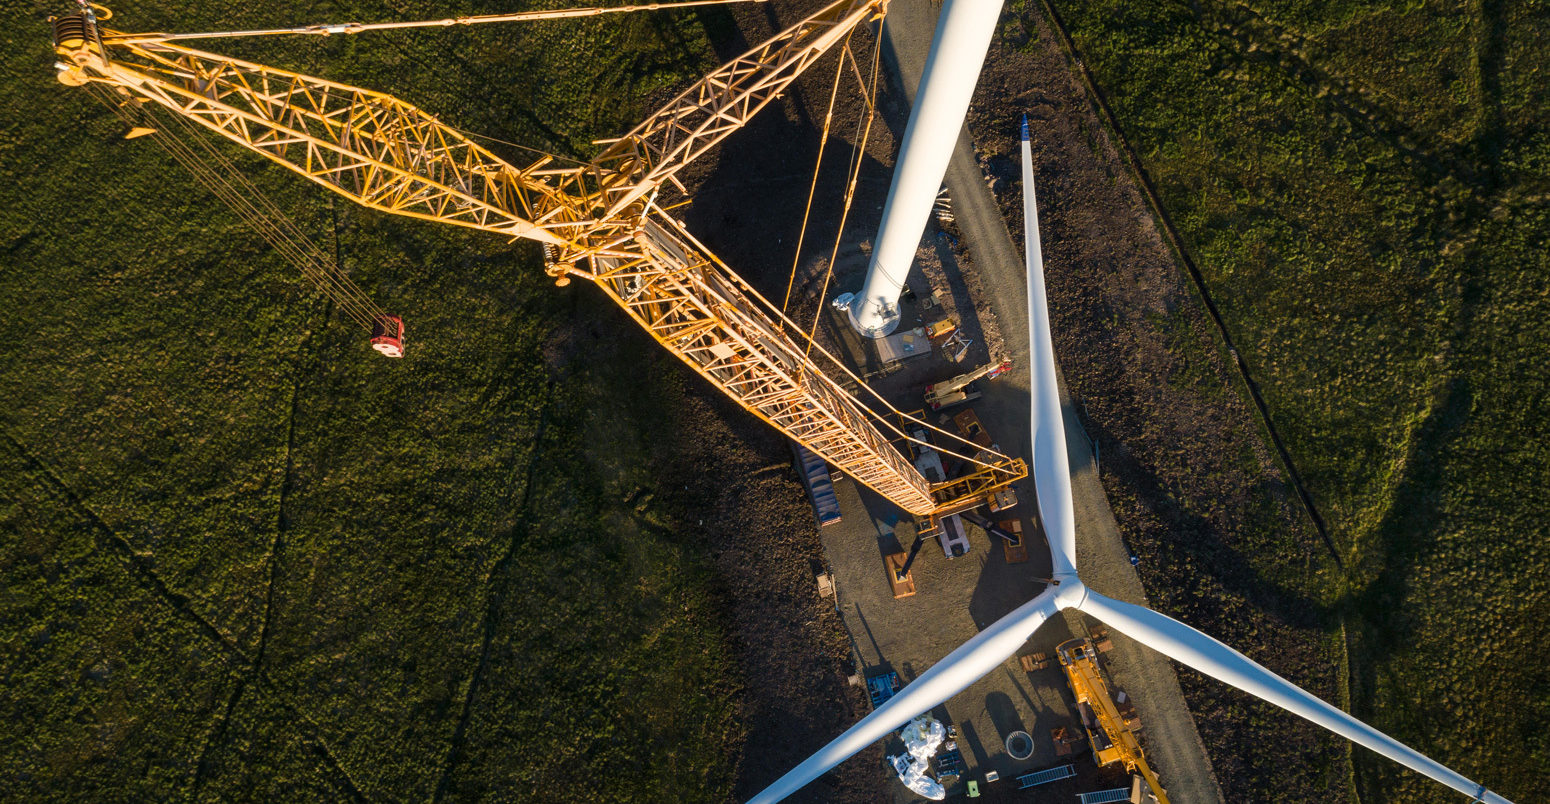
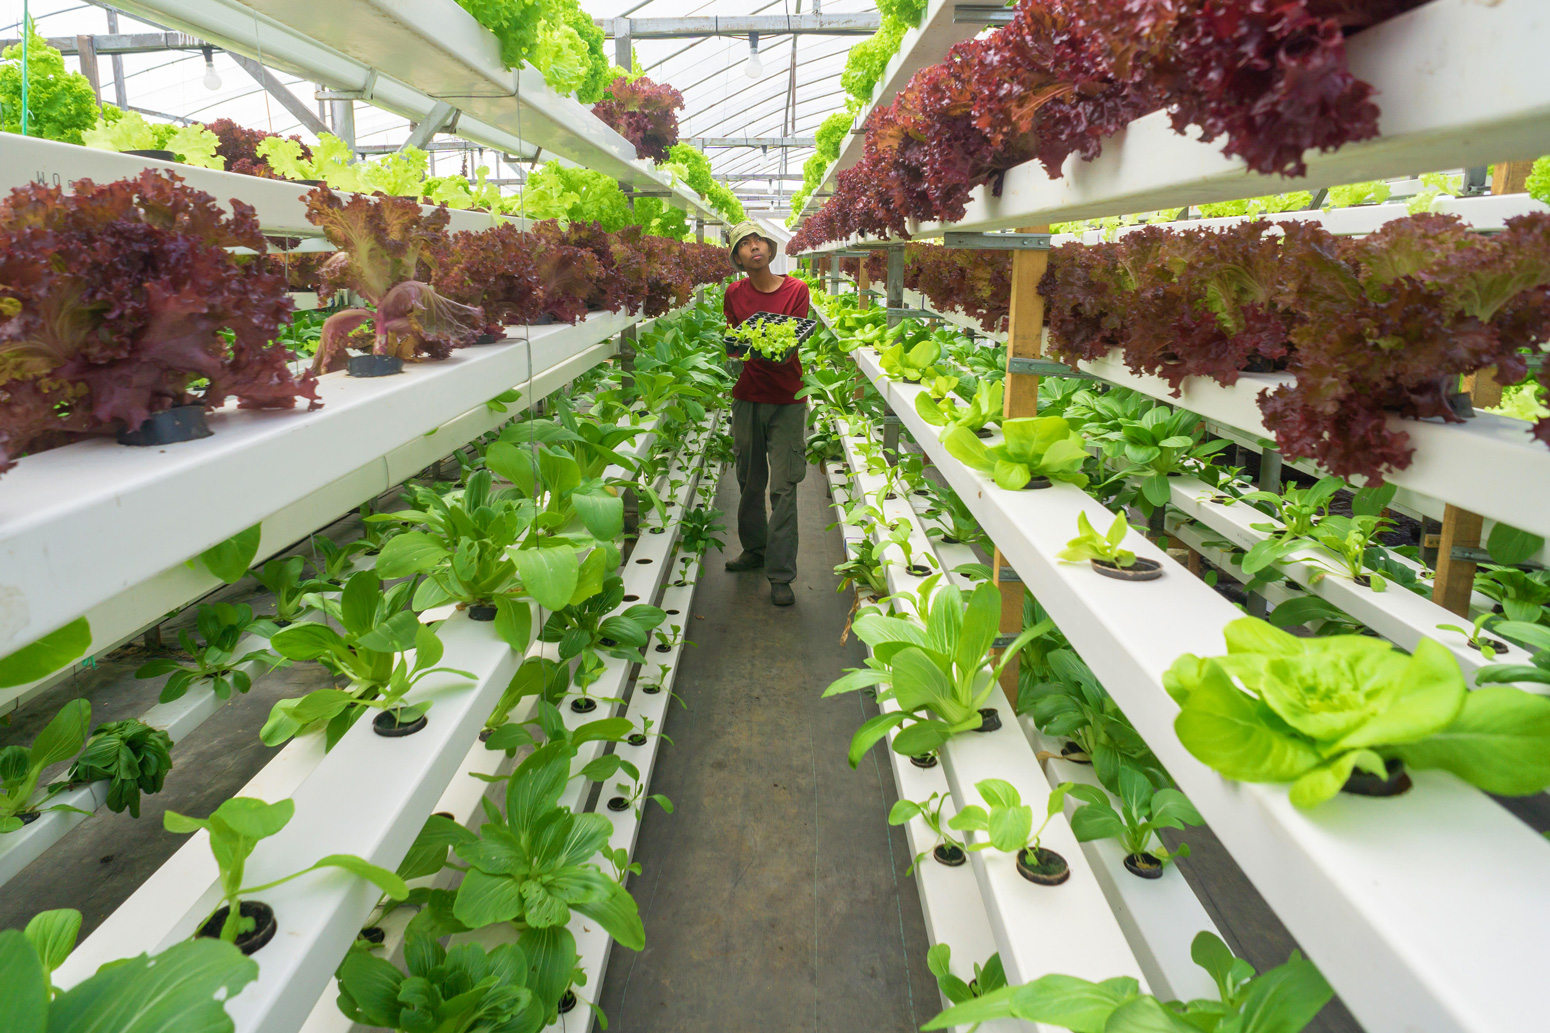
It outlines how these emissions cuts could be achieved, including “substantial” reductions in fossil fuel use, energy efficiency, electrification, the rapid uptake of low-emission energy sources – particularly renewables – and the use of alternative energy carriers, such as hydrogen.
Over the past decade, rapid cost reductions in key technologies – such as wind, solar and batteries – mean that continuing to use high-carbon energy may be “more expensive” than the alternatives, the report says. Overall, the economy would benefit from limiting global warming, it adds.
Alongside rapid emissions reductions, the report says that carbon dioxide removal (CDR) will be “unavoidable” to reach net-zero. For the first time, it devotes a chapter to the “demand-side”, including diets and consumption patterns. Early action and demand-side solutions can minimise the need for CDR and give more time to bring CO2 emissions to net-zero, it says.
The report follows the publication of the first part of AR6, released in August last year, which set out how and why the Earth’s climate is changing. The second part of AR6, released in February, laid out the impacts of climate change and said the threat being posed to humans and the planet was “unequivocal”.
Over the past two weeks, government delegations have been meeting during a two-week approval session to agree on the high-level “summary for policymakers”. The approval session was the longest ever, spanning more than 150 hours of virtual meetings, as countries struggled to find consensus on some of the language in the report.
The report tracks current efforts to tackle climate change – and what would be needed to limit warming to 1.5C or well-below 2C above pre-industrial temperatures. Its key conclusions include:
- “Global net anthropogenic [greenhouse gas] GHG emissions during the decade (2010-19) were higher than any previous time in human history (high confidence).”
- Although at least 90% of global GHG emissions are covered by climate targets, only 53% are covered by “direct” climate laws.
- Following current climate pledges to 2030 would make it “impossible” to limit warming to 1.5C with “no or limited overshoot” – and “strongly increas[e] the challenge” for 2C.
- “The global economic benefit of limiting warming to 2C is reported to exceed the cost of mitigation in most of the assessed literature (medium confidence).”
- In pathways limiting warming to 1.5C with no or limited overshoot, global CO2 emissions peak “at the latest before 2025” and then fall to 48% below 2019 levels in 2030, reaching net-zero by the “early 2050s”. Global GHGs fall 43% by 2030 and 84% by 2050.
- All scenarios limiting warming to 2C or below include “greatly reduced” fossil fuel use, with unabated coal being “completely” phased out by 2050.
- “The deployment of carbon dioxide removal (CDR) to counterbalance hard-to-abate residual emissions is unavoidable if net-zero CO2 or GHG emissions are to be achieved.”
- Accelerated climate action is “critical” to achieving sustainable development.
In a video message at the launch of the report, UN secretary-general António Guterres said it was a “file of shame, cataloguing the empty pledges that put us firmly on track towards an unlivable world”. He added:
“Climate activists are sometimes depicted as dangerous radicals. But the truly dangerous radicals are the countries that are increasing the production of fossil fuels…[The report] sets out viable, financially sound options [for cutting emissions] in every sector that can keep the possibility of limiting warming to 1.5C alive.”
In the in-depth Q&A below, Carbon Brief unpacks the key findings of the report. Please use the links to navigate between the sections.
- What is the Working Group III report?
- How have global emissions been changing?
- How do current policies and pledges compare to scenarios assessed by the IPCC?
- What would it take to limit warming to 1.5 or 2C?
- How can shifting peoples’ demand for products and services cut emissions?
- What impact can the food system and dietary choices have on emissions?
- How must global energy systems change to limit warming?
- How does land add to climate change and how can it help soak up CO2?
- What does the report say about CO2 removal and solar geoengineering?
- What role can cities and buildings play in cutting emissions?
- What needs to happen in the transport sector to cut CO2?
- How can industry be decarbonised?
- What climate policies are being implemented and are they working?
- Are the Paris Agreement and climate finance helping cut emissions?
- What are the costs and benefits of efforts to cut emissions?
- How much innovation and new technology is needed to hit climate goals?
- Will meeting climate goals help or hinder sustainable development?
1. What is the Working Group III report?
The new report is the third part of the IPCC’s latest assessment cycle – the sixth set of “assessment reports” since its foundation in 1988. The previous set – the fifth assessment report (“AR5”) – was published in 2013-14. (See Carbon Brief’s coverage here.)
The IPCC’s efforts for AR6 are divided into three “working groups”:
- Working Group I (WG1): The physical science basis
- Working Group II (WG2): Impacts, adaptation and vulnerability
- Working Group III (WG3): Mitigation of climate change
Back in September 2017, the IPCC agreed outlines for all three working groups. And, in April 2018, the IPCC announced the authors who had been selected – more than 700 in total, who all work on a voluntary basis.
The WG3 report is the third of these to be published, following the WG1 report in August 2021 and the WG2 report in February this year. The final part will be a synthesis report, which is slated for September.
In addition to the full assessment reports, the IPCC’s sixth assessment cycle has also included shorter “special reports” on three topics:
- Global warming of 1.5C (“SR15”) in 2018
- Climate change and land (“SRCCL”) in 2019
- The ocean and cryosphere in a changing climate (“SROCC”) in 2019
(In addition, the IPCC has published a 2019 “methodology report” on guidelines for national greenhouse gas [GHG] inventories.)
A key message from these reports “is the urgency to mitigate GHG emissions in order to avoid rapid and potentially irreversible changes in natural and human systems”, the new report says.
-
WG1
- Media reaction: IPCC’s new climate science report and what it means for the world
- Analysis: What the new IPCC report says about when world may pass 1.5C and 2C
- Explainer: What the new IPCC report says about extreme weather and climate change
- IPCC: How the AR6 WG1 summary for policymakers compares to its predecessor WG3
- Analysis: What the new IPCC report says about how to limit warming to 1.5C or 2C
- Guest post: How not to interpret the emissions scenarios in the IPCC report
- Guest post: Why estimates of the ‘cost’ of climate action are overly pessimistic
For WG3 specifically, the aim is to assess “the current state of knowledge on the scientific, technological, environmental, economic and social aspects of climate change mitigation”. It takes into account “new literature, methodological and recent developments, and changes in approaches towards climate change mitigation since the IPCC AR5 report was published in 2014”.
The “global science and policy landscape on climate change mitigation has evolved since AR5”, the report notes. In particular, the Paris Agreement and the UN Sustainable Development Goals (SDGs) have been adopted globally, the authors note, which have “set out a globally agreed agenda within which climate mitigation efforts must be located”.
At the same time, climate mitigation policies around the world “have grown in both number and shape”, the authors say, and the “average rate of annual increase of CO2 emissions has declined”.
However, “GHG emissions globally continued to rise, underlining the urgency of the mitigation challenge”, the authors note.
In addition, “strong differences remain” between which countries have the responsibility and capability to take climate action, they add:
“These differences, as well as differences in the impact of climate change, point to the role of collective action in achieving urgent and ambitious global climate mitigation in the context of sustainable development, with attention to issues of equity and fairness as highlighted in several chapters of the report.”
Over the course of the report-writing process, three drafts have been reviewed by numerous experts and governments, and the authors have addressed almost 60,000 comments.
With the main report complete, the final step has been a line-by-line agreement of the short summary for policymakers (SPM) document by government delegates. This approval meeting has been carried out virtually over the past two weeks, although it overran into the final weekend, pushing the report’s publication back by six hours.
This was the longest #IPCC approval Plenary in the 34-year long history of @IPCC_CH. Due to end on April 1st (probably a bad date😉), it will formally end on April 4. The world will have to wait a little more than expected to read it but it will be another landmark #ClimateReport
— Prof. Jean-Pascal van Ypersele (@JPvanYpersele) April 3, 2022
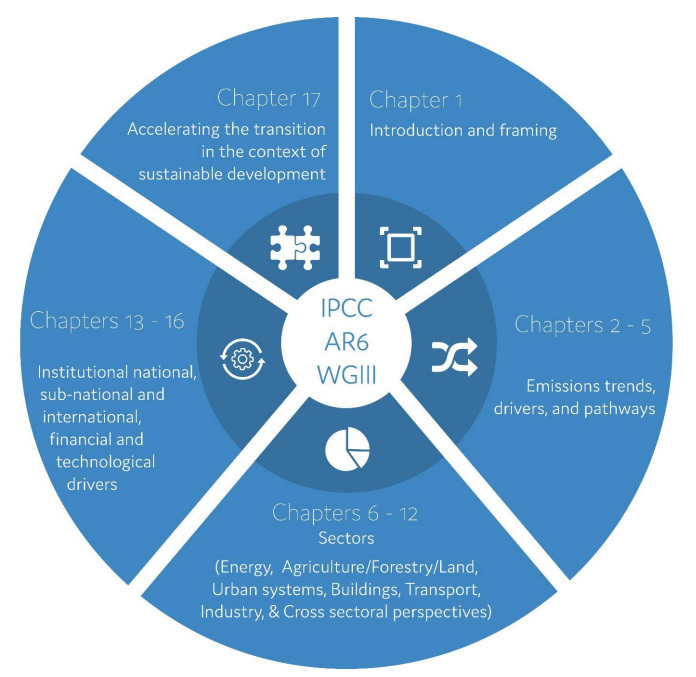
The final report is made up of 17 chapters, which are divided into five main parts (see figure below):
- Introduction and frameworks;
- Emission trends, scenarios and pathways;
- Sectors;
- Institutional dimensions including national and international policy, financial and technological mitigation drivers; and
- Conclusions.
It also comes with a summary for policymakers (SPM), technical summary and various annexes. While the WG1 and WG2 reports clocked in at more than 3,000 pages, the WG3 comes in just below this figure.
For the first time, the WG3 report includes “chapters dedicated to cross-sectoral perspectives, demand, services and social aspects of mitigation and innovation, technology development and transfer”, the authors say. It also gives “greater attention than AR5 to social, economic and environmental dimensions of mitigation actions, and institutional, legal and financial aspects”.
The report describes collaboration with the other IPCC working groups, which is reflected in a series of “cross-working group boxes”. These cover topics such as the economic benefits from avoided impacts as a result of mitigation, climate change and urban areas, mitigation and adaptation through the “bioeconomy”, and solar radiation modification.
The WG3 report follows the same set of “calibrated language” that AR5 used to communicate levels of certainty behind the statements it included.
These terms fall into two categories. The first is “confidence”, which reflects the authors’ qualitative judgements on the soundness of a particular finding or statement. The second is “likelihood”, which is used when the uncertainties around a statement can be quantified. These sorts of probabilistic judgments can be based on methods such as statistical analysis or expert judgments.
These statements of confidence and likelihood – shown in the figure from the WG2 report below – are presented in italics in the report and in this article, too.
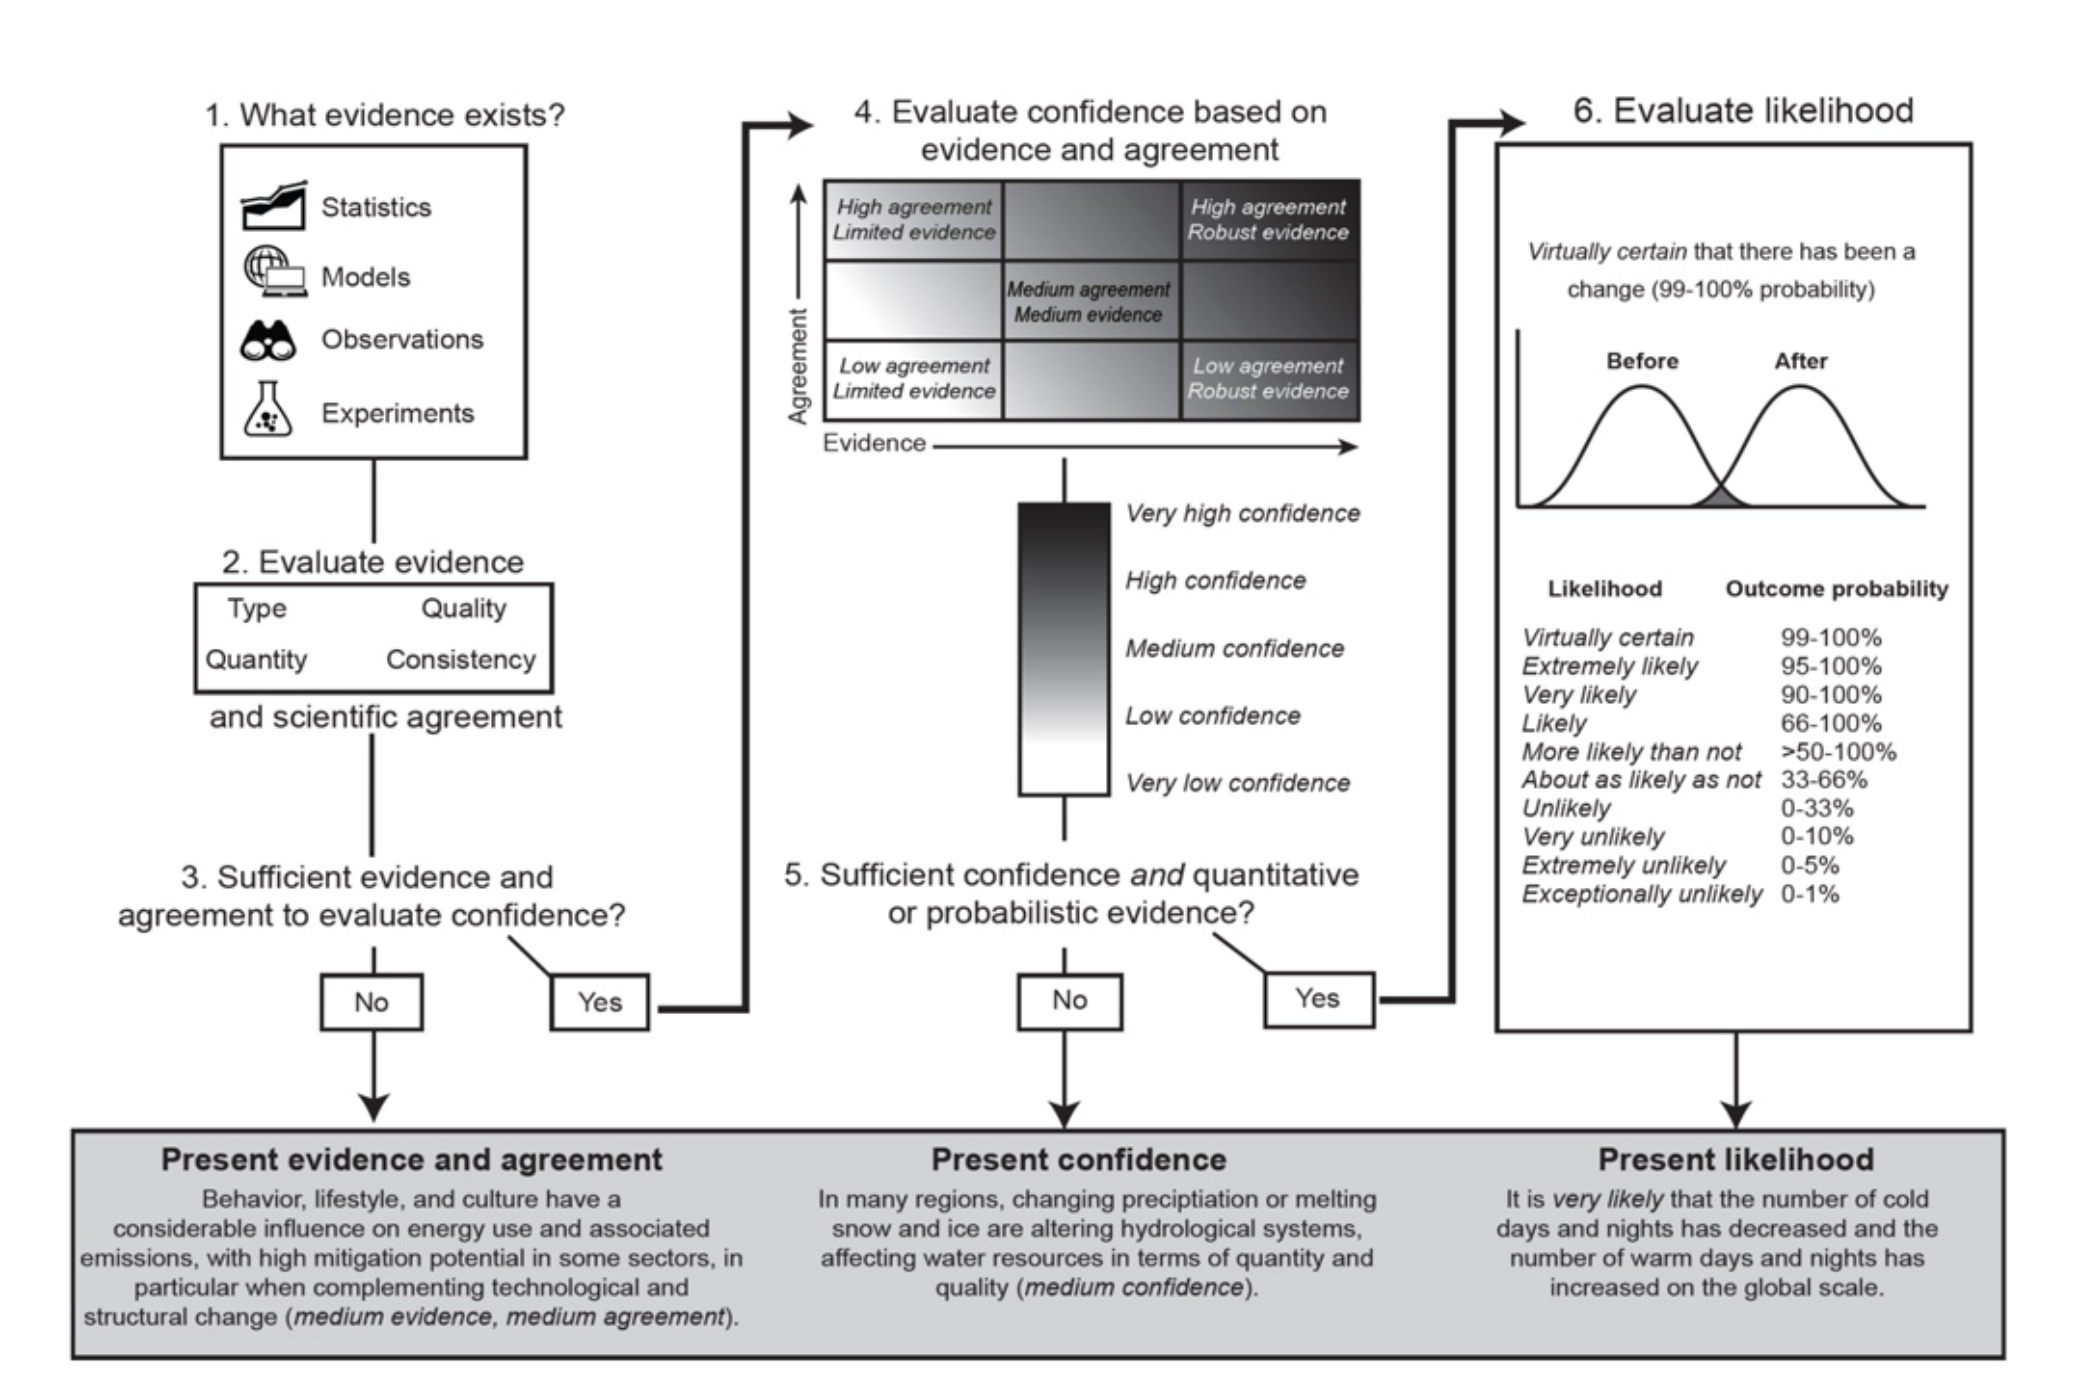
For example, the technical summary of the report says – with high confidence – that “global net anthropogenic GHG emissions during the decade (2010-19) were higher than any previous time in human history”.
Meanwhile, it adds with medium confidence that “the lifestyle consumption emissions of the middle income and poorest citizens in emerging economies are between 5-50 times below their counterparts in high-income countries”.
2. How have global emissions been changing?
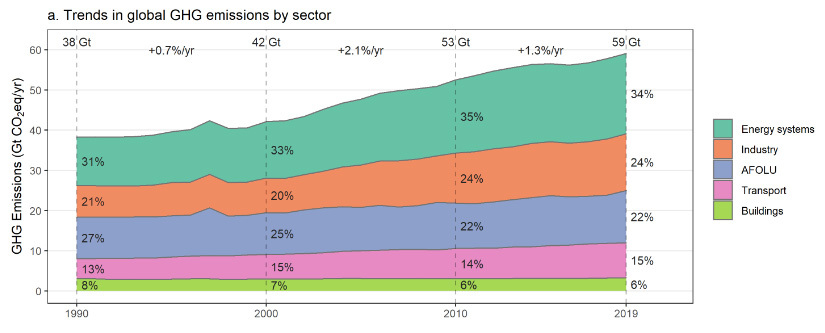
During the decade spanning 2010-9, human-driven emissions of greenhouse gases (GHGs) “were higher than at any previous time in human history”, the report states with high confidence.
In 2019, humanity emitted 59.6bn tonnes of carbon dioxide equivalent (GtCO2e) with a range of uncertainty of ±6.6GtCO2e. There is medium confidence that the net CO2 emissions over the past decade are “about the same size as the remaining carbon budget for keeping warming to 1.5C”, meaning another decade of similar emissions would use this budget up.
The growth in emissions has “varied, but persisted” for all GHGs during the past decade. However, there is also high confidence that the annual growth rate over this decade was lower than it was in the prior one – 1.3% per year for 2010-9, as compared to 2.1% per year for 2000-9.
The chart below shows the growth of the four GHGs (or classes of GHGs) that are tracked in the report between 1990-2019, as well as the changes in their relative contributions to the overall emissions (CO2 is divided into emissions from fossil fuels and industry, FFI, and emissions from land use, land-use change and forestry, or LULUCF).
The chart also shows the level of CO2e emissions as calculated using the values that different IPCC reports estimated for GWP100 – the 100-year global warming potential used to standardise the emissions of different greenhouse gases into CO2e.
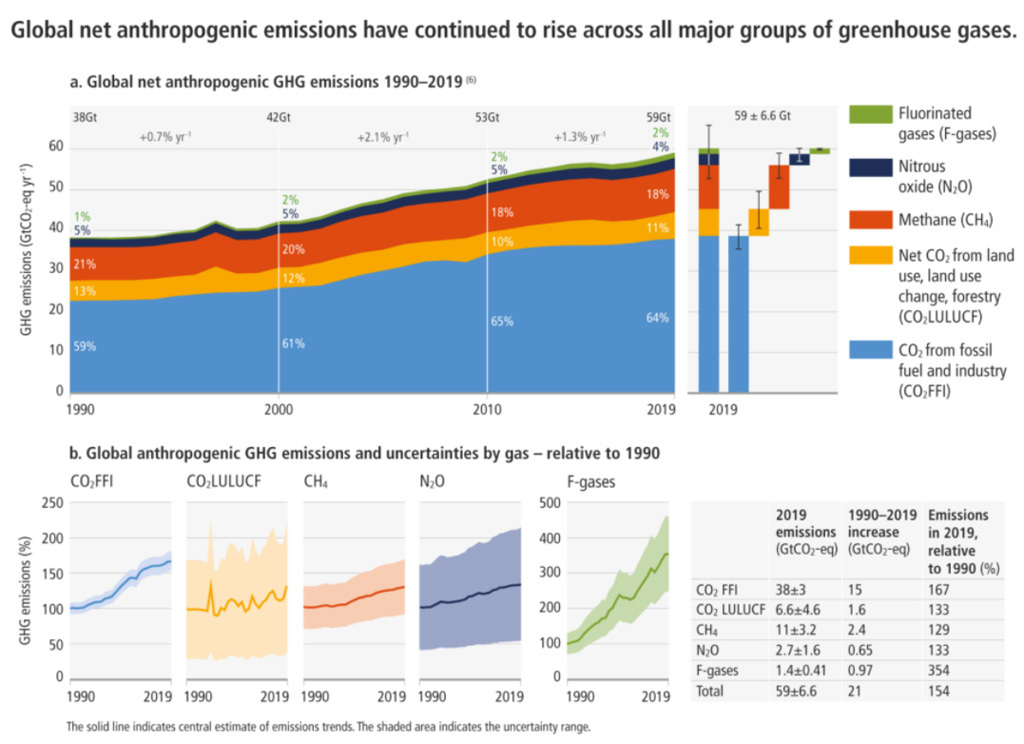
The major non-CO2 GHGs discussed in the report are methane, nitrous oxide and fluorinated gases – although this last category excludes chlorofluorocarbons and hydrofluorocarbons, which are covered by the Montreal Protocol, but not the Paris Agreement.
In 2019, methane emissions were 11±3.2GtCO2e, nitrous oxide emissions were 2.7±1.6GtCO2e and fluorinated gases were 1.4±0.41 GtCO2e.
Since 1990, methane emissions have grown by 29% and nitrous oxide emissions by 33%. Emissions of CO2 from fossil fuels and industry have grown by 67% over that same period.
Meanwhile, emissions of fluorinated gases have grown by 254% since 1990, but the report notes that this growth “occurred from low levels”. It adds that fluorinated gas emissions “are no longer negligible”.
One of the major uncertainties in calculating the world’s emissions is the contribution of LULUCF. These sectors “have shown little long-term change” and the uncertainties associated with measuring these emissions “preven[t] the detection of statistically significant trends”.
On average, the estimates of LULUCF emissions show a slight increase, but different estimates have diverging trends. For example, the Global Carbon Project last year reanalysed historical LULUCF emissions, finding they have been declining by an average of 25% over the past decade – resulting in effectively flat overall CO2 emissions over that time period, albeit with significant uncertainty.
For the year 2019, about 20GtCO2e – or one-third of annual emissions – were attributable to the energy sector, while the direct emissions from industry contributed about one-quarter of the total, 14GtCO2e. The other major contributing sectors were agriculture, forestry and land use, known as AFOLU (13GtCO2e, or 22%), transport (8.7GtCO2e, or 15%) and buildings (3.3GtCO2e, or 6%). The category of AFOLU includes all CO2 emissions from LULUCF as well as non-CO2 emissions from agriculture, such as livestock emissions and those from fertiliser use.
When emissions from electricity and heat are added to direct emissions from various sectors, industry’s share climbs to 34% and that of buildings leaps to 16%.
The strongest drivers of increased emissions from fossil fuel combustion were increases in per-capita GDP and population growth, the report says, responsible for emissions gains of 2.3% and 1.2% per year, respectively.
Improved energy efficiency in certain sectors has led to some “decarbonisation gains”, with the energy needed to generate each unit of GDP falling by 2% per year. But these gains “have been largely wiped out by increases in demand for goods and services”.
Similarly, annual gains of 0.3% in the carbon intensity of the global economy – the emissions per unit of energy use – have been insufficient to offset rising demand.
There is high confidence that emissions rose “across all sectors and subsectors”, with transportation and industry showing the most rapid growth. Average annual growth in the transport sector was about 1.8% over the past decade, with direct emissions from industry growing annually by 1.4% and those from the energy sector by 1%.
The report notes that these patterns are “different to growth patterns observed in the previous decade”. Between 2000-9, annual growth in the transport sector was also about 1.8%, but over that time, industry grew annually by 3.4% and energy by 2.3%.
The charts below show global emissions by sector, as well as the overall emissions growth rate for each decade from 1990-2019. The lower panels show emissions in each sector divided among 10 world regions.
Total emissions, per-capita emissions and emissions trends all “diverge starkly” between countries and regions. So-called “developed countries” have “sustained high levels” of per-capita emissions – more than double the per-capita emissions of Asia and the Pacific, Africa or Latin America. The group of least-developed countries has the lowest emissions per capita and has “contributed only a negligible proportion of historic GHG emissions growth”.
Developed countries, on the whole, “have not managed to reduce GHG emissions substantially” over the past several decades, the report states, while the bloc of “Asia and the Pacific” has “rapidly increased [its] share of global GHG emissions” since 1990, and “particularly since the 2000s”.
With the exception of eastern Europe and west-central Asia, emissions growth slowed “across all regions” of the world in 2010-9 as compared to 1990-2010. The slowing of global emissions growth “was primarily triggered by substantial reductions” of emissions growth in China.
Emissions from fossil fuel combustion in the three “developing regions” of Asia and the Pacific, Africa and Latin America grew by 26% over the past decade, as compared to 260% growth in the prior two decades. The fossil fuel combustion emissions of developed countries shrank by about 10% over both of those periods.
However, emissions also vary widely with income level within a country. There is robust evidence and high agreement that the wealthiest 10% of people are responsible for 34-45% of consumption-based household emissions. The report notes that this 10% is found on all continents.
In countries that have succeeded in reducing their emissions, it has been a combination of “both climate and non-climate policies and factors, including structural changes” that have led to these decreases, the report finds. Most of the reductions occurred in the energy and heating sectors, while transportation emissions have continued to rise after peak emissions were reached “in many cases”.
Understanding how socioeconomic factors affect mitigation efforts is “crucial”, the report writes. It notes a “long-standing discussion” on decoupling – that is to say, if economic growth can be sustained without further growth in carbon emissions or use of natural resources. Some studies have found it “feasible” at the national level, while scepticism remains over “whether absolute decoupling can be achieved at a global scale”, the report adds.
The report cites a few examples of countries that have managed “absolute decoupling” of their consumption-based emissions from GDP growth over the first half of the decade – including the US, Cuba and some EU countries – but makes note of the “short observation period” over which this decoupling occurred.
It also calls for further research on how consumption-based drivers of emissions “can be mitigated by demand management, alternative economic models, population control and rapid technological transition”.
Between the indirect emissions of producing items and the direct emissions of energy and transportation associated with consumption, household consumption is both the largest component of a country’s GDP and the “main contributor to greenhouse gas emissions”. Consumption patterns and the associated emissions are affected by numerous factors, including socioeconomic status, access to public services and individual choice and values.
In “western countries”, the report says, transportation, housing and food consumption combined have the “largest contribution to the household carbon footprint”. In EU-25 countries, for example, these categories add up to 58.5% of the average household footprint. Meat-eating alone contributes 5.2% of the household footprint in the US.
Urban and rural households also have very different consumption patterns and emissions. Urban households “tend to have higher emissions” than their rural counterparts, but with different patterns – urban households have higher emissions associated with services such as education and entertainment, while rural households have higher transportation and food emissions.
One study cited in the report notes that urbanisation is associated with economic growth and therefore higher emissions. The report also states that “centrality and location” influence urban household emissions and that “higher population density is associated with lower per capita emissions”. It adds:
“Commuting distance and access to public transportation, recreation areas, city centres, public services and shops are other important neighbourhood-specific determinants of carbon emissions.”
The report also discusses emissions embodied in trade (EET) – those associated with producing goods exported from or imported into a country. An increase in trade volume over the past four decades has meant rising EET since the 1980s, with a peak in 2006.
As of 2014, about one-quarter of global emissions are “embodied in the international trade of goods and services”. Developed countries are a major net importer of CO2 emissions, while Asia and the Pacific is the largest net exporter.
Notably, the report states with high confidence that since the peak in 2006, there has been a net reduction in traded CO2 – and in the transfer of embodied carbon from developing to developed countries – as the falling carbon intensity of traded goods has offset higher trade volumes.
3. How do current policies and pledges compare to scenarios assessed by the IPCC?
WG3 draws on a database of more than 3,000 different future emissions pathways. They are primarily generated by integrated assessment models (IAMs) that examine energy technologies, energy use choices, land-use changes and societal trends that cause – or prevent – greenhouse gas emissions. (For more details on how IAMs work, see Carbon Brief’s detailed Q&A).
These scenarios are broadly divided into eight different “climate categories”, labelled C1 through to C8, based on 21st century warming. These assignments are based on the use of climate model emulators called MAGICC and FaIR, as the IAMs do not calculate temperatures themselves.
In addition to the climate categories, seven illustrative pathways (IPs) were defined representing outcomes under policies in place today (Cur-Pol), outcomes if 2030 commitments are met but limited additional climate policies are enacted (Mod-Act), and five deep mitigation strategies that limit warming to below 2C or to 1.5C using different types of approach.
The table below shows a number of key characteristics of each climate category C1-C8 and the relationship between these categories and the illustrative pathways. For each category, it highlights the median value across all relevant model pathways, as well as the range (5th to 95th percentile) across all models in each category in brackets. (More details can be found in Table SPM.1 of the report.)
| Category | Description | IPs | Scenarios | Cumulative CO2 | Peak warming | 2100 Warming | Peak CO2 emissions year | Net-zero CO2 year | Cumulative net-negative emissions |
|---|---|---|---|---|---|---|---|---|---|
| C1 | Below 1.5C with no or limited overshoot | SD, LD, Ren | 97 | 320 (-210 to 570) | 1.6 (1.4 to 1.6) | 1.3 (1.1 to 1.5) | 2020-2025 (all < 2025) | 2050-2055 (2035-2070) | -220 (-660 to -20) |
| C2 | Below 1.5C with high overshoot | Neg | 133 | 400 (-90 to 620) | 1.7 (1.5 to 1.8) | 1.4 (1.2 to 1.5) | 2020-2025 (all < 2030) | 2055-2060 (2045-2070) | -360 (-680 to -60) |
| C3 | Likely below 2C | GS | 311 | 800 (510 to 1,140) | 1.7 (1.6 to 1.8) | 1.6 (1.5 to 1.8) | 2020-2025 (all < 2030) | 2070-2075 (2055 to after 2100) | -40 (-290 to 0) |
| C4 | Below 2C | 159 | 1,160 (700 to 1,490) | 1.9 (1.7 to 2.0) | 1.8 (1.5 to 2.0) | 2020-2025 (all < 2030) | 2080-2085(2065 to after 2100) | -30 (-280 to 0) | |
| C5 | Below 2.5C | 212 | 1,780 (1,260 to 2,360) | 2.2 (1.9 to 2.5) | 2.1 (1.9 to 2.5) | 2020-2025 (all < 2030) | 0 (-160 to 0) | ||
| C6 | Below 3C | Mod-Act | 97 | 2,790 (2,440 to 3,520) | 2.7 (2.4 to 2.9) | 2030-2035 (all < 2090) | 0 | ||
| C7 | Below 4C | Cur-Pol | 164 | 4,220 (3,160 to 5,000) | 3.5 (2.8 to 3.9) | 2085-2090 (some > 2100) | 0 | ||
| C8 | Above 4C | 29 | 5,600 (4,910 to 7,450) | 4.2 (3.7 to 5.0) | 2080-2085 (some > 2100) | 0 |
The Cur-Pol pathway, where current policies are continued, turns out to be tricky to categorise. The scenario ends up with a best-estimate warming of almost precisely 3C in 2100, making it overlap with both the 2.5C-3C (C6) and 3C-4C (C7) categories, either on the high end of the former or the low end of the latter.
More broadly, as WG3 lead author Prof Detlef van Vuuren tells Carbon Brief, current policy scenarios assessed by WG3 range from 2.2C to 3.5C in 2100, “consistent with the C5-C7 categories”.
WG3 provides a look at possible futures which is informed by progress that the world has made in enacting climate policies and making clean energy cheaper. Rather than wind back the clock to imagine a world without any climate policy, the scenarios considered are increasingly incorporating implemented climate policies.
The WG3 authors suggest that no-climate-policy reference scenarios can be an important tool for assessing mitigation costs, but that “as countries move forward with climate policies of varying stringency, no-climate-policy baselines are becoming increasingly hypothetical”.
However, the range of outcomes under current policies still pose significant risks to human and natural systems. Climate system uncertainties are large enough that it is difficult to fully rule out warming above 4C in the absence of stronger future climate policy. The report makes it clear that a failure to peak and reduce emissions this decade will put Paris goals increasingly “out of reach”.
The figure below shows both CO2 emissions (left) and total greenhouse gas emissions (right) for the illustrative pathways (coloured lines), as well as the broader range of current policy scenarios (grey wedge), C3 (orange wedge) and C1 (green) scenarios.
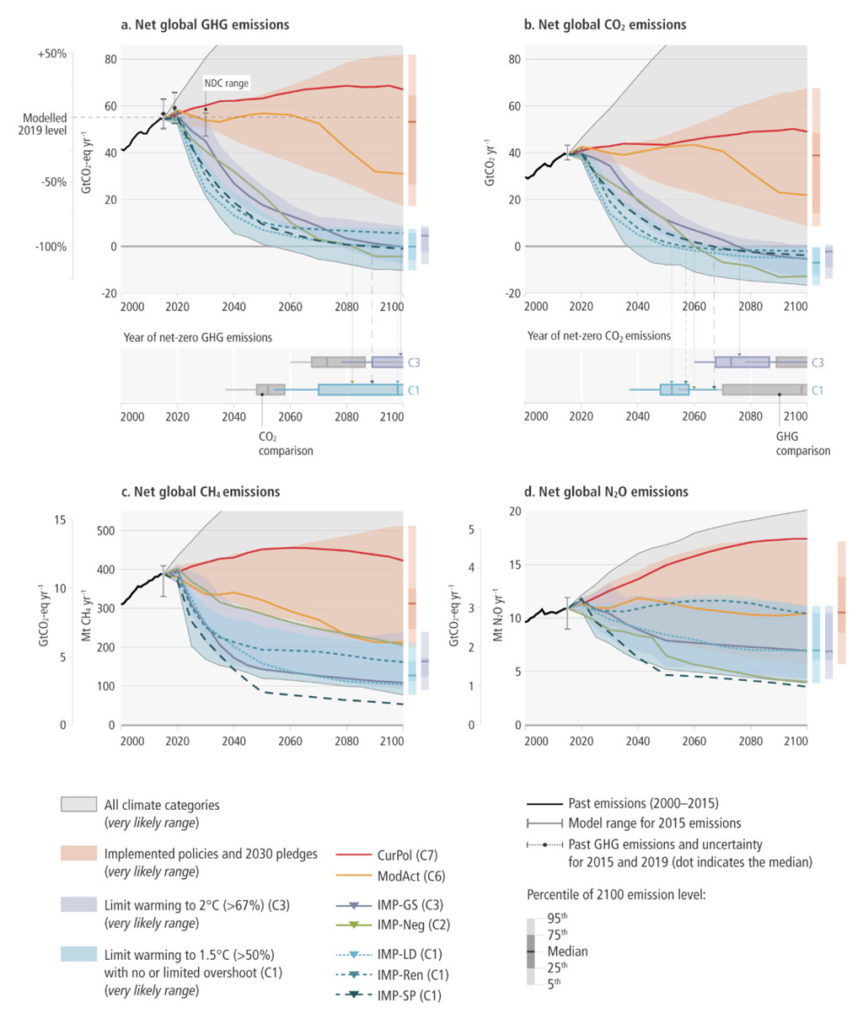
The current policy scenarios assessed in the AR6 WG3 (including Cur-Pol) imply a relative flattening of emissions in the future compared to the growth over the past few decades, with CO2 emissions in 2100 anywhere between 25% below and 33% above current levels.
However, current policies represent something of a moving target and older modelling exercises may not capture commitments made in the lead-up to or at the COP26 conference, for example.
In addition to the scenarios in the WG3 database, the report cites two recent reviews of current policy scenarios. The first, by Sognnaes et al, finds that current policies would see warming reach a median level of between 2.2C and 2.9C. The second, by Höhne et al, finds a range of 2.2C to 3.2C; however the upper end of this range came from the 2020 UNEP Emissions Gap Report, which was revised downward in its 2021 version to a range of 2.1C to 3C.
These ranges suggest that there are “deep uncertainties involved with modelling temperature outcomes of 2030 policies through to 2100”, making it difficult to precisely determine the likely warming outcomes implied by policies in place today, the report says.
Countries have made nationally determined contribution (NDC) commitments for 2030 under the Paris Agreement that go beyond policies in place today, creating what the report refers to as an “implementation gap”.
Implementing these commitments – in the absence of strong future mitigation later in the century – would likely result in warming of around 2.4C, based on commitments up to and including COP26, or around 2.7C in the Mod-Act illustrative pathway in WG3.
The report says there is also an “emissions gap” of 19-26GtCO2e per year by 2030, between the 2030 NDCs and a scenario consistent with limiting warming to 1.5C with no or limited overshoot.
In effect, if NDCs are not strengthened the world will likely overshoot 1.5C by between 0.15C and 0.3C, the report explains, requiring a heavy reliance on net-negative CO2 emissions via carbon dioxide removal (CDR) later in the century to bring temperatures back down below 1.5C by 2100. It states with high confidence:
“[F]ollowing current NDCs until 2030…[would make] it impossible to limit warming to 1.5C with no or limited overshoot and strongly increas[e] the challenge to likely limit warming to 2C.”
Even limiting warming to 2C becomes difficult in this scenario, as it would imply a rate of emissions reductions after 2030 that is a full 70% higher than scenarios that assume immediate action to reduce emissions, the report says.
The emissions gap between 2030 NDCs and scenarios that likely limit warming to 2C is assessed to be between 10 and 16GtCO2e in 2030. Without strengthening, the NDCs risk “lock-in into carbon-intensive infrastructure and increased risk of stranded fossil fuel assets” that would “exacerbate the socio-economic strain of implementing the transition, leading to an increased risk of overshooting the warming and a higher risk of climate change impacts”.
The past few years have seen a proliferation of longer-term pledges by countries to reach net-zero CO2 or GHG emissions in the latter half of the 21st century. Promises from 77 countries now cover at least 76% of global greenhouse gas emissions.
The report suggests that the literature on these commitments is still developing and it is unclear what their aggregate effect would be – presuming that they are all met. A number of studies were released after the WG3 literature cutoff date (the date at which studies had to be published to be included in the report), suggesting these long-term net-zero commitments could limit global temperatures to below 2C by 2100 – though researchers warned these should be discounted until reflected in near-term pledges.
4. What would it take to limit warming to 1.5 or 2C?
The WG3 report assesses a wide range of scenarios associated with 1.5C (C1 and C2) and 2C (C3 and C4) outcomes. The lowest of these scenarios (C1), where warming is limited to 1.5C with no or limited overshoot, has become notably more difficult to achieve since the IPCC special report on 1.5C was published in 2018, due to four years of flat or modestly increasing global emissions. These scenarios are now associated with higher peak warming in most models, leading to a lower likelihood of limiting warming to 1.5C, the WG3 report says.
The report features five different illustrative mitigation pathways that explore different ways the world might limit warming to 1.5C or below 2C – in addition to the Mod-Act and Cur-Pol pathways discussed above.
Three of the illustrative pathways – “shifting development pathways” (SP), low demand (LD) and high renewables (Ren) – produce climate outcomes that limit warming to 1.5C with “no or limited overshoot” (C1).
A pathway featuring extensive use of net-negative emissions (Neg) results in warming below 1.5C in 2100, but with “high overshoot” during the 21st century (C2), while a pathway characterised by a gradual strengthening of current policies (GS) likely (>66% chance) limits warming to below 2C by 2100 (C3). The Mod-Act pathway – in which countries meet their 2030 commitments, but with little additional climate action – likely results in warming of between 2.5C and 3C by 2100 (C6).
Although the report outlines various ways to limit warming to 1.5C by 2100 (C1-C2), all of these pathways show deep emissions reductions over the next few decades, with both global CO2 and all GHG emissions peaking “between 2020 and at the latest before 2025” and CO2 emissions declining between 25% (Neg) and >50% (LD) by 2030 relative to 2020 levels.
Overall, in scenarios staying below 1.5C with no or limited overshoot, global GHG emissions fall to 43% below 2019 levels by 2030 and 84% by 2050. In these scenarios, global CO2 falls 48% by 2030 and to net-zero “in the early 2050s”, says the report. Methane emissions fall 34% by 2030.
The more intermediate GS pathway, which likely limits warming to 2C but not 1.5C, has global emissions declining by around 14% by 2030 relative to 2020 levels. More broadly, it says keeping warming below 2C means cutting CO2 emissions 50% “in the 2040s” and to net-zero “around the early 2070s”.
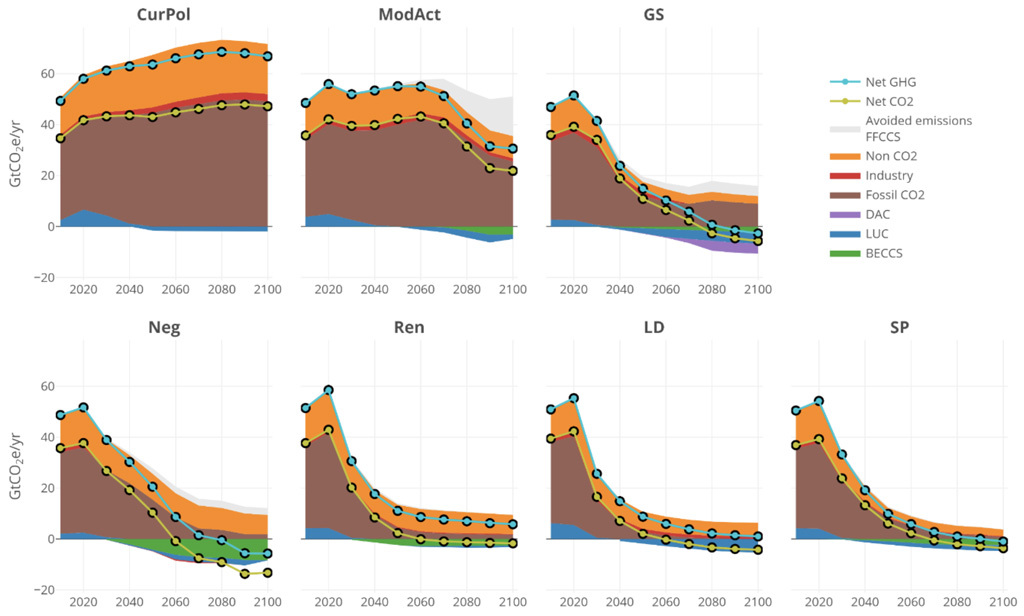
Each of the five mitigation-focused illustrative pathways has a somewhat different approach to cutting emissions, energy use and energy production. GS has a relatively slow phase-out of fossil fuels compared to the others, with high future energy demand primarily met by renewables and a fair amount of CDR deployed late in the century – including lots of direct air capture.
Neg relies heavily on biomass and bioenergy with carbon capture and storage (BECCS) for CDR, and also has a relatively slow phase out of fossil fuels and high future energy demand. Ren has a rapid phaseout of fossil fuels, more moderate future energy demand that is primarily met by renewables, and more limited deployment of CDR.
Finally, LD and SP both have large reductions in future energy demand and rapid fossil fuel phaseouts, with LD including an even faster fossil fuel use exit with limited negative emissions other than land use change (LUC), while SP has more reliance on late-century CDR.
The figure below shows the amount of positive emissions (orange, red, and brown) and CDR (purple, blue, and green) over time in the illustrative pathways.
Each illustrative pathway and climate category has a range of possible climate outcomes, depending on two areas of uncertainty. First, the uncertainty in emissions across all scenarios in a climate category. Second, climate system uncertainties that depend on how sensitive the climate is to CO2 and other GHG emissions and how carbon cycle feedbacks might change as the Earth warms.
In addition to these new WG3 scenarios, the IPCC WG1 provided “assessed warming” estimates for five different future climate scenarios based on Shared Socioeconomic Pathways (SSPs). The SSPs reflect five specific emissions scenarios with differing end-of-century outcomes and are used by complex earth system models to simulate various aspects of the changing climate.
The WG3 scenarios, by contrast, explore a much wider variety of possible emissions futures, but are evaluated using simpler climate model emulators that only provide global average temperature changes.
The figure by Carbon Brief below provides a comparison between the possible amount of warming that may occur in the year 2100 under each of the different IP, climate category and SSP scenarios. The colour of the bar indicates the type of scenario (IP, climate category, or SSP), the dot gives a central warming estimate, the bars (when available) show the range of warming across different emissions scenarios in the category and the whiskers show the range of warming accounting for climate system uncertainties.
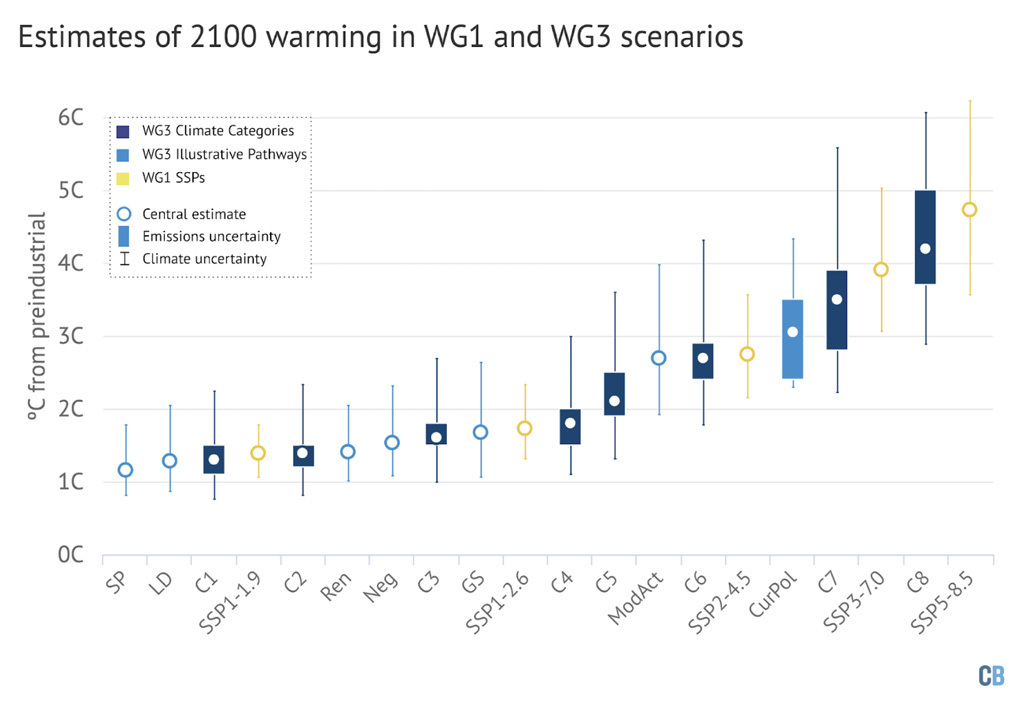
The climate categories and illustrative pathways provide a detailed look at a wide range of scenarios (SP to C4) that are “more likely than not” to limit warming to below 2C by 2100, similar to SSP1-1.9 and SSP1-2.6.
The report notes that while net-zero CO2 emissions are expected to lead to relatively flat temperatures, net-zero GHG emissions result in declining global temperatures.
In practice, pathways reaching net-zero GHGs tend to balance out residual non-CO2 GHG emissions with net-negative CO2 emissions. Net-zero CO2 emissions are generally reached by models around 10 to 40 years before net-zero GHG emissions, for those scenarios reaching net-zero GHGs in the 21st century.
While most scenarios that limit warming to well-below 2C (C1-C3) employ significant amounts of net-negative emissions, not all do. Scenarios with more immediate emissions reductions tend to have no or low overshoot and limit the amount of late-century CDR needed.
However, even in the most ambitious emission reduction scenarios (C1), most pathways still have a limited amount of overshoot, with the median model in that category having a 2 in 3 risk of overshooting 1.5C at some point in the 21st century.
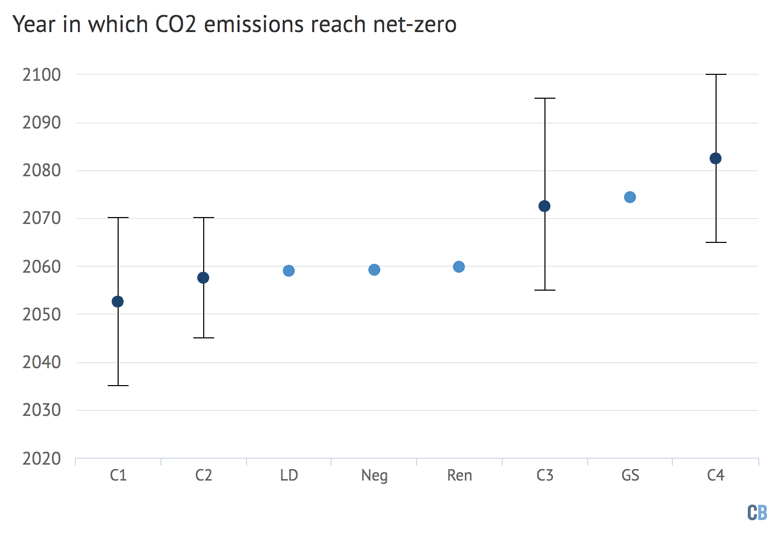
Pathways that limit warming to 1.5C with no or limited overshoot (C1) reach net-zero CO2 emissions “between 2050-2055” on average, with a range of between 2035 and 2070 across all the scenarios assessed.
C2 scenarios, on average, reach net-zero between 2055 and 2060 with a range from 2045 to 2070, while C3 scenarios reach net-zero “between 2070-2075” with a range of 2055 to 2100 or later. The median net-zero year and range across all the scenarios are shown for each climate category and illustrative pathway limiting warming to below 2C in the Carbon Brief chart below.
The fact that some of these models have a later net-zero emissions date does not imply that emissions reductions can be delayed, or that we “have more time to rapidly reduce current emissions levels compared to SR1.5”.
Rather, the scenarios with the latest peak year are often the ones with largest near-term emissions reductions, as they reserve more of the remaining carbon budget for later years.
There are different mitigation strategies that can be employed to limit warming to well-below 2C, as shown by the illustrative pathways. Some have a heavy reliance on renewables (Ren), a strong emphasis on energy demand reductions (LD), wide-spread deployment of CDR (Neg), or focus mitigation in the context of sustainable development (SP).
In some scenarios, a small part of the energy system is still based on fossil fuels in 2100 (Neg), while, in others, fossil fuels are almost or completely phased out (Ren).
However, all mitigation pathways show “greatly reduced” fossil fuel use, with the three that limit warming to 1.5C with no or limited overshoot (Ren, LD, SP) unabated coal use “completely” phased out by 2050. While the GS and Neg scenarios rely heavily on CDR, its use is purposely restricted in the other illustrative pathways focused on deep mitigation (Ren, LD, and SP). These mitigation scenarios tend to feature a widespread electrification of the global energy system, as direct combustion of fuels in buildings and vehicles are increasingly replaced with electric alternatives.
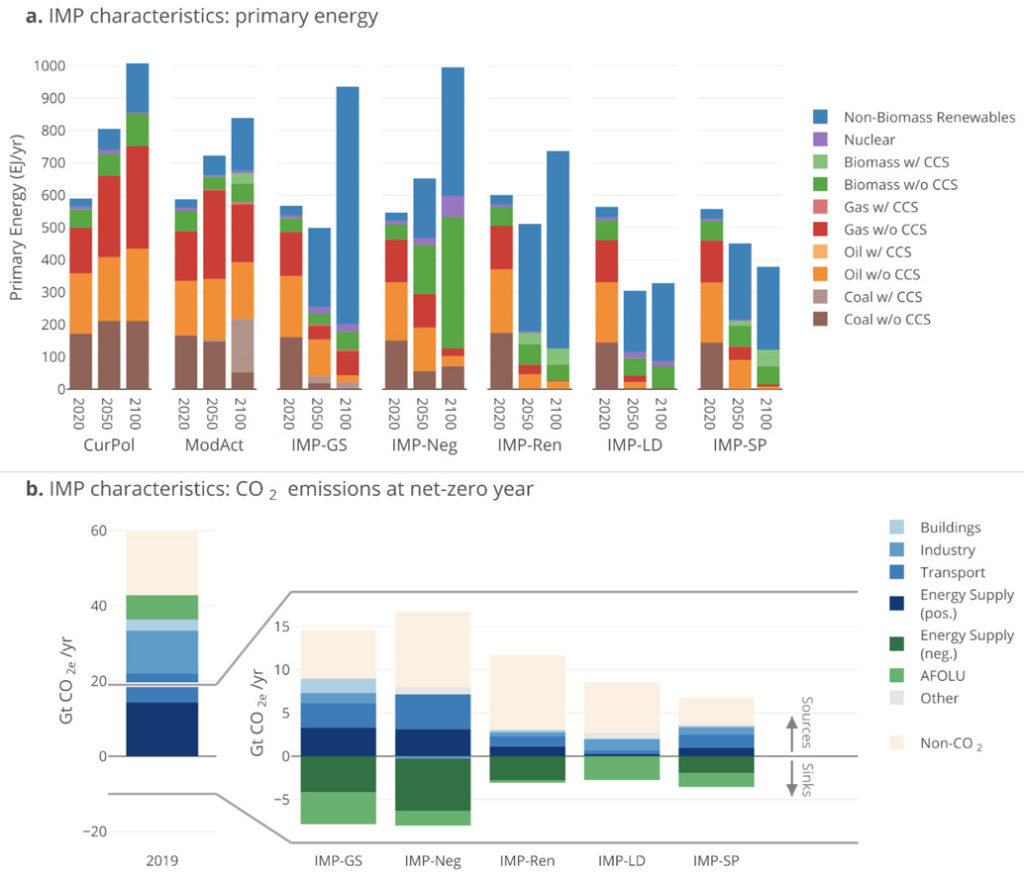
The figure below shows the energy use over time by source in the illustrative pathways (top part), as well as the amount of positive GHG emissions and CDR at the net-zero year, compared to 2019 (bottom part).
One area where there is a lot of new focus in WG3 compared to previous reports such as the 2018 SR15 is low-demand scenarios. These involve a significant decoupling of material and energy demands from economic growth, resulting in very low per capita demand for energy compared to present due to increased energy efficiency and less energy intensive lifestyles.
Illustrative pathways taking this approach – LD and SP – have the lowest peak and 2100 warming of all pathways considered, though it is unclear how possible these pathways would be to achieve in practice as they require energy efficiency improvement rates considerably above those previously experienced.
Similarly, the high level of CDR used in scenarios like Neg has large challenges; as the report notes, “CDR ramp-up rates and absolute deployment levels are tightly limited by techno-economic, social, political, institutional and sustainability constraints”.
5. How can shifting peoples’ demand for products and services cut emissions?
For the first time, this IPCC WG3 report includes a chapter dedicated to the “demand, services and social aspects of mitigation”, which explores the social science literature to assess how people’s behaviour – and the choices they are offered – can cut emissions.
“Demand-side” climate measures are those that reduce the use of high-emitting goods and services by targeting uptake of technologies and people’s consumption patterns. Examples include making it easier for people to use cleaner forms of transport, or eat more plant-based foods.
Behavioural and cultural changes represent a “substantial overlooked strategy” that have been left out of many transition pathways and scenarios, the report says.
While this means there is only medium evidence on the role they could play, it notes that there is high agreement among researchers that such changes “hold up to gigaton-scale CO2 emissions reduction potentials”.
Crucially, the SPM adds with high confidence that such efforts to reduce demand would “significantly reduce” the challenge of mitigation overall, dependence on CO2 removal (CDR, see: What does the report say about CO2 removal and solar geoengineering?), pressure on land (see: How does land add to climate change and how can it help soak up CO2?) and carbon prices needed to meet climate goals.
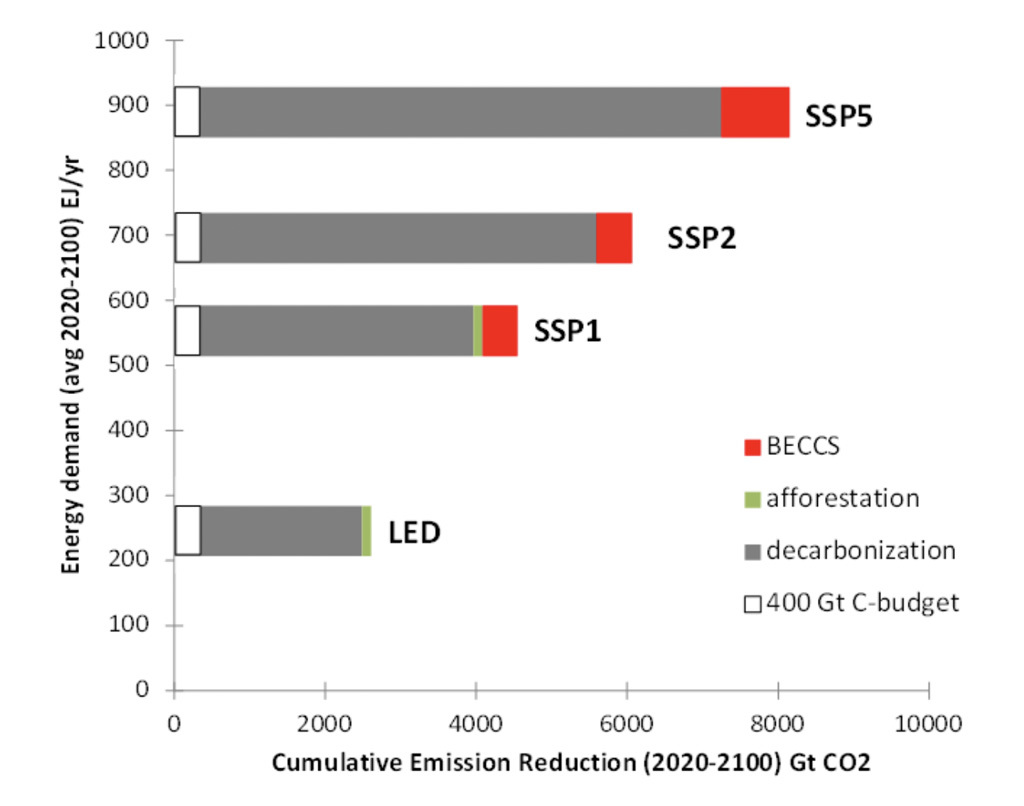
The report states that low-demand pathways “eliminate the need for technologies with high uncertainty, such as BECCS [bioenergy with carbon capture and storage]”. This can be seen in the chart below, which shows that such a scenario also requires less decarbonisation efforts than a selection of “Shared Socioeconomic Pathways” (SSPs), in order to limit warming of 1.5C.
While previous IPCC reports made little use of low energy demand scenarios, this one references 12 relevant global scenarios and another 10 that look at specific regions.
Overall, the report concludes with high confidence that, by 2050, demand-side strategies could cut global greenhouse gas emissions by 40-70% “compared to baseline scenarios”. It also notes with high confidence that Covid-19 lockdowns “demonstrated that behavioural change at a massive scale and in a short time is possible”.
The chart below shows how this could break down between sectors, with the coloured bars indicating emissions that could be avoided in 2050 by shifts in behaviours (light blue), infrastructure use (red) and clean technology adoption (orange). The dark grey bars are the remaining emissions that will not be affected by these changes.
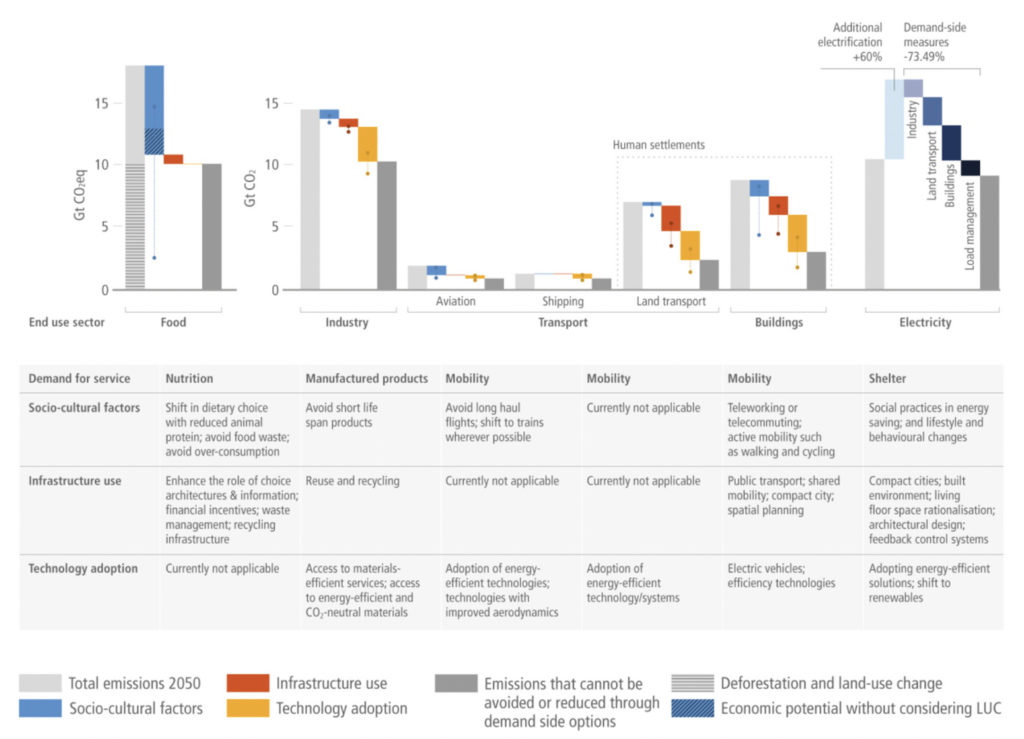
The greatest potential – 8bn tonnes of CO2 equivalent (GtCO2e) avoided in 2050 – comes from changes in food demand (see: What impact can the food system and dietary choices have on emissions?). Land transport provides the second-biggest opportunity for emissions savings, at 6.5GtCO2e.
The report uses the avoid-shift-improve (ASI) framework to explore options for demand-side measures, through a combination of socio-cultural, infrastructural and technological changes.
In the transport sector, for example, emissions could be avoided by eliminating unnecessary travel to work and working from home instead; remaining journeys could be shifted from a car to a bus; and the bus itself could be improved by replacing it with an electric model.
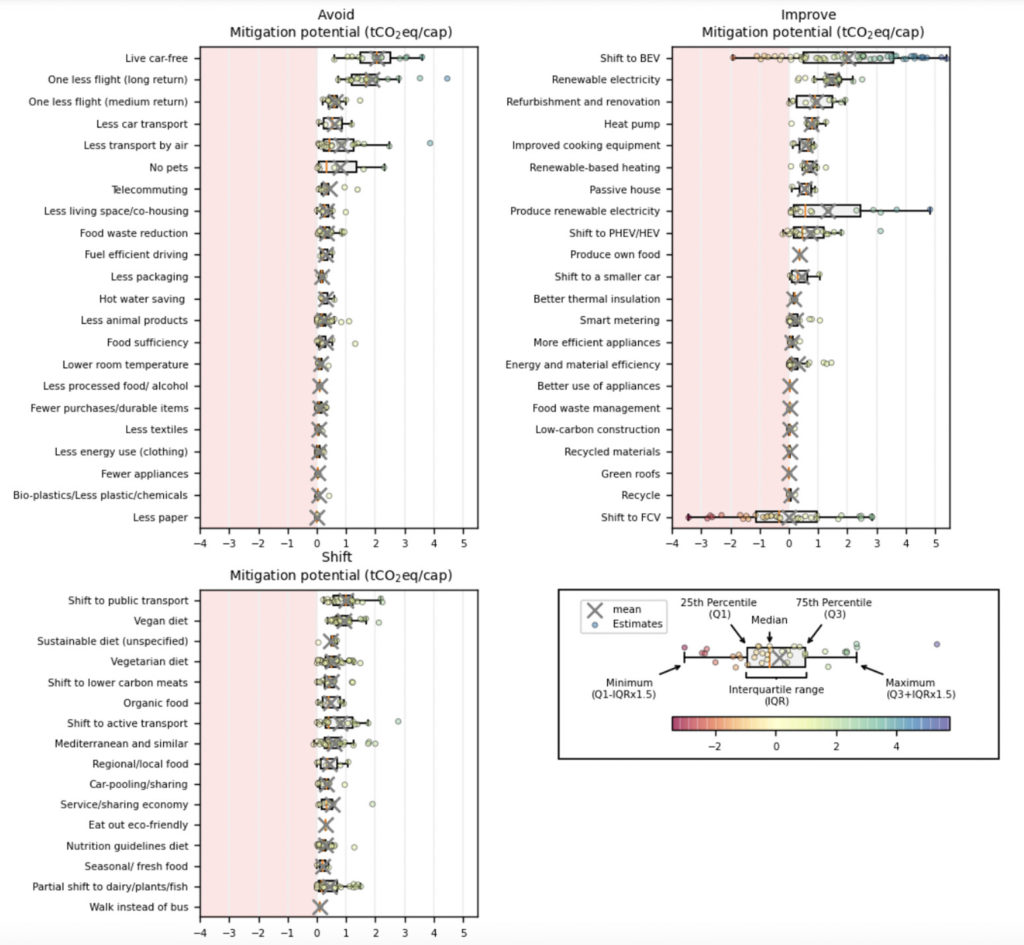
The report highlights a major review of options to reduce emissions from individual activities, which identified 6,990 journal papers and distilled 61 consumption options from them.
A breakdown of these activities and their emissions savings can be seen in the chart below. If the results extend into the pink area, this indicates that there is potential for the activity – for example switching to a hydrogen fuel-cell vehicle (FCV) – to backfire and result in more emissions.
Overall, the report notes that choosing low-carbon options could reduce an individual’s carbon footprint by up to 9tCO2. Effective “avoid” options include not using a car and cutting back on flights, effective “shifting” includes switching to plant-based diets and using public transport, and effective “improving” includes purchasing an electric car or a heat pump.
As demand-side solutions require both motivation and capacity for change – and motivation by people worldwide to change their energy consumption is “generally low” – the report states that:
“Individual behavioural change is insufficient for climate change mitigation unless embedded in structural and cultural change.”
The report says there is high evidence and high agreement that “choice architecture” – referring to interventions or “nudges” based on how choices are presented to people – can shape their energy-related decisions.
Behavioural nudges can be used to encourage the uptake of everything from food waste reduction to using geothermal for district heating, the report concludes. It highlights effective measures including “green defaults”, such as automatic enrolment in clean energy provision, and clear labelling of products with climate-relevant information.
In its section on demand-side measures, the report also considers proposed “transformative megatrends”, namely the “sharing economy”, the “circular economy” and “digitalisation”. Examples of these ideas, including those that already exist and those that are emerging, are shown in the figure below.
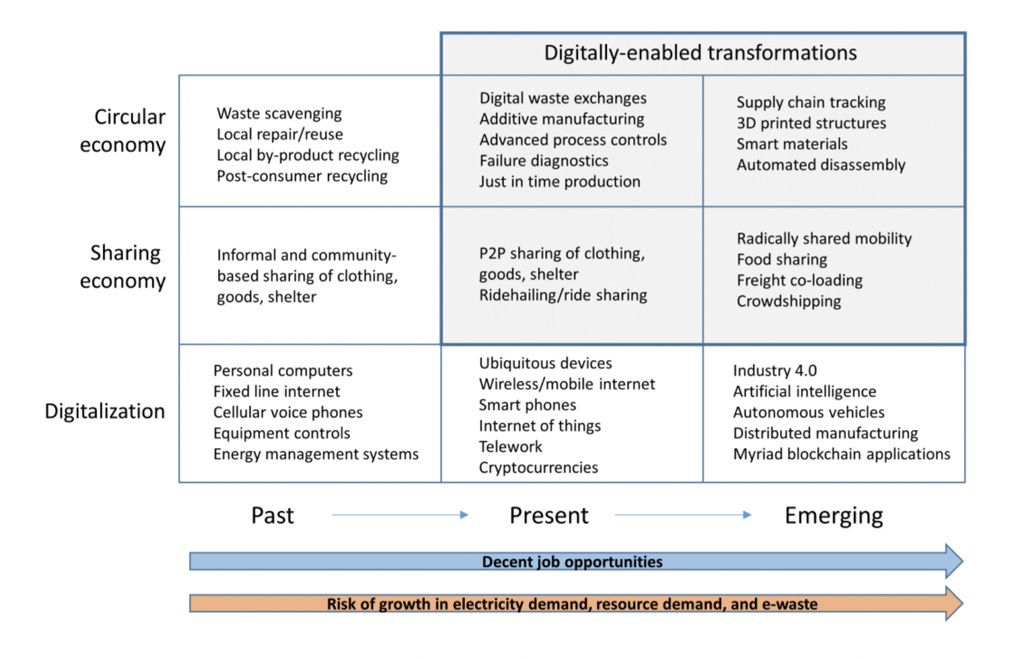
While all of these ideas have received “much attention from the research, advocacy, business models and policy communities”, the report concludes that to date they have “made a limited contribution to climate change mitigation”. There is only medium evidence for such systems having a marked impact on emissions.
Crucially, the SPM notes with high confidence that demand-side measures are “consistent with improving basic wellbeing for all”.
A key concern about policies focused on cutting emissions is that they may reduce people’s quality of life, but the report finds, with medium confidence, that “decent living standards” – a benchmark of minimum material conditions for human wellbeing – for everyone are “achievable through the implementation of high-efficiency low demand mitigation pathways”.
The report cites a low energy demand scenario that delivers universal decent living standards while cutting final energy demand by 40% between 2018 and 2050.
It adds that addressing inequality supports climate change mitigation efforts and notes with high confidence that demand-side measures come with “multiple interacting benefits” – for example, improvements to nutrition and health.
Moreover, it says that high status – and, therefore, often high carbon – consumption patterns “may be reduced by taxing absolute wealth without compromising wellbeing”.
While the report acknowledges that “only a few” countries with low economic growth rates have cut both territorial and consumption emissions, they have done so “typically by switching from fossil fuels to renewable energy”. It adds:
“High deployment of low/zero carbon fuels and associated rapid reduction in demand and use of coal, gas and oil can further reduce the interdependence between economic growth and greenhouse gas emissions.”
6. What impact can the food system and dietary choices have on emissions?
“Food systems” are associated with roughly 42% of global greenhouse gas emissions, states the report, even as “there is still widespread food insecurity and malnutrition”. Between 1990 and 2018, greenhouse gas emissions from food systems grew from 14 to 17GtCO2e per year.
Looking at households’ carbon footprints, the food sector “dominates in all income groups”, even more than energy use. Globally, it counts for 28% of these footprints on average, with rice and cattle being the “major contributors”.
Food also accounts for 48% and 70% of household impacts on land and water resources, respectively, and these impacts rise with incomes driven by higher consumption of meat, dairy and processed food, says the report.
There is high agreement that mitigating food-sector emissions to their full potential “requires change at all stages, from producer to consumer and waste management” via integrated packages of policy including supply- and demand-side measures.
Sustainable food systems that provide healthy diets for all are within reach, state the report’s authors after assessing literature on health, diets and emissions. However, they require “significant cross-sectoral action”, from better agricultural practices, consumers changing their diets, and food producers, distributors, retailers and consumers reducing food waste.
Shifting consumption towards plant-based diets has “high mitigation potential”, says the report. There is robust evidence that “diets high in plant protein and low in meat and dairy” make for lower GHG emissions.
The report estimates with high confidence that shifts to sustainable healthy diets have a “technical potential” to reduce emissions by 3.6GtCO2e, with a range of 0.5 to 8GtCO2e. This is the amount of emissions that could be saved if financial and other constraints are ignored.
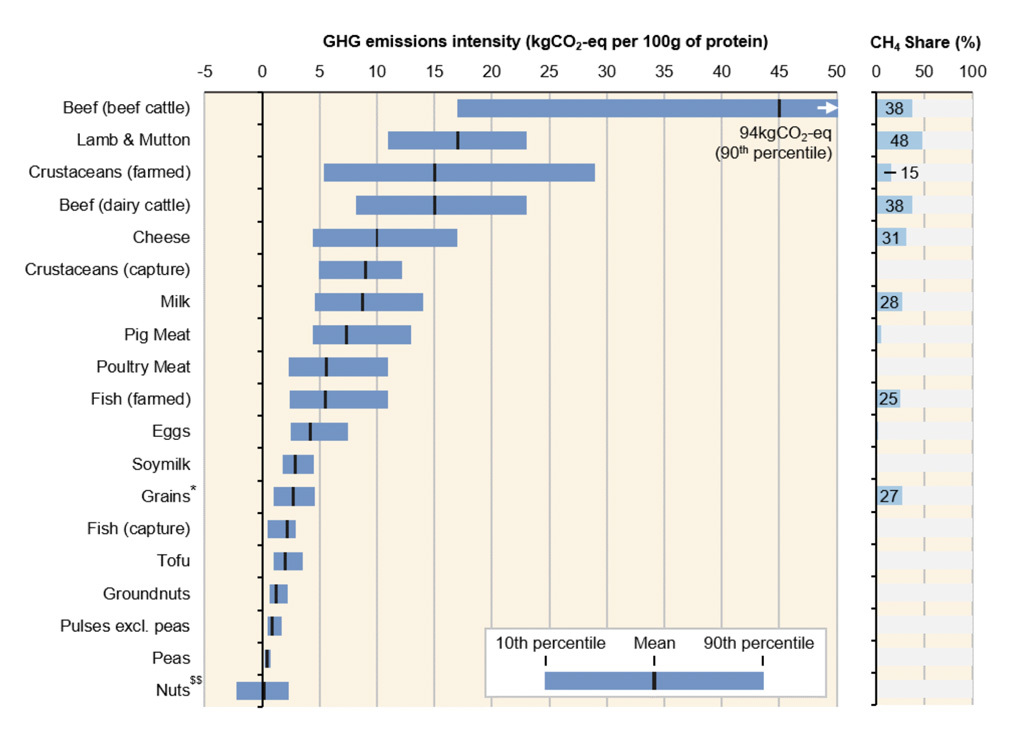
Meats from ruminants such as sheep and cows have the highest GHG intensity. However, the report observes that beef from dairy systems is less emissions-intensive than beef reared in herds purely for meat, with emissions of 8-23kgCO2e per 100g protein and 17-94kgCO2e per100g protein, respectively.
It acknowledges the widely varying estimates, attributing this to the difference in production systems: intensive livestock rearing where cattle are largely fed grain versus pastoral practices, where herders move livestock from summer to winter pastures, or rear them on rangelands.
This is illustrated in the figure below, which shows the emissions intensity of different protein-rich foods, in kgCO2e per 100g protein from the highest (beef from beef cattle) to the lowest (nuts).
In addition to “substantial[ly]” lowering emissions from the food system, diets with a higher share of plant-based protein and reduced intake of “added sugars, salt and saturated fats” would cut land use and nutrient losses to the environment, as well as offering health benefits, the report says.
Beyond dietary changes, the report says there is limited evidence – but high agreement – that a suite of “emerging technologies” could bring “substantial reduction in direct GHG emissions from food production”. These include plant-based alternatives to animal products, cultured meat and “controlled environment agriculture”, which it describes as ”hydroponic or aquaponic cultivation systems that do not require soil”.
These technologies typically have lower water, land and nutrient footprints, but as some of them are energy-intensive, they need to have access to low-carbon energy.
Food waste is another aspect the report draws attention to. According to studies assessed by the report’s authors, roughly 20-40% of food produced worldwide is wasted before it reaches the market, or goes to waste in households. It estimates that global food loss and waste accounted for 8-10% of total GHG emissions between 2010 to 2016.
Reducing food loss and waste globally has the technical potential to cut emissions globally by 2.1GtCO2e, with a range of 0.1-5.8GtCO2e, the report estimates with medium confidence.
Global food supply chains have a strong influence on per-capita food consumption emissions, particularly for red meat and dairy, the report notes, such that the highest per-capita food-related emissions “do not correlate perfectly with the income status of countries”. In other words, even relatively poorer countries may have a high per-capita food footprint.
As a result, the report says “it is crucial to focus on high-emitting individuals and groups within countries, rather than only those who live in high-emitting countries, since the top 10% of emitters live on all continents and one third of them are from the developing world”.
Changes in the food sector would have broad implications. Reducing food waste, coupled with dietary shifts, can “further reduce energy, land and resource demand” and result in “substantial” benefits in places where food is grown, putting food security there under less strain.
Both measures “have highly relevant repercussions” for land-use emissions, the report says, because they can free up land for other uses, such as afforestation or bioenergy. Moreover, shifts in diets and lowered pressure on land are also “reflected in reductions of land degradation” and reduced deforestation, says the report.
Key enablers for these shifts could include creating “novel narratives” in the media and entertainment industry to “help to break away from the established values, discourses and the status quo”. These might portray plant-based diets as healthy and natural, for example.
The report explores other measures that could be used to influence choices in the food sector, including taxes or carbon pricing on food, both of which it says would be “regressive”, meaning they disproportionately burden poorer members of society. Instead, it points to options including marketing regulations, procurement policies, dietary guidelines, labelling and “nudges”.
7. How must global energy systems change to limit warming?
The energy supply sector is the largest source of greenhouse gas emissions, accounting for some 20GtCO2e or 34% of the total in 2019, the report says. It states with high confidence:
“Warming cannot be limited to 2C or 1.5C without rapid and deep reductions in energy system CO2 and GHG emissions.”
This means it is “essential” to cut energy supply sector emissions in order to limit warming and, consequently, the energy systems of the future will be “very different”. It adds: “Achieving and responding to these changes presents an impressive range of challenges and opportunities.”
Some 4GtCO2e of the sector’s emissions are due to fugitive emissions from fossil fuel production, which are potentially “underestimated” and remain subject to a “high degree of uncertainty”.
However, the largest share – some 14GtCO2e – relates to the generation of electricity and heat. These emissions must be all but eliminated even as demand increases, it says, because all scenarios staying below 2C involve “increased electrification of buildings, transport and industry”.
(In scenarios limiting warming to 2C, electricity’s share of final energy increases from today’s level of 20% to at least 42% in 2050 and 60% in 2100, with even higher levels for 1.5C.)
While the challenge is large, the report says that a shift to low-carbon energy could save money, thanks to rapid cost reductions in key technologies over the past decade. (See: How much innovation and new technology is needed to hit climate goals?) It states:
“Unit cost reductions in key technologies, notably wind power, solar power, and storage, have increased the economic attractiveness of low-emission energy sector transitions through 2030. Maintaining emission-intensive systems may, in some regions and sectors, be more expensive than transitioning to low-carbon systems. Low-emission energy sector transitions will have multiple co-benefits, including improvements in air quality and health.”
These cost reductions mean that in “many parts of the world”, solar power is cheaper than electricity from fossil fuels and in “some” places below the cost of continuing to operate existing coal or gas power plants, the report says with high confidence. Similarly, it says that electricity from onshore wind is cheaper than from fossil fuels “in a growing number of markets”.
Moreover, the report says with medium confidence that evidence has emerged since the previous fifth IPCC assessment report (AR5) suggesting that “future energy transitions may occur more quickly than those in the past”.
One stumbling block highlighted by the report is the weight of emissions likely to be created by existing and currently planned fossil fuel infrastructure. It warns:
“Estimates of future CO2 emissions from existing fossil fuel infrastructures already exceed remaining cumulative net CO2 emissions in pathways limiting warming to 1.5°C (>50%) with no or limited overshoot (high confidence).”
Given the “long lifetimes” of these assets, they “may influence the rate of transformation substantially and lock societies into carbon-intensive lifestyles and practices for many decades”. It adds:
“Decommissioning and reduced utilisation of existing fossil fuel installations in the power sector as well as cancellation of new installations are required to align future CO2 emissions from the power sector with projections in these pathways.”
If warming is kept below 2C, fossil fuel resources and fossil fuel-related infrastructure “could” be “strand[ed]”, the report says, though it adds that the use of CCS, where available, “could allow fossil fuels to be used longer” and reduce the risk of stranding.
It says, with medium confidence, that the combined discounted value of these assets is projected to be around $1-4tn between 2015-2050 and “will be higher” if warming is kept below 1.5C. Coal assets would be most at risk this decade but oil and gas would be too, “toward mid-century”.
The report says that limiting warming to 2C or below “requires a rapid shift” away from coal use without carbon capture and storage (CCS), and will “require cancellation of new coal power projects and accelerated retirement of existing coal plants”. Opportunities for more rapid action this decade also include “limiting the construction of new gas-fired power plants”, it adds.
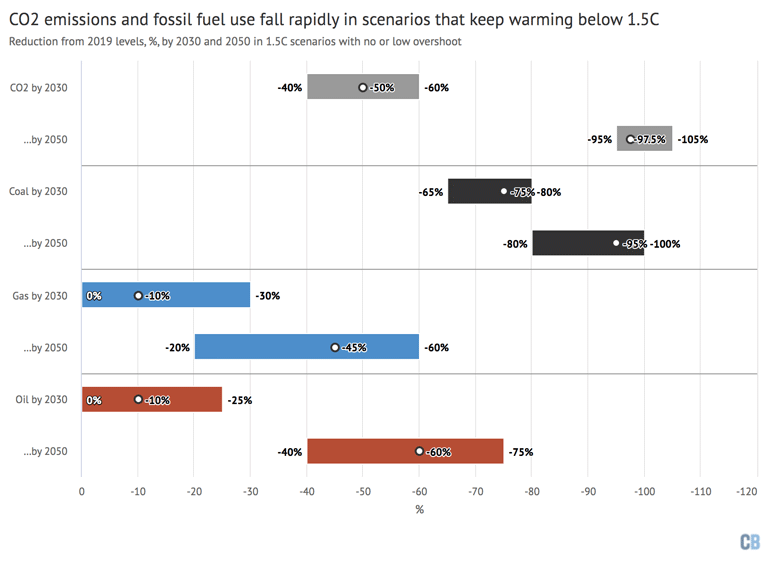
The Carbon Brief figure below shows how global CO2 emissions and primary energy supply from fossil fuels falls rapidly in scenarios that keep warming below 1.5C with no or limited overshoot.
Indeed, the report says that using “far less fossil fuel than today” is “fundamental” to limiting warming. Specifically, coal use falls to 75% below 2019 levels by 2030 and 95% by 2050 (black bars), while gas falls 10% by 2030 and 45% by 2050 (blue), and oil by 10% and 60% (red).
Although there are many different pathways to keeping warming below 2C, the report points to a number of key characteristics that are shared across all such scenarios. These include:
- Electricity systems that produce no CO2 or remove it from the atmosphere;
- Widespread electrification including for “light-duty” transport, heating and cooking;
- “Substantially” lower fossil fuel use than today;
- Use of alternative “energy carriers”, such as hydrogen, bioenergy and ammonia, in sectors where electrification is not possible;
- More efficient use of energy than today;
- Greater integration between different parts of the energy system, such as heating, transport and electricity, as well as between regions;
- Use of carbon dioxide removal (CDR) to offset residual emissions.
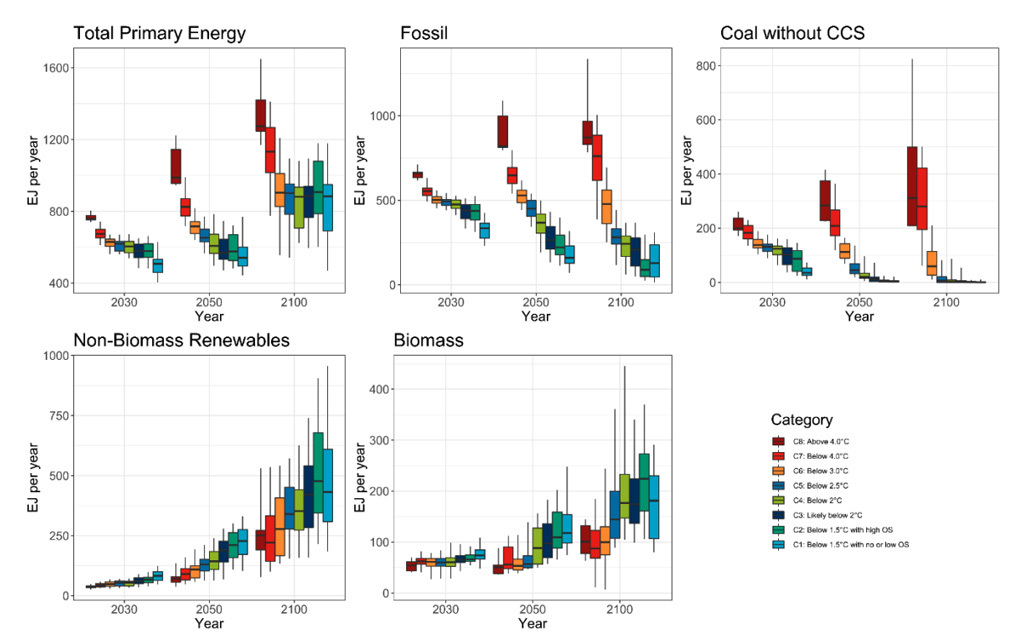
These are illustrated in the figure below, which shows how the energy system changes under a range of scenarios from high warming (red bars) to those staying below 1.5C (blue). The figure shows global primary energy supply (top left) and contributions from fossil fuels (top middle), coal without CCS (top right), non-biomass renewables (bottom left) and biomass (bottom middle).
The report says that pathways successfully limiting warming “show reductions in energy demand” compared with current policies, through a “diverse set of demand-side interventions”. (See: How can shifting peoples’ demand for products and services cut emissions?)
At the same time, low-carbon energy sources increase rapidly in below-2C pathways, meeting 88% of primary energy supply (with a range of 69-97%) in 2100.
Renewable energy, including wind, solar and bioenergy, supplies 30-70% of energy in below-2C pathways and “clearly above 40%” for 1.5C, the report says.
It notes that while scenarios have been published with 100% renewable energy at a global scale, there is “debate in the literature on whether [this] is possible to achieve”. It adds:
“It is unlikely that all low-carbon energy systems around the world will rely entirely on renewable energy sources.”
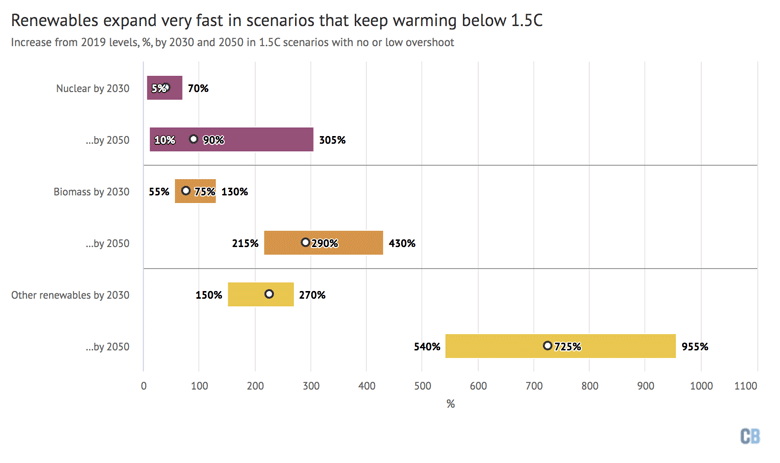
Regardless of these debates, non-biomass renewable energy – primarily wind and solar – expands very fast in scenarios keeping warming below 1.5C with no or limited overshoot, as shown in the figure below (yellow bars). In contrast, 1.5C scenarios show greater variation in the adoption of nuclear and biomass energy, the report shows (purple and orange bars).
The contribution of biomass has “absolute limits”, the report says. (See: How does land add to climate change and how can it help soak up CO2?)
It says with high confidence that nuclear “can deliver low-carbon energy at scale”, but that doing so “will require improvements in managing construction of reactor designs that hold the promise of lower costs and broader use”. It adds:
“[N]uclear power continues to be affected by cost overruns, high upfront investment needs, challenges with final disposal of radioactive waste, and varying public acceptance and political support levels (high confidence).”
In contrast to the rapid recent cost reductions and adoption of “modular” technologies, such as wind, solar and batteries, which have happened “much faster than anticipated by experts and modelled in previous mitigation scenarios”, the report says that nuclear energy and CCS has been “slower than…anticipated”.
Moreover, it says with medium confidence that evidence since AR5 indicates “small-scale technologies (e.g. solar, batteries) tend to improve faster and be adopted more quickly than large-scale technologies (nuclear, CCS)”.
Another important technology is CCS, with a “considerable amount” being used in the “majority” of below-2C scenarios, the report says. Notably, however, some of the 1.5C pathways highlighted by the report include little or no CCS. (See: What would it take to limit warming to 1.5 or 2C?)
Box TS.9 in the Technical Summary compares hydrogen to electrification in areas such as transport, heating and industry. It says:
“As a general rule, and across all sectors, it is more efficient to use electricity directly and avoid the progressively larger conversion losses from producing hydrogen.”
Nevertheless, as Box 12.5 explains, there has been growing interest in the use of the fuel, with the word “hydrogen” appearing five times more often in AR6 than AR5. It points to the use of hydrogen in sectors that are hard to decarbonise, such as parts of transport and industry, as well as for storage in low-carbon electricity systems.
The report also addresses a range of challenges for low-carbon energy systems to overcome. For example, it says that integrating large amounts of “variable renewable energy” (VRE), particularly wind and solar, presents “economic and technical challenges to electricity system management”.
These challenges “can be addressed” by using batteries, hydrogen and other storage, as well as greater “demand-side responses”, it says, meaning that “[e]lectricity systems powered predominantly by renewables will be increasingly viable over the coming decades”.
Furthermore, the addition of “flexible/dispatchable” generation technologies, such as gas, hydrogen or nuclear plants, can “enabl[e] more secure and cost-effective integration of VRE generation and end-use electrification”, the report adds.
While expansion of solar, wind and EVs will increase demand for critical minerals, the report says “there are alternatives” and that recycling can boost supplies. The report also gives short shrift to the idea that wind power is not low carbon, saying that “all wind power technologies repay their carbon footprint in less than a year”.
Finally, the report says that while climate change will alter hydropower output, bioenergy yields, the efficiency of fossil and nuclear power plants, and demand for heat and cooling, it “will not affect wind and solar resources to the extent that it would compromise their ability to reduce emissions”.
8. How does land add to climate change and how can it help soak up CO2?
Around 22% of global greenhouse gas emissions came from agriculture, forestry and other land use (AFOLU) in 2019, the report says.
The proportional contribution of AFOLU to total emissions varies regionally, the report says. It is highest in Latin America and the Caribbean, where 58% of total emissions come from AFOLU and lowest in Europe and North America, where 7% of emissions come from AFOLU.
CO2 emissions from AFOLU are largely driven by land-use change, with deforestation accounting for “about half” of total emissions, the report adds.
It says with medium confidence that levels of deforestation generally declined between 2010 and 2019. However, over this time, there were overall losses in tropical forests – which are key for carbon storage and biodiversity – and gains in temperate and boreal regions.
The loss of mangrove forests – coastal swamps found in the tropics that hold vast stores of carbon – has been particularly severe over the past few decades, the report says.

From 1990 to 2020, one million hectares of mangrove forests were lost across the world, largely due to conversion for agriculture and aquaculture, according to the report. (There are around 15m hectares of mangrove forests globally.)
In 2020, the total global forested area stood at 4bn hectares, representing 31% of the total Earth surface, it adds. Countries with the most forest within their borders include Russia, Brazil, Canada, the US and China.
The chart below explores the drivers of higher deforestation and lower deforestation, based on a global scientific review published in 2017.
The analysis explored whether drivers were consistently associated with higher deforestation (yellow), lower deforestation (blue) or neither (grey). Results are given in ratios. (For example, a ratio of -4 indicates that a driver is associated with lower deforestation four times as often as it is associated with higher deforestation.)
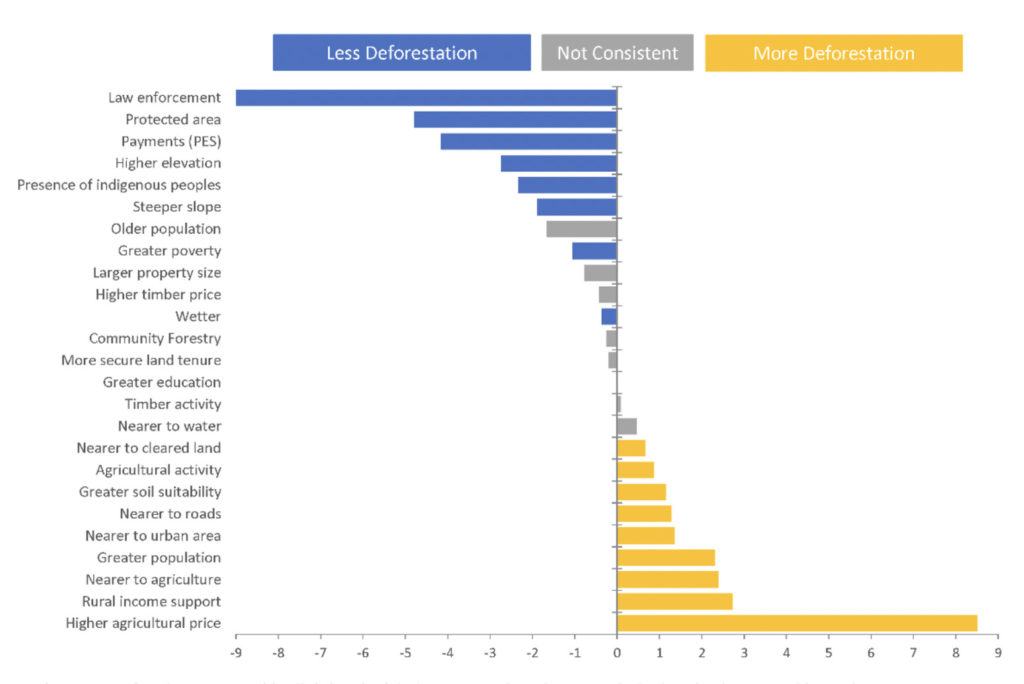
The chart shows that factors such as law enforcement, protected areas, payment for ecosystem services and the presence of Indigenous people were consistently associated with lower levels of deforestation.
By contrast, higher agricultural prices and close proximity to agriculture, urban areas and roads were consistently associated with higher levels of deforestation.
In addition to CO2, the report also examines how the AFOLU sector is driving emissions of the second- and third-most polluting greenhouse gases, namey, methane and nitrous oxide.
Methane emissions from AFOLU increased between 2010 and 2019, with the “main source” being belching and manure production from livestock, the report says with high confidence.
Nitrous oxide emissions are also on the rise, “dominated by agriculture, notably from manure application, nitrogen deposition and nitrogen fertiliser use”, the report says with high confidence.
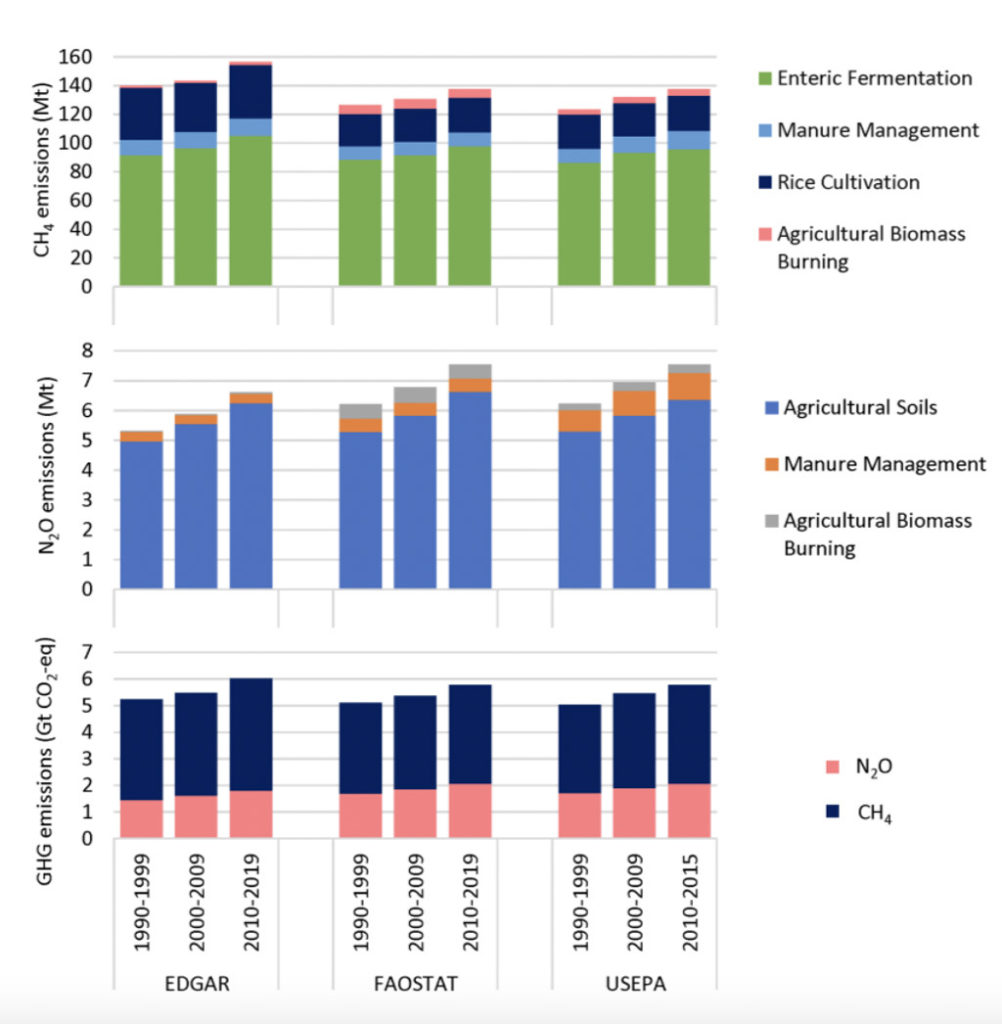
The chart below shows estimated global mean agricultural methane (top) and nitrous oxide (middle) emissions for the period 1990 to 2015, based on three different data sources (EDGAR, FAOSTAT and USEPA). The bottom chart shows an aggregation of global mean agricultural methane and nitrous oxide emissions.
On the top chart, green represents methane emissions from “enteric fermentation” (the digestive process of cows and sheep), light blue represents manure management, dark blue represents rice cultivation and orange represents agricultural biomass burning.
On the middle chart, blue represents nitrous oxide emissions from agricultural soils, orange from manure management and grey from agricultural biomass burning.
(Read Carbon Brief’s in-depth breakdown of the emissions of different types of food.)
Despite dramatic land-use change, the world’s intact terrestrial ecosystems acted as a carbon sink between 2010 and 2019, absorbing around a third of all human-caused CO2 emissions, the report says with medium confidence.
The report says that the AFOLU sector offers “significant opportunities” for tackling climate change while providing food, wood and other resources – if it can adapt to the impacts of warming.
It states with high confidence that rapid deployment of land-based measures for reducing emissions is “essential in all pathways” for keeping global warming to 1.5C.
There is “robust evidence” that the AFOLU sector could provide 20-30% of the global greenhouse gas reductions needed for a 1.5C or 2C pathway by 2050, the report says. However, it notes that strategies for how AFOLU can help achieve climate targets are “highly variable” (see: What would it take to limit warming to 1.5 or 2C?)
AFOLU’s contribution to climate targets could come at a “relatively low cost”, the report adds.
It says the AFOLU sector could “economically” remove 8-16GtCO2e every year between 2020 and 2050. This “economic potential” is roughly half the “technical potential” from AFOLU – an estimate of what would technically be possible when constraints such as financing are not considered, the report says.
From now to 2050, protecting and restoring forests and other ecosystems could have the highest potential for economic greenhouse gas removal related to AFOLU, the report says.
Global studies suggest that the protection and restoration of forests, peatlands, coastal wetlands, savannahs and grasslands have the potential to cut emissions by a mean of 7.3GtCO2e per year from 2020 to 2050, the report says.
Agricultural means of reducing emissions, such as soil carbon management and improved livestock rearing, offer the second-largest potential for economic CO2 removal from AFOLU, it says. Such methods could cut emissions by 4.1GtCO2e per year, according to the report.
“Demand-side” measures, such as shifting to plant-based diets and reducing food waste, offer the third largest potential: 2.2GtCO2e a year.
The above measures for slashing AFOLU’s climate impact are “available and ready to deploy”, the report adds, in contrast to other types of CO2 removal, such as carbon capture and storage (CCS), the report adds. (See: What does the report say about carbon dioxide removal?)
“Bioenergy” methods – which involve the burning of crops and wood residues to produce energy – also represent an “important share” of the total greenhouse gas removal potential from AFOLU, the report says.
Bioenergy with carbon capture and storage (BECCS) – a still-emerging technique that involves growing crops, burning them in a power station to generate energy and then capturing the resulting CO2 – could remove an estimated average of 5.9GtCO2e each year from 2020 to 2050, the report says with medium confidence.
However, out of this figure, just 1.6GtCO2e could be removed in a way that is economic, the report adds. With high confidence, the report adds:
“The use of bioenergy can lead to either increased or reduced emissions, depending on the scale of deployment, conversion technology, fuel displaced, and how, and where, the biomass is produced.”
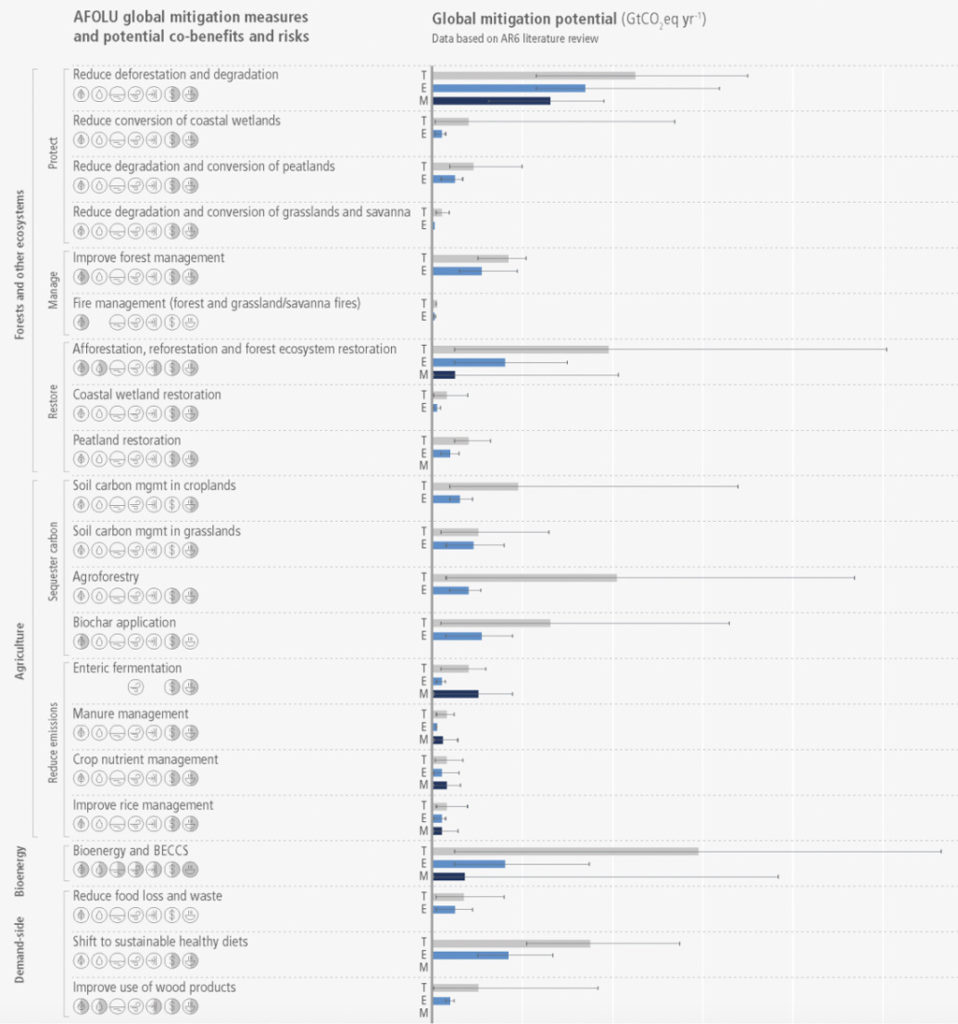
The graphic below shows the global mitigation potential (in billion tonnes of CO2e per year) of 20 land-based climate measures between 2020 and 2050. On the chart, grey bars represent technical potential, light blue bars represent economic potential and dark blue bars represent economic potential according to integrated assessment models (IAMs).
On the graphic, icons represent co-benefits (white) and risk (shaded) for biodiversity, water, soil, air quality, resilience, livelihoods and food security. (Half-shaded icons indicate there is the potential for risks and co-benefits.)
The report says that, when “carefully” implemented, land-based measures for reducing greenhouse gas emissions are “uniquely positioned to deliver substantial co-benefits and help address many of the wider challenges associated with land management”.
However, when deployed “badly”, land-based climate measures can “exacerbate trade-offs with the conservation of habitats, adaptation, biodiversity and other services”. The report adds:
“Depending on local conditions and management strategies, mitigation measures have the potential to positively or negatively impact biodiversity, ecosystem functioning, air quality, water availability and quality, soil productivity, rights infringements, food security, and human wellbeing.”
It states with high confidence that “poorly planned” deployment of biomass production and large-scale tree-planting may “conflict with environmental and social dimensions of sustainability” – echoing the findings of the second working group report of AR6. (On the graphic above, bioenergy and BECCS are found to pose a risk to biodiversity, water, soil, air quality, resilience, livelihoods and food security.)
The report says that, when food security and environmental concerns are considered, bioenergy has the potential to produce 5-50EJ per year and 50-250EJ per year by 2050 for residues and dedicated biomass production systems, respectively. (250EJ per year is equivalent to around 40-45% of current global primary energy demand.)
The report notes that most land-based measures for reducing emissions, such as tree-planting and restoring ecosystems, “have been well understood for decades but deployment remains slow”.
It says that the “economic and political feasibility” of land-based climate measures are “hampered by persistent barriers”.
A lack of available finance “forms a critical barrier” to the rollout of land-based climate measures, the report says.
“Differences in cultural values, governance, accountability and institutional capacity are also important barriers,” it adds.
“Concerted, rapid and sustained effort by all stakeholders, from policymakers and investors to land owners and managers” will be needed if land-based climate measures are to be deployed at the level necessary, the report says with high confidence.
The world currently spends $700m on land-based climate measures each year – well short of the $400bn needed if the AFOLU sector is to deliver up to 30% of the CO2 cuts needed to meet climate targets, the report says with medium confidence. “This estimate of the global funding requirement is smaller than current subsidies provided for agriculture and forestry,” the report adds.
It adds that the deployment of land-based climate measures “depends strongly” on policies that directly address emissions. Examples of “successful policies” include community forestry, biodiversity conservation and payments for ecosystem services.
9. What does the report say about CO2 removal and solar geoengineering?
Methods for removing CO2 from the atmosphere are “unavoidable” if the world is to reach net-zero – both globally and nationally, the report says.
It states with high confidence that net-zero can only be achieved if CO2 removal is used to balance “difficult-to-abate” emissions from sectors that will find it harder to slash their climate impact, such as aviation, agriculture and some industrial processes.
In the longer term, upscaling CO2 removal could provide “net-negative CO2 emissions at the global level”, allowing a “reversal of global warming”, the report says with medium confidence.
However, the role of CO2 removal is often “inflate[d]” in model pathways designed to show how the world could limit warming. This is because of “insufficient representation of variable renewables” such as wind and solar, limited use of demand-side options (see: How can shifting peoples’ demand for products and services cut emissions?) and high discount rates.
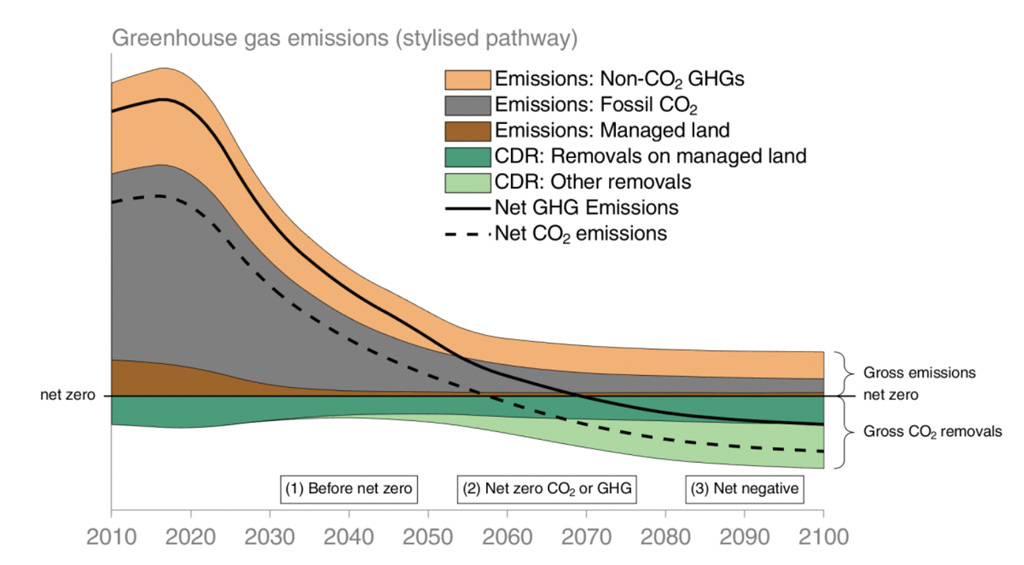
The chart below shows the role of CO2 removal (“CDR”) in a stylised pathway of ambitious climate action. Dark green illustrates CO2 removal from land-based methods and light illustrates removal from ocean and technological methods.
According to the report, it illustrates how CO2 removal could help to reduce greenhouse gas emissions levels in the near-term (1), counterbalance residual emissions to help reach net-zero in the mid-term (2) and help achieve net-negative emissions in the long term (3).
Methods for CO2 removal range from the biological, such as tree-planting and BECCS (see: How does land contribute to climate change and how can it help to soak up CO2?), to the chemical, such as using machines to suck CO2 from air (direct air capture and storage), the report notes. Each method’s ability to store CO2 ranges from “decades to more than 10,000 years”, it adds.
The graphic below sums up various land- and ocean-based methods for removing CO2 from air, including possible implementation and storage options.
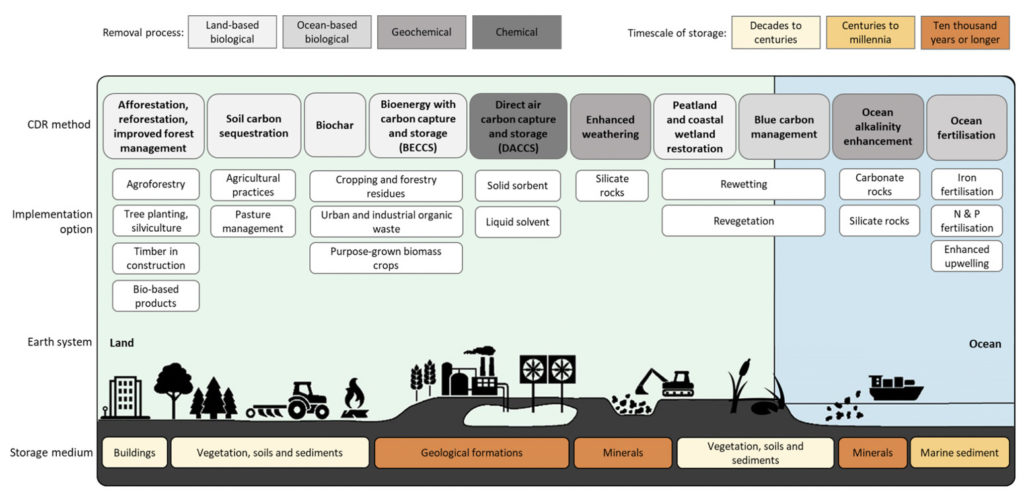
(See Carbon Brief’s in-depth explainer of the various methods for removing CO2 from the atmosphere.)
All pathways for limiting global warming to 1.5C and 2C use land-based CO2 removal methods, such as tree-planting, many use BECCS and some include direct air capture and storage, the report says.
Across scenarios for limiting warming to 2C, cumulative CO2 removal from 2020 to 2100 reaches an average of 328Gt for BECCS, 252Gt for land-based measures and 29Gt for direct air capture and storage, the report says.
In recent years, there has been “fervent debate” on the use of BECCS in scenarios for meeting climate targets, the report adds. Because of this, “many recent studies explore mitigation pathways with limited BECCS deployment”.
Currently, tree-planting and ecosystem restoration are the only “widely deployed” forms of CO2 removal, according to the report.
It notes that, despite limited use at present, technologies such as direct air capture and storage and enhanced weathering, which involves speeding up the natural rock weathering process to capture CO2, are projected to make a “moderate to large” contribution to future CO2 removal.
The upscaling of CO2 removal methods faces “various feasibility and sustainability constraints”, the report says. (For the sustainability constraints of tree-planting and BECCS, see: How does land contribute to climate change and how can it help to soak up CO2?)
Direct air capture and storage is currently limited by its large energy requirements and by cost, the report says. It adds that the technology is at a “medium readiness level”.
Enhanced weathering, meanwhile, “has been demonstrated in the laboratory and in small scale field trials, but has yet to be demonstrated at scale”, the report says.
The report also assesses the feasibility of ocean-based methods of CO2 removal, including “blue carbon management” – boosting the carbon stores of shallow coastal ecosystems such as tidal marshes, mangroves and seagrasses.
It notes that recent years have seen “increasing research” into the potential effectiveness, benefits and risks of boosting blue carbon stores.

Around 20% of the countries signed up to the Paris Agreement on climate change refer to “blue carbon” in their national climate plans, known as “nationally determined contributions”, the report says.
About 40% of those countries have pledged to manage shallow coastal ecosystems as part of efforts to adapt to climate change, it adds.
Blue carbon management has the potential to reduce emissions while providing habitat for wildlife, the report says. However, it adds that shallow coastal ecosystems are extremely vulnerable to climate impacts, including sea level rise, as well as other types of human degradation.
As well as assessing the potential of CO2 removal, the report examines research into “solar geoengineering”, methods for addressing some climate impacts by reflecting more sunlight away from the Earth, thus lowering temperature rise.
All types of solar geoengineering – also known as solar radiation management (SRM) – are united by their goal of limiting the effect of sunlight on the Earth, but they vary widely in their approach.
Possible methods include reducing heat-trapping clouds, sending a giant sunshade up into orbit or releasing aerosols into the stratosphere. (See Carbon Brief’s in-depth explainer on solar geoengineering.)
The report says that there is “high agreement” among research papers that solar geoengineering “cannot be the main policy response to climate change and is, at best, a supplement to achieving sustained net-zero”. It says:
“SRM contrasts with climate-change mitigation activities, such as emission reductions and CDR, as it introduces a ‘mask’ to the climate change problem by altering the Earth’s radiation budget, rather than attempting to address the root cause of the problem, which is the increase in greenhouse gas emissions in the atmosphere.”
It adds that the effects of solar geoengineering would “only last as long as deployment is maintained”.
Hypothetical research has shown that solar geoengineering has the potential to offset some of the effects of increasing greenhouse gas emissions, including increases in extreme temperatures and rainfall, melting of Arctic sea ice and glaciers and changes in frequency and intensity of tropical storms.
There has been some limited research into how solar geoengineering might pose risks to humans and wildlife, the report says.
Solar geoengineering via artificial aerosol release is projected to deplete the ozone layer, increasing deaths from skin cancer, according to the report.
It adds that solar geoengineering may drive changes in risk from infectious diseases and food security, depending on how it is deployed.
The report says that solar geoengineering “may also introduce novel risks for international collaboration and peace”. It continues:
“Conflicting temperature preferences between countries may lead to counter-geoengineering measures, such as deliberate release of warming agents or destruction of deployment equipment. Game-theoretic models and laboratory experiments indicate a powerful actor or group with a higher preference for SRM may use [aerosol release] to cool the planet beyond what is socially optimal.”
10. What role can cities and buildings play in cutting emissions?
Cities and urban settlements are covered in Chapters 8 and 9 of the report.
Cities and urban areas have a “substantial” and growing share in global greenhouse gas emissions, the SPM states with high confidence. The world’s top 100 highest emitting cities account for roughly 18% of the global carbon footprint. In 2015, total urban emissions – accounting for consumption and excluding aviation, shipping and biogenic sources – were estimated at 25GtCO2e, or 62% of the global total. In 2020, this increased to roughly 67-72% of global emissions, the report says.
Per-capita urban emissions rose between 2000 and 2015. A person living in a city in a developed country produced nearly seven times the share of emissions produced by someone in the lowest emitting region, the authors state with medium confidence.
However, while it is easy to associate urbanisation with higher incomes and levels of consumption, the concentration of people and activities is “actually an opportunity to increase resource efficiency and decarbonise at scale”, the report says with very high confidence.
The report’s summary for policymakers (SPM) states with very high confidence:
“[U]rban areas can significantly reduce emissions through the systemic transition of infrastructure and urban form (how cities are laid out) through low-emission development pathways.”
However, it adds that “cities can achieve net-zero emissions only if emissions are reduced within and outside of their administrative boundaries through supply chains, which will have beneficial cascading effects across other sectors”.
The figure below looks at how the building sector would change under different scenarios, ranging from high warming (red) to those staying below 1.5C (light blue). The panels show final energy (top left), CO2 emissions (top middle), carbon intensity (top right), energy intensity (bottom left), share of final energy from electricity (bottom middle) and share of energy from gases (bottom right).
Numbers in the first four panels are compared to 2019 levels, where values less than 1 indicate a reduction and those greater than 1 show an increase.
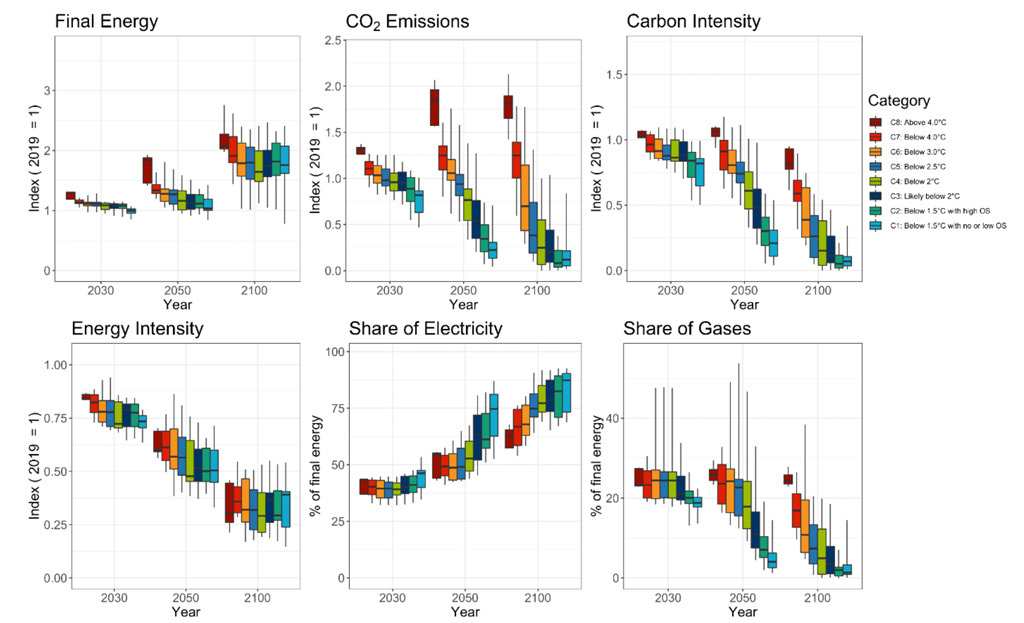
Across the building sector, the share of electricity in final energy use increases in all scenarios, rising particularly rapidly by 2050 for scenarios that aim to limit warming to 2C and below. Meanwhile, the share of gases dips rapidly and considerably.
Most of the world’s urban population growth is expected to occur in developing countries, as people with low per-capita emissions seek better lifestyles and incomes, and cities expand construction and new infrastructure to accommodate them.
This construction of new infrastructure and upgrading existing systems through to 2030 will result in significant emissions, the report says with very high confidence. If this construction rush uses conventional practices and technologies, it could result in emissions ranging from “8.5GtCO2 to 14GtCO2 annually up to 2030” and more than double 2010’s annual resource requirements for raw materials by 2050, up to about 90bn tonnes.
Determining the drivers of greenhouse gas emissions in cities is complex and involves understanding the “interplay of population size, income, state of urbanisation and how cities are laid out”. What shape new cities and towns take – how they are “designed, constructed, managed and powered” – will “lock-in behaviour, lifestyles and future urban emissions”.
Three broad mitigation strategies “have been found to be effective when implemented concurrently” in cities, states the SPM with very high confidence. These include reducing or changing urban energy and material use “towards more sustainable production and consumption” across all sectors, electrification and moving to low-carbon energy sources, and, finally, “enhancing carbon uptake and storage” through green and blue infrastructure that has “multiple co-benefits”.
According to the report, urban land areas could triple between 2015 and 2050, with “significant implications for future carbon lock-in”, especially if they continue to expand on farm lands and forests that hold significant carbon stocks. The report forecasts that Africa, eastern Europe, West-Central Asia and the Middle East will see the “highest rate of urban land growth”, while Asia and the developing Pacific, as well as developed countries will see the largest absolute amount of new urban land.
At the same time, there is high agreement that green and blue infrastructure, such as urban forests and green roofs, can mitigate climate change through sequestration, avoided emissions and reduced energy use because of cooling, with co-benefits for physical and mental health and better air quality for city-dwellers. According to the report, “global urban trees store approximately 7.4bn tonnes of carbon and sequester approximately 217m tonnes of carbon annually”.
The options with the best potential for mitigation and when they should be deployed differ depending on what kind of city it is, its state of urbanisation and existing land-use, the report notes.
The figure below demonstrates different typologies of urban growth that represent different levels of economic development and urbanisation. Emerging urban areas “bud out” as they build new infrastructure, while rapidly growing cities grow either upward or outwards as they undergo largescale, land-intensive development to build on new urban infrastructure. Established cities, meanwhile, have attained their “mature form”. Given that different neighbourhoods can undergo different growth trajectories, each city contains multiple urban growth typologies.
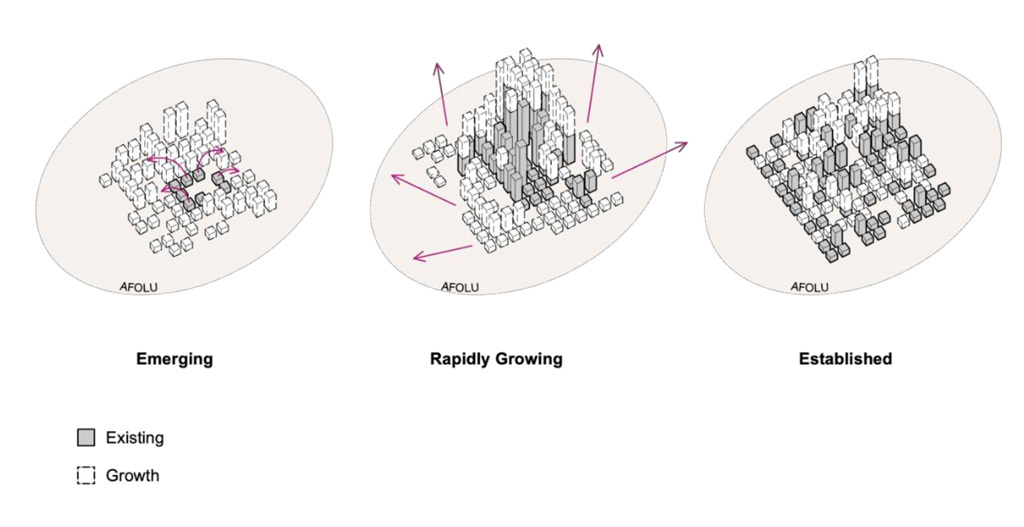
Established cities will achieve the highest GHG savings by replacing or retrofitting building stock, “strategic infilling and densifying”, and electrifying urban energy systems that rely on cleaner sources. Rapidly expanding cities, meanwhile, can avoid higher future emissions by “leapfrogging to low-carbon technologies” and by better urban planning that “co-locate[s] jobs and housing to achieve compact urban form”.
New and emerging cities, meanwhile, have the “unparalleled potential” to become “low or net-zero GHG” cities if they create “compact, co-located and walkable urban areas with mixed land use and transit-oriented design, that also preserve existing green and blue assets”.
The figure below shows the distribution of growth typologies across ten cities, picked to provide two examples of each of the five dominant categories of urban growth. For example, Paris and Osaka are two mature cities experiencing upward growth (light blue bars), while Shenzhen and Shuzhou are growing upward and outward (red).
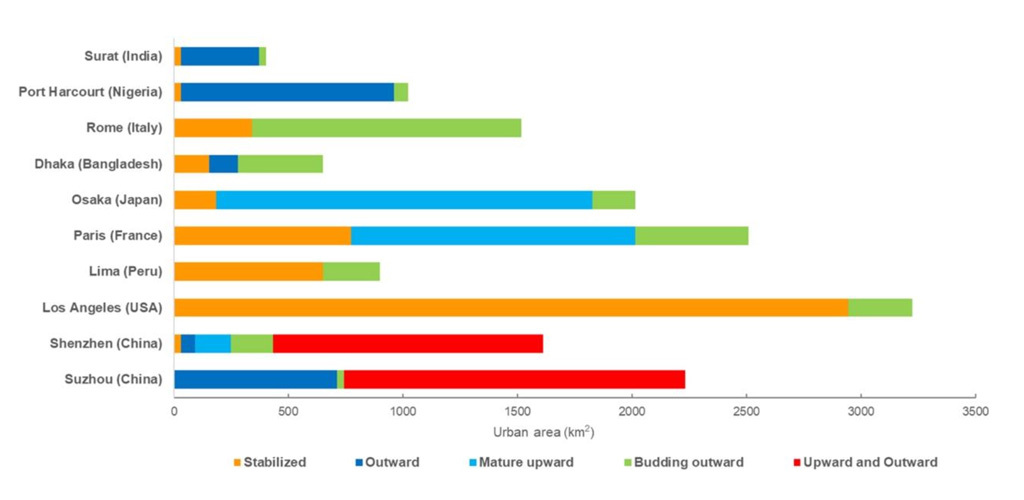
The report states with very high confidence that cities can only achieve net-zero emissions through “deep decarbonisation and systemic transformation”. It says that there is an urgent need to integrate mitigation and adaptation for cities to “address climate change and withstand its effects”, given current and increasing extreme climatic events. There is high agreement that the potential co-benefits of doing this “extend far beyond cities”.
But achieving this “transformational change” will require engaging with “multiple scales of governance, including governments and non-state actors, [along] with substantive financing”, it says with very high confidence.
Cities that use spatial planning to become more compact and resource-efficient could reduce GHG emissions between 23-26% by 2050, the report states with very high confidence.
This could be achieved if planners and policymakers worked to reduce the distance between houses and job centres, weaned people away from private vehicles and towards walking and low-emissions public transport, as well as by promoting urban green infrastructure and energy-efficient buildings.
The capacity of cities to develop and implement mitigation strategies varies “with broader regulatory and institutional settings [and] enabling conditions”, including access to technology, local governance capacity, engagement of civil society, and municipal budgetary powers”, the SPM states with very high confidence.

The urban poor stand to be disproportionately affected by climate change, says the report. However, mitigation measures such as storm-water management and urban greening can “enhance social equity and environmental justice”, since the poor are often forced to reside in low-lying, flood-prone areas and greening can reduce energy and health bills.
However, the report also warns that some mitigation and adaptation measures have trade-offs: high-density areas that lack provisions for “green and open spaces” may intensify the “urban heat island” effect, for example. Even the most “ambitious” mitigation plans could benefit private corporate interests “resulting in adverse effects on the urban poor”, it adds.
Chapter 9 of the report focuses on buildings and the built environment, given that buildings are a major source of greenhouse gas emissions and present a significant challenge to cities’ climate mitigation efforts.
This is chiefly because of their energy use and the large quantity of emissions “embodied” within them that stem from their major components: cement, concrete and steel. The chapter looks in detail at what mitigation technologies and practices could potentially help get to “zero-carbon buildings”.
In 2019, buildings accounted for 31% of the world’s energy demand, 18% of electricity demand and 31% of CO2 emissions. Of these, 57% were from electricity and heat generation elsewhere and 18% emissions embodied in steel and cement, with only 24% from direct emissions on site.
If mitigation measures were implemented at the “design, construction and use phase”, such as by limiting the demand for carbon and energy-intensive materials, the report has high confidence that buildings the world over could reach net-zero GHG emissions “while ensuring decent living standards”.
Up to 61% of global building emissions (8.2 GtCO2) could be cut by 2050, states the SPM: energy efficiency policies contribute 42% to this potential, renewable energy policies 9% and “sufficiency policies” that help avoid energy, water, material and land-use contribute 10%.
Developing countries offer the largest share of mitigation potential for new buildings, while the highest potential for developed countries is in retrofitting existing buildings.
The report cites various studies that show how to cut these embodied emissions trajectories: from limiting the amount of new floor area required, deploying material efficiency measures, such as lightweighting and improved building design, and switching to lower-carbon alternative materials, scrap recovery and re-use.
Besides just the built environment, there are several options to mitigate buildings’ footprints: using more daylight, electric lighting, energy-efficient household appliances, insulation materials, heat pumps, indirect evaporative cooling, building automation and control systems, and smart meters and grids that implement renewable electricity sources.
The report says that electrification, rather than hydrogen, is “expected to be the dominant strategy in buildings as electricity is increasingly used for heating and for cooking”. This is because electrification is more efficient, it adds.
“We see examples of zero energy or zero-carbon buildings in almost all climates”, said IPCC WG3 co-chair Jim Skea in a statement circulated with the report’s launch. “Action in this decade is critical to capture the mitigation potential of buildings.”
11. What needs to happen in the transport sector to cut CO2?
The report has high confidence that “meeting climate mitigation goals would require transformative changes in the transport sector”. The SPM has high confidence that transport emissions have grown faster than the overall total:
“Average annual greenhouse gas emissions growth between 2010 and 2019 slowed compared to the previous decade in energy supply (from 2.3% to 1.0%) and industry (from 3.4% to 1.4%), but remained roughly constant at about 2% per year in the transport sector.”
Transport was the fourth largest source of greenhouse gas emissions in 2019, accounting for around 15% of total greenhouse gas emissions, the report says. Road transport drove 69% of these emissions, while shipping and aviation were responsible for 9% and 7%, respectively.
The figure below shows the change in transport emissions over 1990-2019 as a global average (top) and by continent (bottom).
The report says that growth in passenger and freight travel demand is strongly dependent on population growth and GDP. For example, over 2005-15, the number of passenger cars in use grew by 45% globally – with the most significant growth occurring in Asia and the Middle East (119%), Africa (79%) and, south and central America (80%).
Without mitigation actions, transport emissions could grow by 65% by 2050 – largely driven by rising demand for freight and passenger services in developing countries in Africa and Asia – the report warns. However, it adds that successful mitigation strategies could reduce sectoral emissions by 68% – in line with limiting global warming to 1.5C above preindustrial temperatures.
Since AR5, there has been “growing awareness” of the need for demand-side solutions, the report says. It stresses the need for “systemic infrastructure changes that enable behavioural modifications and reductions in demand for transport services that can in turn reduce energy demand”.
The report says that lessons can be learned from the Covid-19 pandemic, as the 2020 lockdowns had a greater impact on emissions from transport than from any other sector. It continues:
“The response to the Covid-19 pandemic has also shown that behavioural interventions can reduce transport-related GHG emissions. For example, Covid-19-based lockdowns have confirmed the transformative value of telecommuting replacing significant numbers of work and personal journeys as well as promoting local active transport.”
Meanwhile, the report notes that urban transport is responsible for around 8% of global CO2 emissions and calls urban design “a major way” to influence greenhouse gas emissions.
For example, it cites research which shows that implementing “urban form changes” – such as making cities denser to reduce the travel demand – could cut urban transport emissions by one quarter by 2050, compared with a business-as-usual scenario.
Meanwhile, the SPM has high confidence that “demand-side options and low-GHG emissions technologies can reduce transport sector emissions in developed countries and limit emissions growth in developing countries”. It adds that measures including teleworking and vehicle automation could reduce travel demand and emissions.
Electromobility – the use of electrically powered vehicles, such as cars, bikes and buses – is “the biggest change in transport since AR5”, according to the report.
The report has high confidence that battery-electric vehicles (BEVs) have lower life-cycle greenhouse gas emissions than internal combustion engine vehicles (ICEVs) when they are charged with low carbon electricity.
Moreover, it notes that over their lifetime, EVs would save money relative to combustion-engine vehicles, with a mitigation cost of less than $0 per tonne of CO2 saved (See: What are the costs and benefits of efforts to cut emissions?)
They also have other benefits, such as their potential to support the grid, the report says. As such, the SPM says that “electric vehicles offer the greatest low-carbon potential for land-based transport.”
Despite lower running costs, BEVs are currently more expensive to buy than equivalently sized ICEVs – but the report highlights that as global lithium-ion battery production increases, unit costs are declining. Prices have declined sharply since the AR5 was published, it says.
However, the report notes concerns about the widespread adoption of battery technologies – including the “growing concerns about resource availability, labour rights, non-climate environmental impacts, and costs of critical minerals needed for lithium ion batteries”.
One study, for example, estimates that given the current rate of growth, the demand for many rare earth elements and other critical materials could increase by 3,000 times or more by 2050.
However, the report says that recycling batteries will significantly reduce long-term resource requirements. Standardising battery modules and designing batteries with a focus on recyclability, can aid this process, it says, adding that many manufacturers and governments are “considering battery recycling issues to ensure the process is mainstreamed”.
The SPM has high confidence that “electric vehicles powered by low emissions electricity offer the greatest low carbon potential for land- based transport, on a life cycle basis.” However, the report notes that decarbonising the transport sector will require significant growth in low-carbon electricity.
One alternative to BEVs are hydrogen fuel cells vehicles (HFCVs). The figure below shows the energy consumption of internal combustion engine vehicles (ICEVs), hydrogen electric vehicles (HEVs) and battery electric vehicles (BEVs) of different masses.
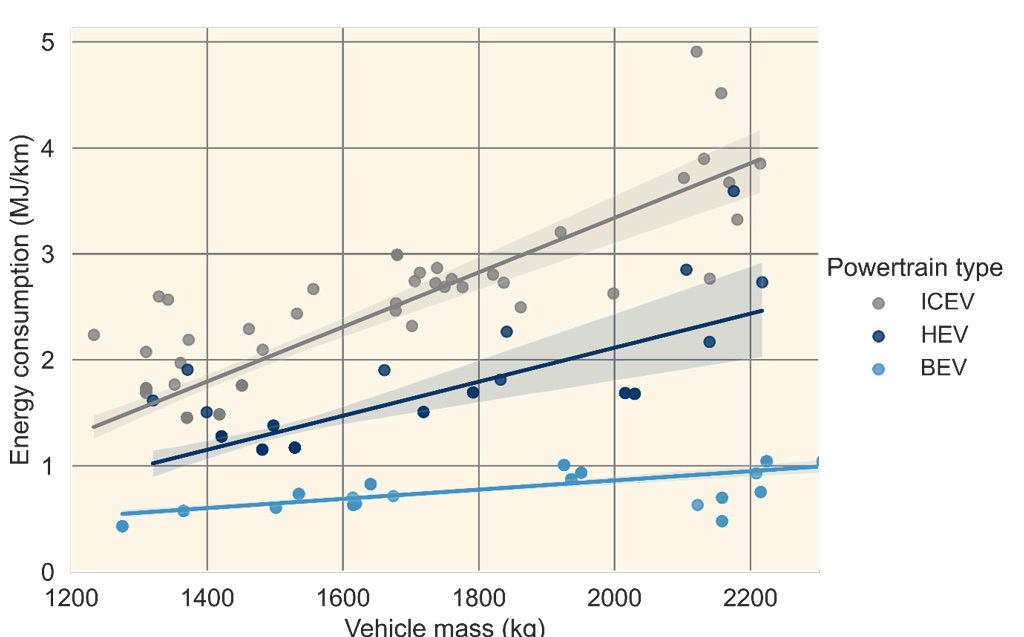
Both electric vehicles and hydrogen fuel cell vehicles require separate charging infrastructure, so the report says there needs to be simultaneous investment in both infrastructure and vehicle technologies for both to decarbonise rapidly.
However, the report says that the feasibility of HFCVs is lower than that of BEVs – in part because the infrastructure to produce, transport and deliver hydrogen is under-developed.
Meanwhile, the report has medium confidence that long-range, heavy-duty trucks can be decarbonised through a combination of batteries and hydrogen or biofuel based fuels – adding that initial deployment of some of these technologies are feasible by 2030. The SPM emphasises advances in electrification and battery technology in its treatment of heavy duty trucks.
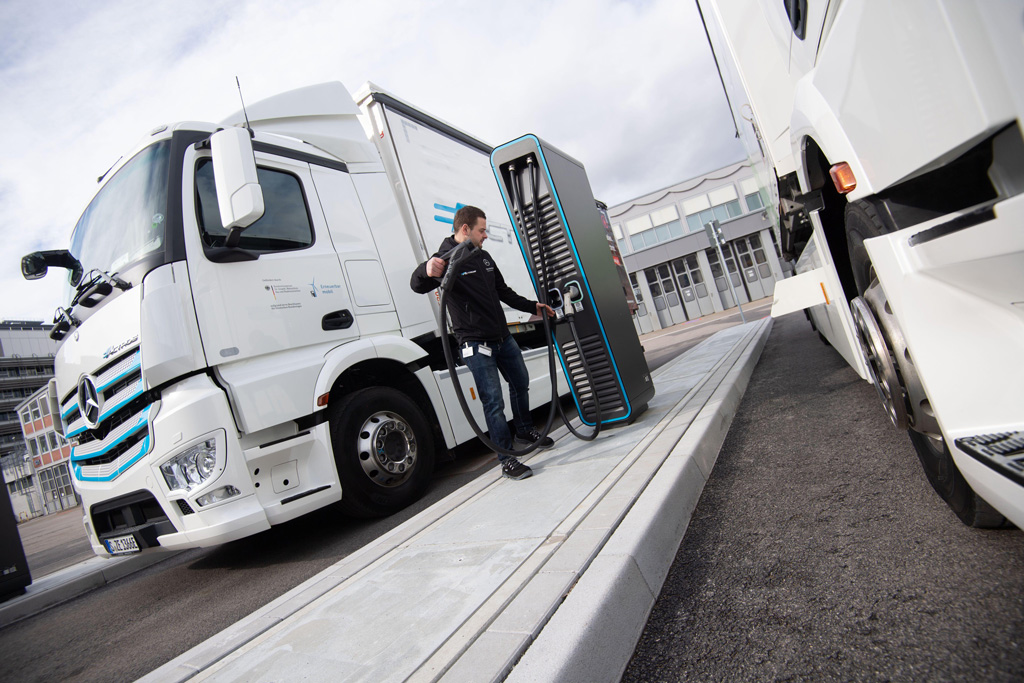
The report also discusses the use of biofuels – which it says could be used in all segments of the transport sector. The SPM says that biofuels are already deployed in some markets – adding that sustainable biofuels “can offer additional mitigation benefits in land-based transport in the short and medium term”.
However, the report notes that there are concerns about the feasibility of biofuels, including the land, water and biodiversity impacts. (See: How does land add to climate change and how can it help soak up CO2?)
The report also contains sections on the trends and challenges with decarbonising the aviation and shipping industries – a new addition since AR5.
It says that “since AR5, the faster-than-anticipated adoption of electromobility, primarily for light-duty vehicles, has partially shifted the debate around the primary use of biofuels from land transport to the shipping and aviation sectors”.
However, it adds that, despite growing interest in the use of biofuels for aviation, “demand and production volumes remain negligible compared to conventional fossil aviation fuels”.
The report says that research and development is still needed to decarbonise the shipping and aviation industries. For example, it has medium confidence that “advanced biofuels”, ammonia, or synthetic fuels produced using DACCS or BECCS could be used to produce such low-carbon jet fuels, but says these options “still require demonstration at scale”.
The report also says that hydrogen “holds significant promise” for emissions reductions in “harder-to-electrify transport segments, such as heavy-duty vehicles, shipping and aviation”. However, it adds that further technological advances are needed for them to play a greater role.
The SPM has medium confidence that electrification “could play a niche role for aviation and shipping for short trips”. For example, the report says that for shorter ranges, flights of light planes carrying up to 50 passengers may be able to use electric power. However, it says that liquid fuels would be needed for most major long distance journeys.
As such, it says that “strategic use of energy-intensive fuels, focussed on harder-to-decarbonise transport segments, can minimise the increase in electricity demand”.
The report also notes that the Paris Agreement does not cover emissions from international shipping and aviation. It suggests that “ including international shipping and aviation under the governance of the Paris Agreement could spur stronger decarbonisation efforts in these segments.”
Across the transport sector as a whole, CO2 emissions are projected to increase in “reference scenarios”, the report says. However, it adds:
“The carbon intensity of energy declines substantially by 2100 in likely 2C and below scenarios, leading to substantial declines in transport sector CO2 emissions with increased electrification of the transport system.”
The figure below shows the final energy (top left), CO2 emissions (top middle), carbon intensity (top right), share of final energy from electricity (bottom left), share from hydrogen (bottom middle) and share from biofuels (bottom right), for the transport sector.
The top three panels are compared to 2019 values, where numbers less than one indicate a reduction and numbers greater than one indicate an increase. In all subfigures, red indicates scenarios with high future warming levels, while blue indicates low warming. Projections for 2030, 2050 and 2100 are shown.
12. How can industry be decarbonised?
The 11th chapter of the report looks at industrial emissions, which accounted for 24% of greenhouse gases in 2019 (14.1GtCO2e) and were second only to the energy sector.
As a sector “expected to decarbonise slower than other[s]”, it will keep this leading position for coming decades, the report says, citing the IEA’s net-zero roadmap for the energy sector.
The coloured areas in the figure below show contributions to industrial emissions by source – for example, metals are shown in shades of purple. The grey and pale yellow areas show indirect industrial emissions from power generation and heat, which together take the sector’s contribution to 20GtCO2e – and 34% of global emissions overall.
The dashed lines on the figure show the share of industrial emissions from direct fuel combustion (blue), industrial processes such as cement production (IPPU, purple) and waste (green).
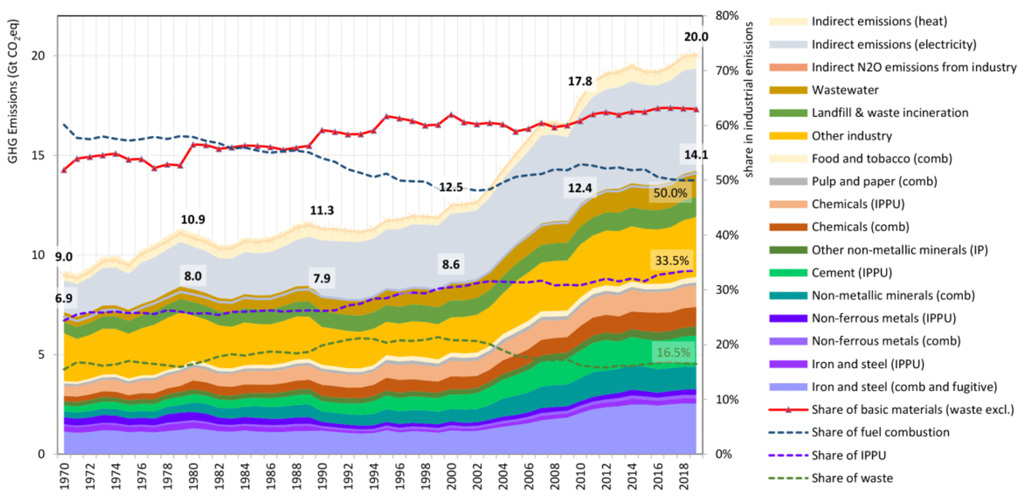
The report says with high confidence – “whatever the metric” – that industrial emissions have been growing faster than any other sector since the turn of the millennium, driven by increased extraction and production of basic materials.
Getting to net-zero industrial CO2 emissions is possible, but “challenging”, the report states, with high confidence. The figure below shows contributions to cutting industrial emissions to net-zero. Energy and material efficiency – shown as yellow and dark green wedges, respectively – will be critical, the report says, as will a reduced demand for materials and circular economy solutions (pale green).
Electrification (orange) is also a key mitigation option for industry, the report states with high confidence, which could “potentially [be] produced from abundant renewable energy sources or other low carbon options”.
Industrial use of electricity directly or indirectly, using hydrogen from electrolysis “offers many options to reduce emissions [and] it also can provide substantial grid balancing services”, such as electrolysis and storage of hydrogen for chemical process use or demand response.
Cutting carbon emissions in primary production could also include switching to new processes that use low- to zero-GHG energy carriers and feedstocks (blue wedge), such as electricity, hydrogen, biofuels and carbon capture and utilisation (CCU) for carbon feedstock, as well as and carbon capture and storage (CCS) for remaining CO2 (purple).
All these options would require scaling up infrastructure – from electrification to hydrogen and recycling – but they also require the “phase-out or conversion of existing industrial plants”.
The figure below shows how key climate metrics for industry would change under various scenarios, ranging from high warming (red) to those keeping warming below 1.5C (light blue).
The panels show final energy (top left), CO2 emissions (top middle), carbon intensity (top right), energy intensity (bottom left), share of final energy from electricity (bottom middle) and share from gases (bottom right). The first four panels show changes relative to 2019 levels, with numbers below 1 indicating a decrease and those above 1 showing an increase.
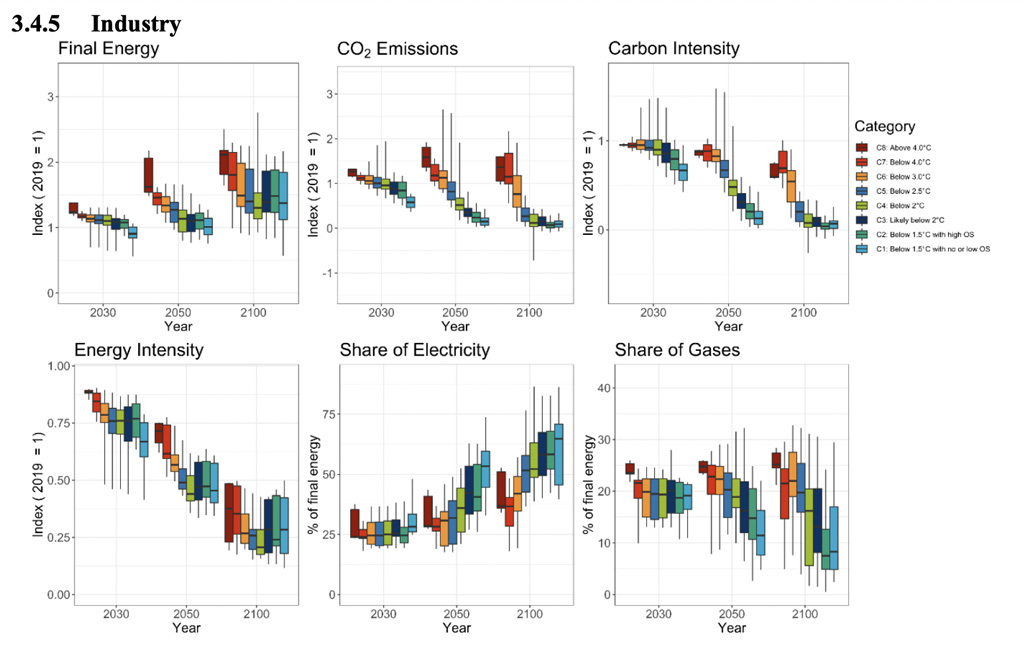
The report states with medium confidence that “the geographical distribution of renewable resources has implications for industry”, including “reshaping” where energy production and material manufacturing takes place, how value chains are organised, trade patterns and what gets shipped across the world.
Countries with abundant solar and wind “or low fugitive methane co-located with CCS geology” could become exporters of hydrogen or its carriers, or become the epicentre of basic material production. This reallocation “will have global distributional effects on employment and economic structure”, states the SPM with medium confidence.
The greenhouse gas intensity of major basic materials has “stagnated over the last 30 years”, the report says, but could be reduced to net-zero by 2050 based on the technological shifts and new technologies identified by the report.
Global per-capita material intensity – the global stock of manufactured material per person per year – is growing, according to the report, but is decreasing in some developed countries, showing a decoupling from per-capita GDP.
Of all materials, demand for plastic “has been growing the strongest since 1970”, says the report with high confidence. It points to plastic’s “current >99% reliance on fossil feedstock, very low recycling, and high emissions from petrochemical processes” as posing a “challenge” for reaching net-zero emissions, adding that there are “no shared visions for fossil-free plastics, but several possibilities”. However, the authors note that plastics are also important for “reducing emissions elsewhere” – for example, in making vehicles lighter.
Notably, however, the report says with medium confidence that even emissions-intensive industries, such as steel, plastics, ammonia and cement, can achieve “close to net-zero emissions” by 2050 if they deploy multiple “available and emerging options”.
This will require a shift “from the historic focus on important but incremental improvements”, such as energy efficiency, to “transformational changes” in energy use and raw material sourcing.
In addition, the report says the transition demands greater material efficiency and circular material flows, both of which “are not adequately represented in climate change scenario modelling and integrated assessment models, albeit with some progress in recent years”.
Because basic materials appear in different forms in complex value chains and data on fossil-free industrial processes is limited, material efficiency and circularity might be less represented in models as compared to options such as carbon capture and storage (CCS), the report notes. This means the need for CCS and the overall cost of mitigating industrial emissions “may be overestimated”.
Of these materials, steel, cement, biomass and fossil-fuel feedstocks are described in detail in the chapter.
Steel
Steel accounted for 20% of total global direct industrial emissions in 2019, including coke oven and blast furnace gases. The report states with high confidence that “there are several technological options for very low- to zero-emissions steel, but their uptake will require integrated material efficiency, recycling and production decarbonisation policies”.
Material efficiency designed to use less but more long-lasting steel, factoring in “reuse, constructability and low contamination recycling”, could potentially reduce steel demand by up to 40%, it says.

Options to decarbonise the production of steel include retrofitting existing plants for “partial fuel switching” to alternatives such as “biomass and hydrogen, CCU and CCS, followed by very low- and zero-emissions production based on high-capture CCS or direct hydrogen, or electrolytic iron ore reduction followed by an electric arc furnace”.
Retrofitting blast furnaces with CCU or CCS is an option that could work in areas with “access to transport to geology”. However, it would be difficult to go “beyond 50% capture” which is “insufficient for long-term emission targets”. Given that blast furnaces replace their liners every 15-25 years, this could be an opportunity to fit a new build designed for 90% capture.
Aqueous electrolysis and molten oxide electrolysis “both promise a significant increase in energy efficiency”, the former requiring advances in high-temperature electrodes, while the latter “is possible with today’s electrode technologies”.
Cement
The world currently “overuse[s]” cement and concrete “because they are cheap, durable and ubiquitous” and consumers “typically do not give weight” to the emissions associated with making them, the report says.
While there are “several current and near-horizon options” to cut concrete emissions, there is a need for producers, users and regulators to be educated on what these options are, as well as policies to spur “innovation and commercialisation”, the report states with medium confidence.
Efforts to only use well-made “concrete thoughtfully and only where needed” could reduce emissions by 24-50%, the report estimates. This works by creating less demand for clinker, the mix of limestone and minerals fired in a kiln that forms the backbone of the cement industry. The chemical reaction involved in making clinker is a major source of CO2 emissions, accounting for nearly 60% of the total from cement even in plants with the best available technology.
Substituting materials in this mix can reduce process emissions by up to half and sometimes more. However, the report says that “until a very low GHG emissions alternative binder to Portland cement is commercialised, which does not look promising in the near to medium term, CCS will be essential for eliminating emissions” associated with the process.
Chemicals
The chemical industry uses fossil fuels as its basic raw materials for manufacturing because they are “inexpensive and still without carbon pricing”.
Decarbonising the main industrial feedstocks, including hydrogen, ammonia, methanol, carbon monoxide, ethylene, propylene and aromatic chemicals, is a question of price, the report notes.
While several alternative technologies exist to “greatly reduce” emissions, “the costs vary widely”, say the authors with high confidence. Biomass or electricity-based replacements are “likely to be more expensive” and, in the former case, “likely to be limited due to competing land use” .
Circular economy
Circular economy for industry involves moving away from an “extract-produce-use-discard” model of production to the design of durable, easily repaired goods, “with components that can be reused, remanufactured, and recycled”. This, in turn, can reduce emissions from energy and the processing of raw materials. For instance, switching to recycled materials to produce aluminium requires only about 5% as much energy as primary production.
The report’s authors, however, warn that “careful evaluation is needed from a lifecycle perspective since some recycling activities may be energy- and emission-intensive, for example, chemical recycling of plastics”. They also note that, “problematically”, just as the plastics industry improves its recyclability, it has been expanding into markets without recycling capacity, citing a 2021 study.
The report describes how circular economies can operate at different levels, from what it describes as the micro level of cleaner production within an individual company, to “meso-level” shared use of resources between firms practising “industrial symbiosis” and, finally, “urban symbiosis”, where industries look to cities themselves as sources of waste and raw materials, or cooperate to form a “regionally eco-industrial network”.
The report’s authors state with high confidence that “industry has so far largely been sheltered from the impacts of climate policy and carbon pricing due to concerns for competitiveness and carbon leakage”. The chapter concludes by acknowledging that “the effectiveness of mitigation policies in industry is poorly known”.
It adds that material efficiency and “circularity” have not been sufficiently integrated with energy and climate policies, “which partly results from…a lack of high-level political focus, a history of strong industrial lobbying, uncoordinated policy across subsectors and institutions, and the sequential nature of decision-making along supply chains”.
13. What climate policies are being implemented and are they working?
The report says with high confidence that the expansion of government climate policies since AR5 has avoided emissions in the region of “several” billion tonnes of CO2 each year.
However, it also notes that “big gaps” remain and the stringency of many policies “falls short of what is needed”. Policy coverage is weaker for non-CO2 gases and industrial emissions, it adds.
The IPCC’s understanding of climate governance has become “more encompassing and complex” since AR5, and the new report examines in detail the conditions that are required for success. It is the first IPCC report to assess the extent to which changes in emissions, renewables expansion and other relevant metrics can be attributed to climate policies.
One way for a country to tackle climate change is to enshrine such actions in law. Some have taken the lead from the UK’s Climate Change Act and set overarching “framework” laws covering the whole economy, while others, such as India and Ghana, have sector-specific laws covering areas such as energy efficiency and renewables.
By 2020, the report says that climate laws primarily targeting greenhouse gases were in place across 56 nations, covering 53% of emissions. There were also nearly 700 “additional” laws that “may also have an effect on mitigation”.
The chart below highlights the recent expansion of climate legislation, with the dark bars showing the growth in both the number of countries (bottom charts) and share of emissions (top charts) covered by such legislation from 2010 through to 2020.
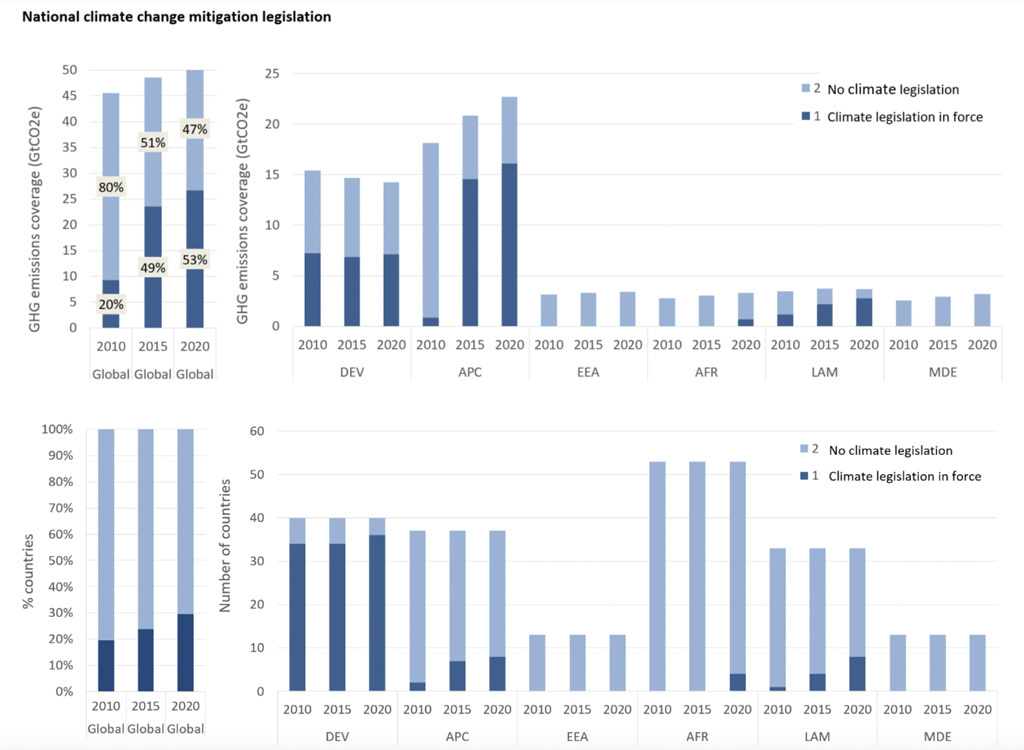
As for the impact of this legislation, one study cited in the report found that, as of 2016, climate laws were associated with an annual reduction in global emissions of 5.9bn tonnes of CO2 (GtCO2) and 38GtCO2 cumulatively since 1999.
National climate strategies and targets are another way governments can take action. As the darker bars in the charts below show, there has been an increase in the number of countries (bottom charts) and share of emissions (top charts) covered by such targets since 2010, although targets set into law (darkest blue) are rarer than those merely set out as policies at the government level (mid-range blue). As of 2020, 90% of global emissions are now covered by targets.
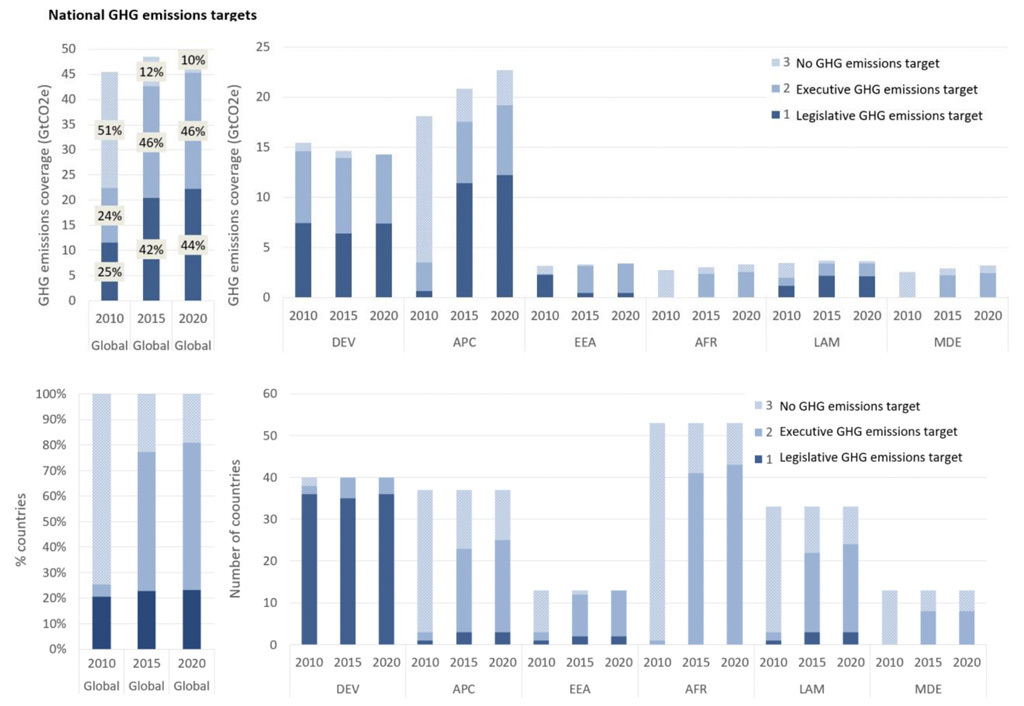
These sorts of goals can set a “direction of travel” for cutting emissions, supporting “long-term structural change” and linking climate mitigation and adaptation, the report says.
However, it notes that targets can also vary considerably both in their stringency and coverage, adding that more ambitious targets may not lead to better policies. ”Put another way, words do not replace actions,” it says.
There are three key varieties of climate targets: purely national strategies; nationally determined contributions (NDCs), established under the Paris Agreement; and long-term strategies that look beyond the 2030 targets set in most NDCs.
The report states that many long-term strategies refer to net-zero emissions or variations of that term by 2050 or 2060, with one study estimating that 131 countries have “adopted, announced or are discussing” such goals, covering 72% of global emissions.
(A more recent estimate by the Net Zero Tracker project found that 135 countries and 88% of emissions are now covered by net-zero targets.)
While “some have argued” that this expansion of climate targets marks an “important increase in climate mitigation momentum” in recent years, the report adds:
“On the other hand, net-zero emission targets in their current state vary enormously in scope, quality and transparency…and this makes scrutiny and comparison difficult.”
The report also considers the institutions that countries have set up to tackle climate change.
It notes that “relatively few” countries, including the UK, China and New Zealand have set up bodies specifically tasked with this, requiring “broad national political agreement”. Many developing countries simply lack the capacity to establish such institutions, the report says.
More often, nations have “layered” climate responsibilities onto pre-existing institutions, such as the US Environmental Protection Agency (EPA), the report concludes.
Sub-national actors are also identified as important, given their responsibility for climate-relevant areas such as housing. In total, the report states that 10,500 cities and nearly 250 regions, representing more than 2 billion people, have made climate pledges, although it adds that these are “largely voluntary”.
Climate laws, targets and institutions give rise to policies and the report assesses how effective these policies have been. It notes that this is “very challenging”, given the need to consider not only emissions cuts but also costs, equitable outcomes, harmful side-effects and other factors. Climate policies are divided into three key groups:
- Economic – e.g. carbon taxes, emissions trading schemes, taxes on fossil fuels.
- Regulatory – e.g. renewable portfolio standards, vehicle fuel standards, methane regulations.
- Other – e.g. voluntary agreements, government technology procurement policies, corporate carbon reporting.
The report finds that of all the climate policy instruments it assesses, carbon pricing – including carbon taxes and emissions trading schemes (ETS) – has been “one of the most widely used and effective” options to reduce emissions. As of May 2020, 30 carbon tax regimes and 31 ETSs were planned or in effect, covering 22% of annual global emissions.
Despite this, the report also states that, overall, “both coverage and price are lower than is needed for deep [emissions] reductions”.
It also notes that carbon pricing has limitations – for example, in areas that are less sensitive to price incentives, such as energy efficiency, or for higher cost mitigation measures. The report adds that carbon taxes are one of the least popular mitigation policy options among the public.
The SPM states with medium confidence that removing fossil fuel subsidies could cut global greenhouse gas emissions by up to 10% by 2030, and with high confidence that this would also boost public revenue and macroeconomic performance.
However, it adds that the fossil fuel industry lobbies hard to maintain these subsidies, and protests from Cameroon to Bolivia have forced governments to abandon subsidy reform attempts, due to the additional costs borne by consumers. The report gives Indonesia as an example of a nation that has successfully removed subsidies.
There is high agreement in the report that renewable portfolio standards and feed-in tariffs have played an “essential role in the massive expansion of renewable energy capacities”.
The SPM concludes that such regulatory policies have “proven effective in reducing emissions”.
Overall, the SPM emphasises the importance of “comprehensive” and economy-wide policy packages rather than single-policy instruments.
Beyond looking at the variety of policies that exist, the report also considers the conditions under which effective climate governance takes place, painting a picture of an ideal climate-focused government.
Overall, while conservative parties in some countries support climate action, there is high agreement that:
“On average, a higher share of green parties in a parliament is associated with lower greenhouse gas emissions, and left-wing parties tend to adopt more pro-climate policy positions.”
Other features of systems that are effectively tackling climate change include proportional representation, broader public participation in decision making and fewer organisations involved in lobbying the government.
Despite identifying these factors, the report is not optimistic about states shifting towards more climate-friendly systems of governance:
“Because political systems are so politically and historically entrenched they are not likely to change quickly even though this could facilitate domestic climate mitigation efforts.”
The report also specifically calls out fossil fuel companies, noting that they have been “important agenda-setters in many countries, including the US, the EU, Australia, China, India and Mexico”, adding that “corporate opposition to climate policies is often facilitated by a broad coalition of firms”. It also notes that:
“In the US, the oil industry has underpinned [the] emergence of climate scepticism and its spread abroad.”
It also acknowledges the role of “conservative foundations” financing thinktanks and activist networks to oppose climate policy, while stating that there is “limited knowledge about the conditions under which actors opposed to climate action succeed in shaping climate governance”.
It says that “more confrontational forms of climate activism have become increasingly common” in recent years, noting that one analysis showed that a quarter of fossil fuel projects faced with such resistance ended up being cancelled.
The growing role of litigation is also highlighted, with high agreement that this can affect the outcome and ambition of climate governance. The report notes that at least 37 systemic cases have challenged states’ efforts to cut emission or adapt to climate change.
The report refers to the importance of ideas, value and beliefs, noting that levels of peoples’ climate concern have increased in most countries.
It emphasises the role of the media in shaping climate discourse and says that despite the threats of misinformation and polarisation, media coverage has been growing and has generally “become more accurate over time”.
The report also warns that “anti-climate ideas or beliefs” may arise in the face of some climate policies that are viewed as placing constraints on people, citing protests in reaction to toll roads in Norway and the gilets jaunes in France.
Taking the views of vulnerable and affected communities into account is, therefore, important, the report states, adding with high agreement that explicit attention to equity and justice is “salient to both social acceptance and fair and effective policymaking for mitigation”.
Finally, while the report acknowledges that low-carbon activities can be less appealing in societies based around fossil fuel extraction, effective climate policies “can alter the importance of [a] country’s material endowments in a way that underpin more forceful climate governance over time”.
14. Are the Paris Agreement and climate finance helping cut emissions?
International cooperation to tackle climate change is having “positive and measurable results”, the report states with high confidence.
There have been a number of notable developments in this sphere since AR5 was published, particularly the adoption of the Paris Agreement in 2015.
The report provides a “preliminary assessment” of the agreement – a landmark treaty that built on earlier progress made with the UN Framework Convention on Climate Change (UNFCCC) and the Kyoto Protocol.
It extended emissions goals to encompass developing countries and the developed countries, such as the US, that had withdrawn from the Kyoto Protocol, while enabling countries to set their own targets, known as nationally determined contributions (NDCs), rather than establishing top-down ones.
The SPM states with high confidence that the Kyoto Protocol “led to reduced emissions in some countries”, with those that took on binding Kyoto targets cutting emissions by around 7% on average over 2005-2012 relative to a no-Kyoto scenario. The report says that the protocol also contributed to national capacities for emissions accounting and carbon markets.
While international cooperation has helped to set a “global direction of travel” and helped cut emissions in many countries, the report states that:
“It remains to be seen whether it can achieve the kind of transformational changes needed to achieve the Paris Agreement’s long-term global goals.”
Assessments of the Paris Agreement are “necessarily speculative and limited by the lack of credible counterfactuals”, the report says. Despite this, it adds that “numerous assessments exist”, with a substantial divide between those that expect a positive outcome and those that do not.
The report notes that the more optimistic assessments point to the increased participation, falling costs of low-carbon technologies and the regime’s provision for developing country support.
Others argue that NDCs will not be achieved because they are not legally binding at the international level and are inconsistent in their level of ambition, it adds.
Existing NDCs, if achieved, would certainly cut emissions, although the report notes that, as it stands, a considerable “emissions gap” would remain. (See: How do current policies and pledges compare to scenarios assessed by the IPCC?) The report notes that current NDCs “imply global warming in the range of 3C by 2100”.
The report says that the NDC system, which is designed to provide transparency and accountability between nations, as well as regular “stocktakes” to assess progress, “may instil confidence and trust, and foster solidarity among nations”. It states that:
“Ultimately, the overall effectiveness of the Paris Agreement depends on its ability to lead to ratcheting up of collective climate action to meet the long-term global temperature goal… there is some evidence that this is already occurring.”
The report notes that some analysts have linked the consideration or adoption of mid-century net-zero targets by 127 countries to their participation in the Paris Agreement and its Article 4, which commits to ramping up ambition over time.
In terms of ensuring “fairness”, the report says that, at present, mechanisms in the Paris Agreement for promoting equitable burden-sharing between developed and developing countries “are undefined”.
In order to achieve the Paris Agreements goals, the report suggests international cooperation efforts should “better address sector-specific technical and infrastructure challenges” and finalise rules for public climate finance.
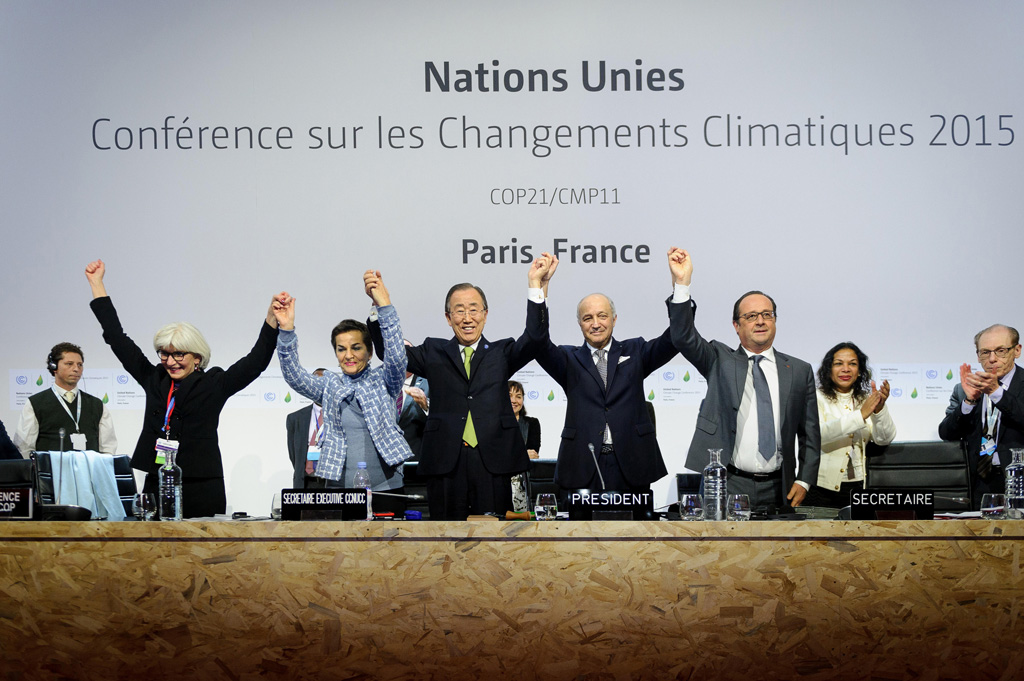
Outside of the UN climate process, other forms of international cooperation can both help and hinder climate action.
The report notes that so far global aviation and shipping targets “fall far short” of what is required to achieve the Paris Agreement targets. It adds that international cooperation “fails to fully address transboundary issues associated with solar radiation modification and carbon dioxide removal”.
Money is critical for successful climate action and the SPM concludes with medium confidence that annual tracked financial flows for climate adaptation and mitigation increased by “up to 60% between 2013/14 and 2019/20.
Despite this increase, it adds that this growth has slowed since 2018 and says that, globally, the money being pumped into areas such as renewables and low-carbon transport falls “short of the levels needed to achieve mitigation goals”.
The report notes that the 2018 UNFCCC biennial assessments and IPCC 1.5C report placed global financial needs at $1.7tn per year between 2020 and 2030-2035, in order to achieve 2C warming and $2.4tn to achieve 1.5C – both for the energy sector alone.
Globally, it concludes that annual climate finance flows have to increase by between three and six times to meet average annual needs until 2030.
The funding shortfall is particularly pronounced in developing nations which need between four and eight times more annual investment until 2030 than they are currently getting, according to the report, as the chart below shows.
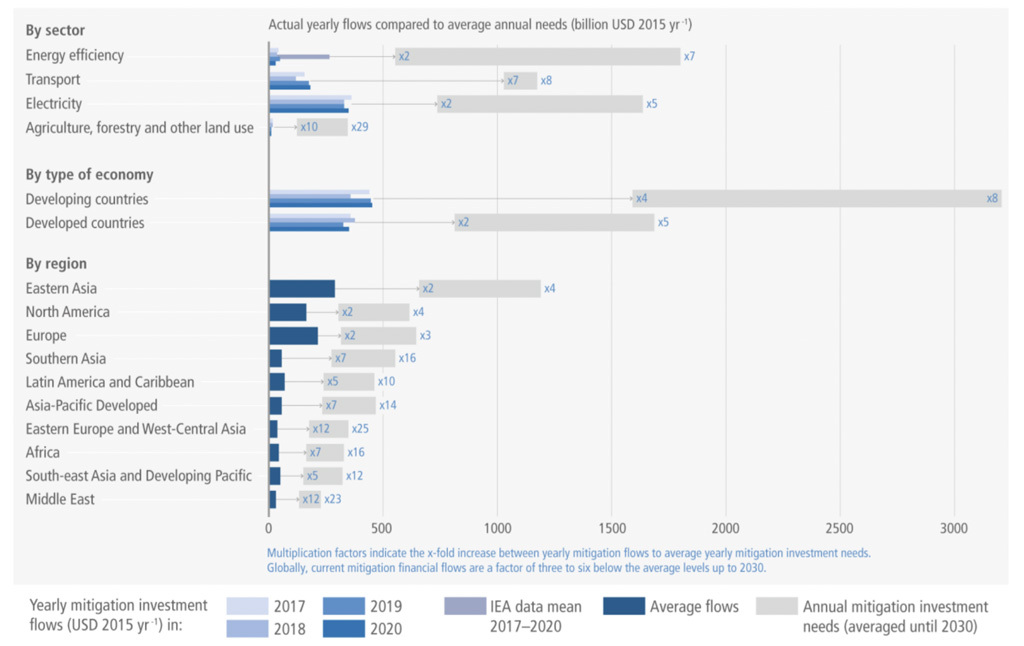
Moreover, the report says that there is a “persistent misallocation of global capital”, with fossil-fuel financing remaining high. Meanwhile, adaptation finance has been relatively overlooked, with more than 90% of funds going to mitigation between 2017 and 2020.
Climate finance – referring to wealthier nations providing money to developing nations to help cut emissions and adapt to global warming – is, therefore, seen as important for achieving global climate targets, the report says.
Indeed, many developing country NDCs have components that are conditional on receiving finance, as well as technology transfer and capacity building. The SPM states with high confidence:
“Accelerated financial international cooperation is a critical enabler of a low-greenhouse gas and just transitions.”
It notes that scaled-up public grants for low-income and vulnerable regions, especially in sub-Saharan Africa, “would be cost-effective and have high social returns”. It emphasises the importance of meeting and going beyond the outstanding commitment by developed countries to provide $100bn per year in climate finance.
Confusion about how to define climate finance remains and the report says that shifting to a “grant equivalent” definition – now universally accepted for all other forms of international aid – “would resolve many uncertainties”.
There is also an acknowledgement that the Paris Agreement “widened the scope of all financial flows”, developing a “new narrative” that goes beyond climate finance and pushes all financial flows and sectors to align with its long-term goals.
The report notes that investors, central banks and financial regulators are increasingly aware of climate risks, but follows up by acknowledging that “despite these initiatives, climate-related financial risks remain greatly underestimated by financial institutions and markets limiting the capital reallocation needed for the low-carbon transition”.
It adds that while “stronger steering” by regulators and policymakers could close this gap, there is currently limited evidence that this attention has affected emissions cuts:
“This leaves high uncertainty, both near-term (2021-30) and longer-term (2021 50), on the feasibility of an alignment of financial flows with the Paris Agreement.”
In conclusion, the report finds that “there is sufficient global capital and liquidity to close investment gaps”, but barriers remain, including differences in risk perceptions, limited institutional capacities and the tendency for investors to exhibit a “home bias” and stick to their own countries.
15. What are the costs and benefits of efforts to cut emissions?
One of the SPM’s headline statements says – with medium confidence – that “the global economic benefit of limiting warming to 2C is reported to exceed the cost of mitigation in most of the assessed literature”.
A key reason that climate action is economically advantageous is because of the impacts on society that are avoided by slowing global warming. The “cross-working group box 1” in chapter 3 covers the economic benefits of these “avoided impacts” in more detail. The box says, with high confidence, that the WG2 report “finds that variation in estimated global economic impacts increases with warming in all methodologies, indicating higher risk in terms of economic impacts at higher temperatures”.
Similarly, there are various co-benefits from tackling climate change. For example, the authors say – with medium confidence – that “the economic benefits on human health from air quality improvement arising from mitigation action can be of the same order of magnitude as mitigation costs, and potentially even larger”.
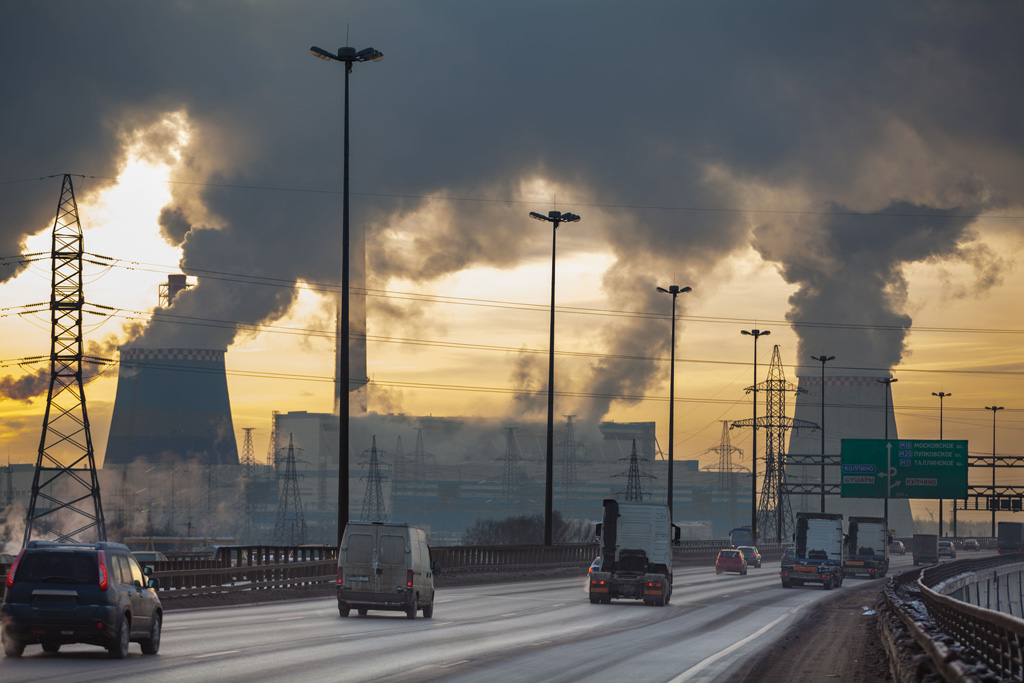
However, historically, assessments of mitigation costs have typically not included co-benefits and avoided impacts. Instead, they have tended to be treated separately, explains a recent Carbon Brief guest post by several IPCC WG3 authors:
“The omission of impacts from estimates of economic costs of mitigation reflects the historical structure of the IPCC and the climate change research community at large. What we stand to gain by limiting climate change (that is, ‘avoided impacts’) and the costs of mitigation have always featured in different IPCC working groups (WG2 and WG3, respectively).”
As a result, when researchers estimate the costs of climate mitigation against “reference scenarios” with no climate policy, they are comparing with scenarios that “do not account for the impacts that we would avoid if we tackle climate change”, the guest post authors note:
“In other words, the reference scenarios do not realistically represent the cost of doing nothing…If the reference scenario fails to include the cost of these climate impacts to the economy, then estimates of the cost of mitigation, in turn, do not capture the economic benefits of avoiding them.”
According to the new report, such studies indicate that – without taking into account co-benefits or avoided impacts – global GDP in 2050 on 1.5C pathways with no or limited overshoot would be around 2.6-4.2% lower than reference scenarios. For 2C, GDP would be 1.3-2.7% lower.
In the majority of these studies, “mitigation pathways do not represent an absolute decrease of economic activity level”, the authors note. In other words, these estimates are not suggesting that the global economy will not grow under a 1.5C or 2C pathway. Rather, they “give an indication on how economic activity slows relative to the reference scenario”.
And this slowing is small. Annualised over the whole century, it is equivalent to approximately 0.04% a year for 1.5C pathways with or without overshoot, the report says. For 2C pathways, it is 0.03% per year. And, of course, this is without accounting for co-benefits or avoided impacts.
The report also notes that “some studies find that mitigation increases the speed of economic growth compared to baseline scenarios”. These studies “assume that mitigation is undertaken in such a way that green investments do not crowd-out investment in other parts of the economy – and, therefore, offers an economic stimulus”.
For example, as the world recovers from the economic impact of the Covid-19 pandemic, estimates suggest that “a green investment push, would initially boost the economy while also reducing GHG emissions”, the report says.
Unsurprisingly, the report surmises – with high confidence – that limiting global warming “requires shifting energy investments away from fossil-fuels and towards low-carbon technologies”. The bulk of these investments are “needed in medium- and low-income regions”, it says.
In order to transform the electricity sector along a pathway with a one-in-two chance of holding warming to 1.5C with no or limited overshoot, for example, global investment needs are around $2.3tn per year over 2023-52. For a two-in-three chance of meeting the 2C limit, this drops to $1.7tn per year, the report says.
Fortunately, the “unit costs of several low-emission technologies have fallen continuously since 2010”, the report says with high confidence. For example:
“From 2010-2019, there have been sustained decreases in the unit costs of solar energy (85%), wind energy (55%), and lithium-ion batteries (85%), and large increases in their deployment.”
Researchers use integrated assessment models (IAMs) to develop scenarios to achieve emission reduction targets. These models include a carbon price – or a “marginal abatement cost of carbon” – associated with emissions in order to drive climate action. It is worth noting that a carbon price is used by IAMs as a proxy for the level of ambition in climate policy, rather than an assessment of the real-world carbon price needed to drive action or what mix of policies would be required to reach particular targets.
Estimates of the price “vary widely”, the report says, “depending on the modelling framework used and socioeconomic, technological and policy assumptions”.
For pathways with a two-in-three chance of meeting the 2C limit, the carbon price is around $90 per tonne of CO2 (tCO2) – with a range of $60-120 – in 2030 and $210tCO2 ($140-340) in 2050, the report says. For pathways with a one-in-two chance of holding warming to 1.5C with no or limited overshoot, the price is around $220tCO2 ($170-290) in 2030 and $630tCO2 ($430-990) in 2050.
In general, costs increase with the stringency of mitigation, the authors say, but “are reduced when energy demand is moderated through energy efficiency and lifestyle changes, when sustainable transport policies are implemented, and when international technology cooperation is fostered”.
In addition, pathways that avoid overshoot bring “long-term gains for the economy as well as earlier benefits in avoided climate change impacts”, the authors add with high confidence.
Nonetheless, large-scale mitigation efforts will result in significant economic upheaval, which will “vary widely across regions and households, depending on policy design and level of international cooperation”, the reports says with high confidence.
For example, there will be “substantial reallocations” in employment, with “job creation in some sectors and job losses in others”, the report says, although the impact is expected to be “relatively small” for employment levels as a whole.
The report also notes that quantifying the costs of mitigation purely in GDP or monetary terms can “undervalue the economic effects on households in poorer countries”. The actual effects “on welfare and well-being are comparatively larger”, it warns with high confidence:
“Mitigation at the speed and scale required to likely limit warming to 2C or below implies deep economic and structural changes, thereby raising multiple types of distributional concerns across regions, income classes and sectors.”
In terms of specific mitigation measures, chapter 12 of the report explains that costs for many technologies “will reduce as a result of technological learning”. (See: How much innovation and new technology is needed to hit climate goals?)
Drawing on the information presented in the previous chapters, the authors provide an overview of the net emissions reduction “potential” for different mitigation options in Table 12.3. This potential reflects the “quantity of net greenhouse gas emissions reductions that can be achieved by a given mitigation option relative to a specified reference scenario”, the report says.
The table, which spans seven pages, attempts to “take into account the average, implementation-weighted costs until 2030” for each option. The figures only factor in “monetary costs and benefits” and can be less than zero where a mitigation measure would be cheaper to implement than the high-emissions status quo, the report says:
“For wind energy, for example, this is the case if production costs are lower than those of the fossil alternatives.”
The chart below, from the SPM, illustrates the information in the table. The length of the bars indicates the mitigation potential of each option, while the colours show the breakdown of the cost categories, from less than $0 per tonne of CO2 – that is, a cheaper alternative – (blue) to $100-200 (red).
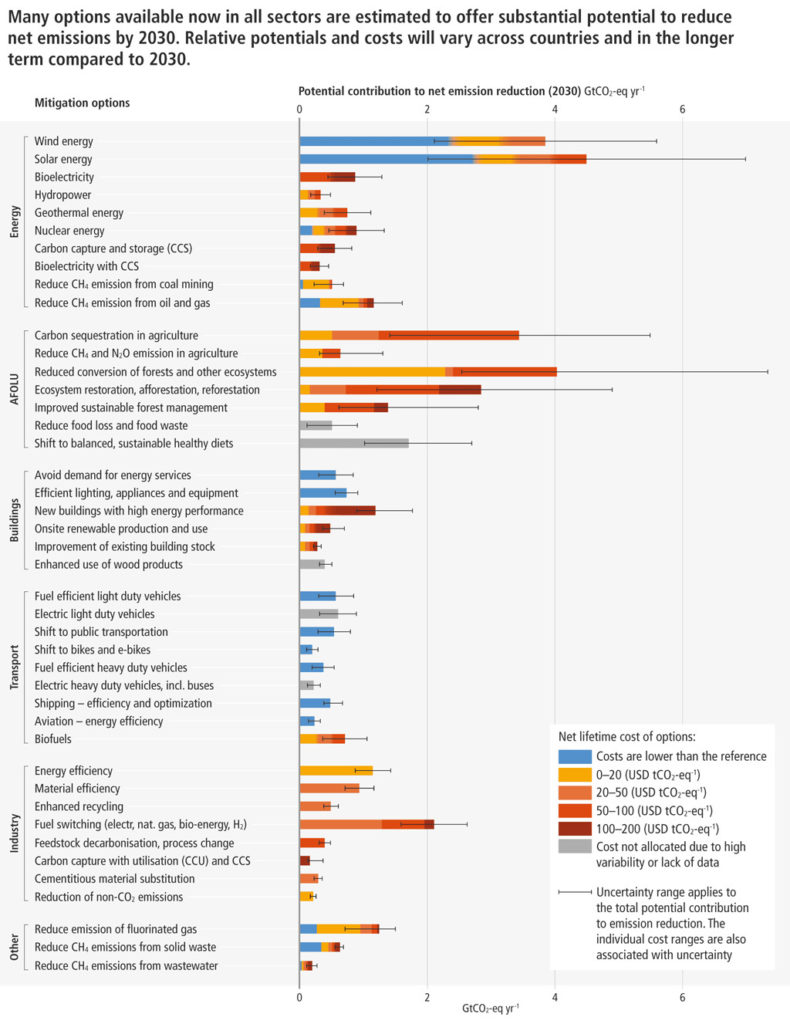
For example, the emissions reduction potential of wind energy is estimated to be 2.1-5.6GtCO2e in 2030, the report says, at a range of costs from an overall saving, up to $50 per tonne of CO2e avoided (/tCO2e). The equivalent for solar is 2.0-7.0GtCO2e in 2030, from an overall saving and up to a cost of $100/tCO2e. But, the report notes, the majority of studies suggest that both options would be cheaper than the high-emissions reference scenario:
“For onshore wind and utility scale solar energy, there is strong evidence that despite regional differences in resource potential and cost, a large part of the mitigation potential can be found in the negative cost category or at cost parity with fossil fuel based options. This is also the case for nuclear energy in some regions.”
In contrast, the highest mitigation costs are for CCS and “bioelectricity with CCS”, the report notes.
As well as energy, the table and chart include mitigation options for land, buildings, transport and industry. Many of them would save money – including efficient lighting and appliances in buildings, reducing methane emissions from coal mining and oil and gas operations, and the electrification of light and heavy duty vehicles.
The table also includes “cross-sectorial” options, such as reducing emissions of fluorinated gases and methane emissions from solid waste and wastewater. These, too, have the potential to save money, the table shows.
This last section also includes direct air capture and storage and enhanced weathering, which have a “very small” mitigation potential by 2030, the report says:
“There is potential in these categories, but given the current technology readiness levels, for 2030 the potential is limited. Also, it is not certain whether the costs will already drop below $200/tCO2e before 2030. In the longer term, much larger potentials are projected.”
Overall, the findings show that “there is a variety of options per sector” and that combinations of these options “show significant mitigation potential”, the authors say. There tends to be “few major options and a lot of smaller ones”, they add, but “more than half of the potential comes at costs below $20/tCO2e.
The SPM concludes, with high confidence, that “mitigation options costing $100/tCO2e or less could reduce global GHG emissions by at least half the 2019 level by 2030”.
16. How much innovation and new technology is needed to hit climate goals?
The WG3 report is the first to include a chapter on innovation, technology development and transfer. The report says that innovation can “leverage action to mitigate climate change by reinforcing other interventions” and can “support system transitions to limit warming and help shift development pathways”.
The report defines three key phases of the innovation cycle.
The first phase – research and development (R&D) – involves basic research and technological development to acquire new knowledge, the report says. It notes that the R&D phase is often looking for new solutions to increase the efficiency of existing production methods, or could result in entirely new methods, products or services.
This first phase can be incremental and its outcomes are often uncertain, the report says. It adds that in this phase, public research funding plays a “crucial role”.
The report defines the second stage as “demonstration” – in which pilot projects or large-scale testing are carried out.
The final stage – “deployment and diffusion” – involves producing the technology at a large scale and scaling up its adoption. The report says that “in the context of climate change mitigation and adaptation technologies, the purposeful diffusion to developing countries is referred to as technology transfer”.
The SPM says that “the unit costs of several low-emission technologies have fallen continuously since 2010”.
The figure below shows global average changes in the cost and adoption of photovoltaics (PV), onshore wind, offshore wind, concentrating solar power (CSP), and batteries and electric vehicles. The vertical dashed lines indicate when the AR5 report was published.
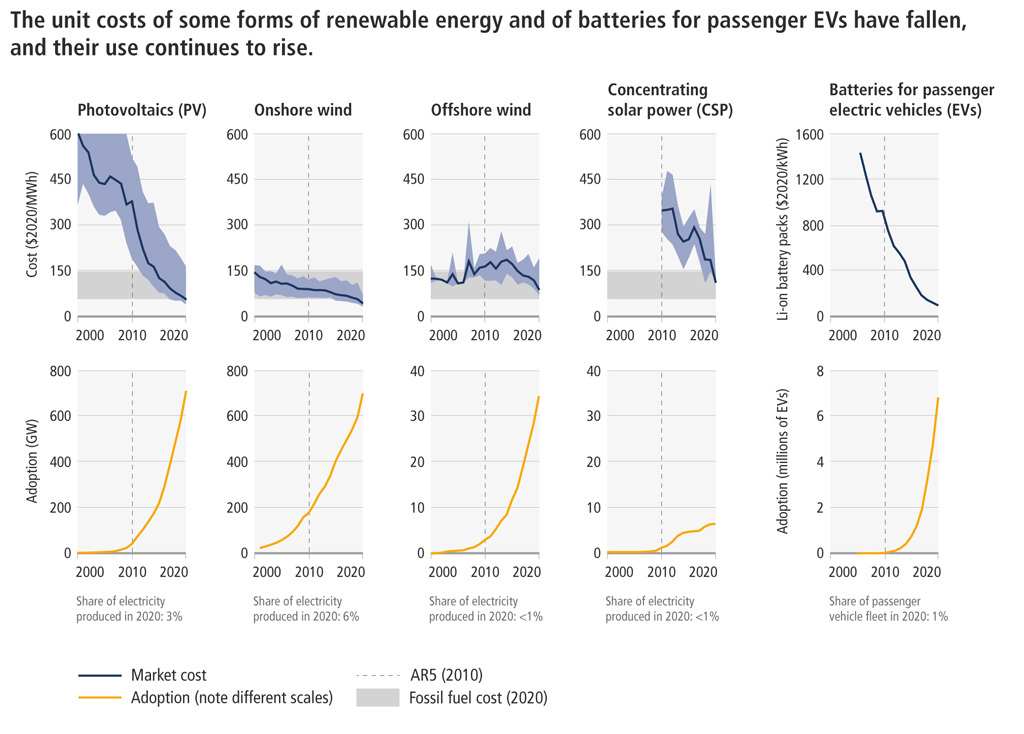
The figure shows that, generally, renewable energy costs have fallen, while adoption has increased. For example, it says that since 2010, the global average cost of solar energy, wind energy and lithium ion batteries has decreased by 85%, 55% and 85%, respectively.
The report says that since AR5, PV has become “a substantial global industry”. The cost of PV solar modules has dropped by a factor of 10,000 since they were first commercialised in 1957 – and prices in 2020 were “below where even the most optimistic experts expected they would be in 2030”.
The report has high confidence that the currently widespread implementation of solar PV “could not have happened without technological innovation”. It also stresses the importance of international collaboration in the development of solar technologies:
“No single country persisted in developing solar PV. Five countries each made a distinct contribution. Each leader relinquished its lead. The free flow of ideas, people, machines, finance and products across countries explains the success of PV. Barriers to knowledge flow delay innovation.”
The figure below shows key milestones in the development of low-cost PV, where each point on the graph indicates a “key milestone” and indicates which country was responsible. The y axis is logarithmic and shows the cost of solar PV per unit of electricity generated.
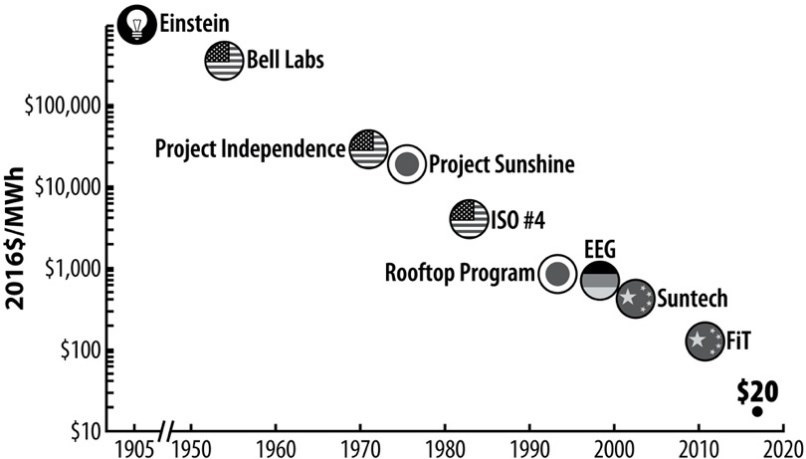
“Solar followed an overlapping but sequential process of technology creation, market creation and cost reductions”, the report says.
However, it took 60 years for solar to become cheap enough for widespread adoption – which the report says is “too slow for addressing climate change if a technology is now still at the lab scale”. As such, it says that we need to learn from the solar model and use public policy to speed up innovation over much shorter time frames, such as 15 years or less.
Innovation in energy technologies is a “key driver” of emissions reductions in model-based scenarios of future emissions, such as IAMs, the report says.
For example, to limit warming to 2C above preindustrial levels, the report says that solar capacity will need to increase by a factor of 15 by 2050 compared to 2020. Meanwhile, a 10-fold increase in wind and 87% phase-out of coal are needed, it adds.
According to the report, many studies suggest that “transformational changes” would be required in many areas of society to limit warming to 2C or below. It outlines the key stages in undertaking such a socio-technical transition:
- Emergence – marked by experimentation and innovation in the laboratory and demonstration in the field.
- Early adoption – when successful technologies jump from the laboratory to limited commercial application.
- Diffusion – when niche technologies become mainstream. This stage is marked by changes to the socio-technical “regime”, including infrastructure networks, value chains, user practices and institutions. It is “often the most visible and turbulent” stage of the process.
- Stabilisation – when the new technologies, systems and behaviours are “standardised and insulated from rebound effects and backsliding”.
However, the report says that this level of technological change “never happens in a vacuum” and “typically goes hand-in-hand with shifts in knowledge, behaviour, institutions and markets”. “Stickiness” in these areas can keep society “locked in” to existing technologies, it adds.
The report also notes that innovation “has also led to, and exacerbated, trade-offs in relation to sustainable development” – such as greater environmental pollution and social inequalities.
For example, the report highlights that digitalisation – which the SPM calls “one of several cross-cutting technological developments that are fundamentally changing economies and societies” – has mixed impacts:
“An area where sustainable development, climate change mitigation and technological change interact is digitalisation. Digital technologies can promote large increases in energy efficiency through coordination and an economic shift to services, but they can also greatly increase energy demand because of the energy used in digital devices. System level rebound effects may also occur.”
Meanwhile, the SPM has high confidence that “adoption of low-carbon technologies lags in developing countries, particularly least developed ones, due in part to weaker innovation systems and adoption capacities”.
The report says that “effective governance and policy has the potential to avoid and minimise such misalignments”. It adds that international cooperation on technology development and transfer can help developing countries to achieve their climate goals more effectively, and often helps to address their sustainable development goals.
17. Will meeting climate goals help or hinder sustainable development?
The UN launched its sustainable development goals (SDGs) in 2015, the same year that the Paris Agreement was signed. These 17 goals are designed to act as a “blueprint to achieve a better and more sustainable future for all” and are meant to be achieved by 2030. They cover a range of topics, including poverty, energy access, hunger, inequality and biodiversity loss.
One of the goals explicitly calls for “urgent action to combat climate change and its impacts”, but many others intersect with climate action. AR6 lays out several ways in which the SDGs can be achieved at the same time as climate mitigation and adaptation – but also warns of areas where trade-offs mean that policies will need to be carefully designed in order to avoid negative impacts on either development or climate change.
The report states with high confidence that mitigating climate change “is a necessary part of sustainable development”, but adds that “holistic policymaking” must be used to “integrat[e]” mitigation targets with those policies addressing sustainable development. It also notes that many of the integrated assessment models (IAMs) used to study the impacts of climate policies “do not have a comprehensive coverage” of the SDGs.
Climate change, the report states, “is the result of decades of unsustainable production and consumption patterns” and there is “compelling evidence” that current development trajectories make it “unlikely” that the world will be able to rapidly reduce emissions. However, it adds, these pathways “also determine the set of tools available” for mitigation.
Sustainable development, in particular, “offers a comprehensive pathway” towards “ambitious” climate change action. There is high confidence that countries have “different needs” for sustainable development as a result of many factors, including their resources, history and political conditions.
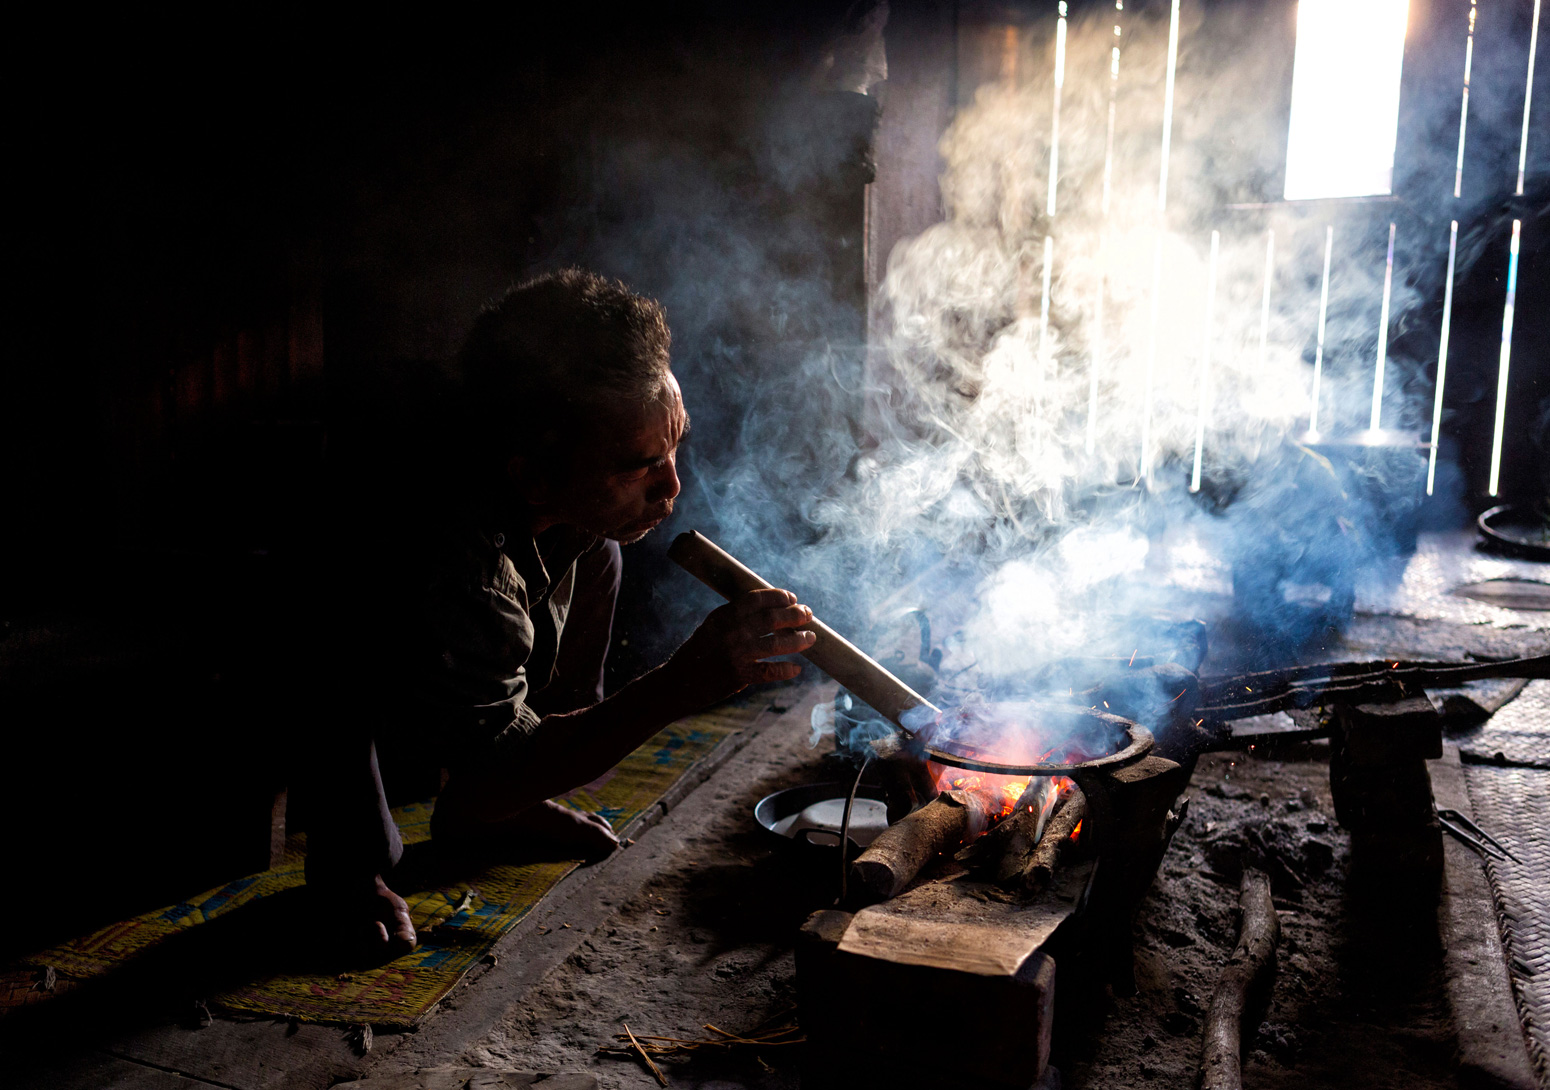
But many countries do not directly address the SDGs alongside climate policies. The report notes that “very few” NDCs contain “any reference” to the goals, although progress would be made towards some of them “as a side benefit of the climate policy targets”.
Several of the SDGs focus on poverty, inequality and the issues that stem from them. Because the burden of climate change impacts “fall[s] more heavily” on lower-income countries and communities than their more affluent counterparts, climate mitigation action “reduces inequalities and poverty”, the report says. It adds that “a strong link” connects sustainable development, vulnerability to climate change and climate risks.
The top 10% earning households globally are responsible for 34-45% of consumption-based emissions, while the bottom half of households contribute only 13-15% of global emissions.
Although higher incomes are associated with higher emissions, the “absolute effect of economic inequality reduction on emissions remains moderate”.
The report notes with medium confidence that higher inequality within a country can negatively impact both high- and low-income populations’ willingness to accept environmental-protection policies or adopt mitigation-friendly lifestyles.
The figure below shows the relationship between the human development index and per-capita GHG emissions. Countries and regions are highlighted on the figure with different coloured circles; the area in green marks the parameters of sustainable development.
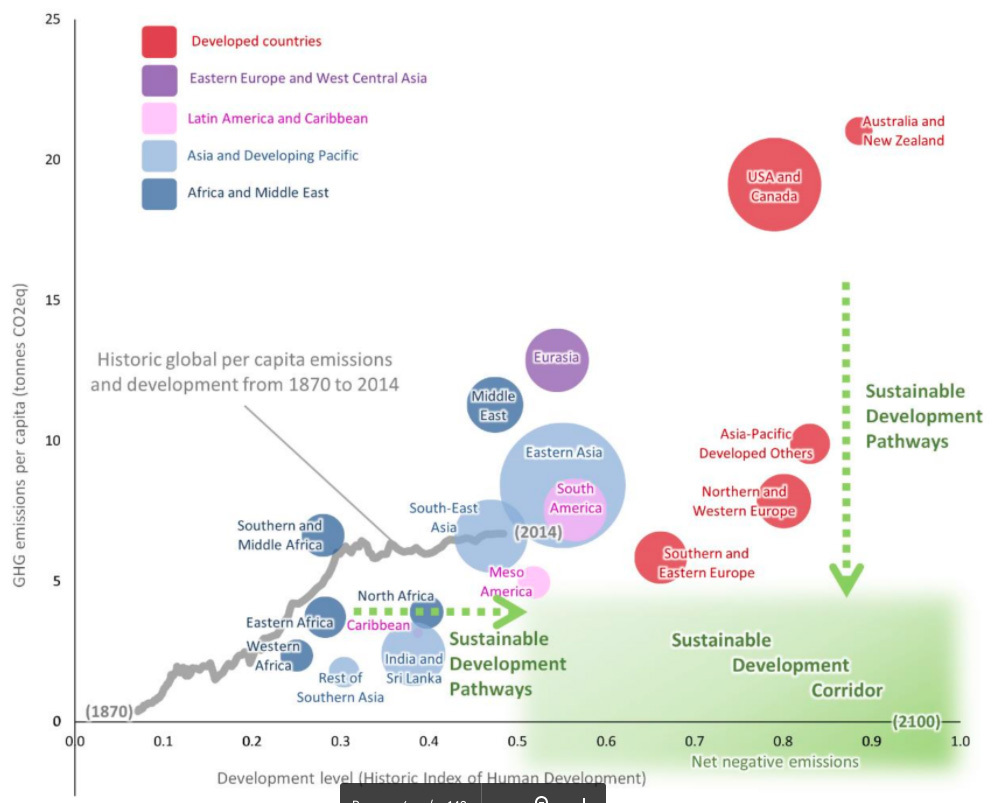
Currently, more than 1 billion people worldwide do not have access to electricity. There is high confidence that “eradicating extreme poverty, energy poverty and providing decent living standards…can be achieved without significant global emissions growth”.
Achieving universal energy access at the same time as strong mitigation “can be achieved” through a combination of increased energy efficiency and “rapid social transformations”.
The report adds that the electricity required for “basic residential energy services” will be much smaller than the energy needed to “meet the basic cooling requirement in [the] Global South”, especially as temperatures continue to rise.
In addition, the report notes that many low-income countries “remain dependent on fossil fuels for their energy and exports and jobs”. Although “there is substantial evidence” that a sustainable pathway would result in a net gain of productive jobs, “these impacts will often not directly replace or offset activities in areas that have been heavily dependent on the fossil-fuel industry”.
The report states that while “desirable and technically feasible”, a transition away from fossil fuels is “still largely constrained” by existing infrastructure and investments.
There are “high expectations” for land to contribute to climate mitigation, including through afforestation and the growth of bioenergy crops. At the same time, “the pressures on land have grown” as a result of growing populations, changing diets and deforestation.
As a result, many climate policies in the AFOLU sectors “simultaneously generate impacts on mitigation, adaptation and the SDGs”. There is high confidence that stringent mitigation policies that are heavily reliant on land can “negatively affect” food security by driving up land and food prices, increasing the risk of hunger.
However, there is also high confidence that mitigation can lessen food insecurity by alleviating some of the negative impacts of climate change on agriculture, such as a loss of crop productivity.
In addition, the increased use of land – for either climate mitigation or for agricultural cultivation – can be at odds with the goals of addressing biodiversity loss and ecosystem preservation. The report notes that moving to more sustainable forms of agriculture is an “additional solution” that can address climate, social and biodiversity concerns.
The report states that “accelerated and equitable climate action” is “critical to sustainable development”. Mitigation will also be “beneficial” for human health – both in the long-term benefits of alleviating climate impacts, but also on shorter timescales. The report states that the benefits of “improved air quality alone” may “exceed the costs” of achieving the Paris Agreement’s targets.
The pathway to 1.5C “could result” in more than 150 million (with a range of ± 43 million) fewer premature deaths between now and 2100 as compared to a “business-as-usual scenario”. The report attributes this reduction largely to reduced exposure to particulate matter and to investment in basic infrastructure such as sanitation, affordable and healthy diets and clean water access.
The figure below shows the effects of mitigation policies on several of the SDGs, emphasising that although these aims can be in conflict, they do not have to be. The red boxes represent a reference scenario, the blue boxes represent mitigation measures compatible with reaching 1.5C and the cyan diamonds are policies that integrate mitigation with achieving the SDGs.
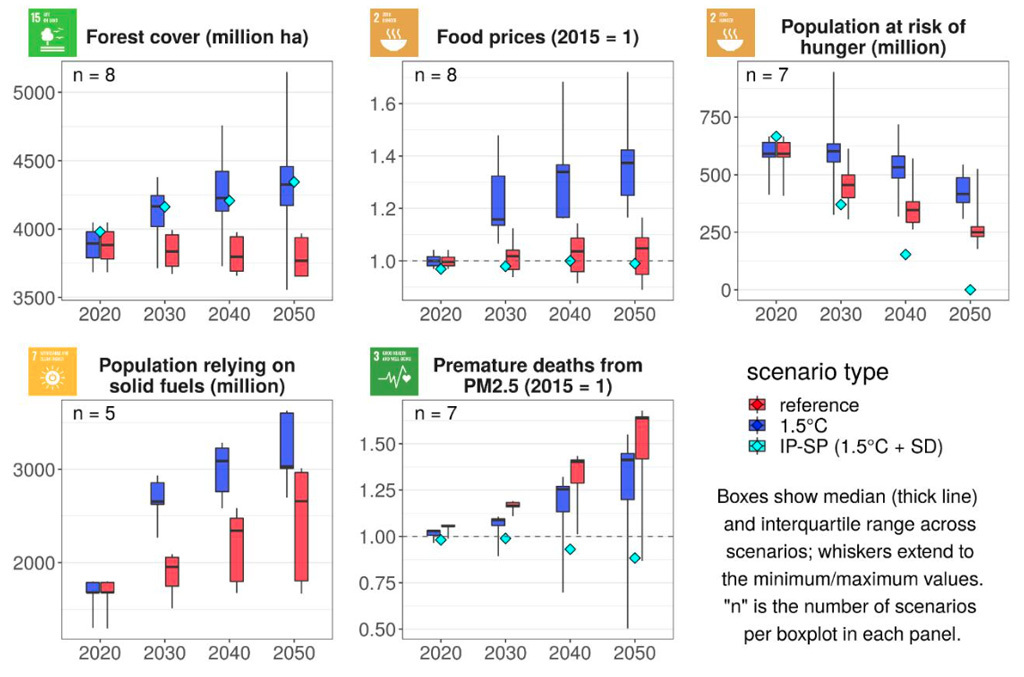
A “just transition” – securing livelihoods and addressing inequalities while moving towards a low-carbon future – will be “essential to reducing climate risks and addressing sustainable development priorities”, the report states.
It adds that a just transition requires not just rapid change, but also “removing the underlying drivers of vulnerability and high emissions” and taking into consideration the interests of different communities and cultures. Furthermore, the transition must not “perpetuate asymmetries between richer and poorer states and people”, nor “replace old forms of injustice with new ones”.
Individual actions towards climate mitigation are “necessary but insufficient” to produce a just transition. Instead, a transition “requires” overcoming current trajectories and fossil-fuel dependence, as well as resistance from “industries and actors that are benefiting from the current system”. The report notes that these industries “leverage their resources and positions to undermine transitions”.
There is high confidence that climate finance from richer countries “is likely to be a key to a successful low-carbon transition globally”. The report calls for focus on climate finance at all levels: to address global inequity, to target national-level policies and to support local communities.
-
In-depth Q&A: The IPCC’s sixth assessment on how to tackle climate change