As the year draws to a close, Carbon Brief takes a look at 2017’s top climate and energy stories through the medium of numbers…
49 countries
For CO2 emissions to fall, they first have to peak. And research published this year suggests that this is already happening.
The report, produced by the US-based World Resources Institute (WRI), suggests that 49 countries – which include the UK, US, Australia, Brazil and Canada – have seen their emissions peak, representing around 36% of current global emissions.
Carbon Brief created an interactive chart of WRI’s data as part of our coverage.
Analysis: @WorldResources data suggests emissions have already ‘peaked’ in 49 countries | @hausfath @_rospearce https://t.co/tIl2AmXbK0 pic.twitter.com/bGNcz1NrCc
— Carbon Brief (@CarbonBrief) November 29, 2017
But how much time does the world collectively have left to reduce its emissions in order to avoid dangerous climate change?
At the beginning of the year, Carbon Brief published our traditional carbon budget update, revealing that just four years of current CO2 emissions would blow what’s left of the budget for a good chance of keeping global temperature rise to 1.5C.
However, in September, a new study published in Nature Geoscience proposed that there might be a little more breathing space to meet the 1.5C limit than previously thought.
As lead author Dr Richard Millar explained in a guest post, the study estimates the remaining 1.5C carbon budget from today onwards. This contrasts to previous methods which have been based on cumulative emissions to date. As a result, Millar’s study put the remaining 1.5C budget at around 20 years of current emissions.
The paper caused quite a stir, with parts of the media claiming that climate models – the basis for carbon budget estimates – are “wrong” and have overstated the observed warming of the planet.
Carbon Brief factchecked these claims, showing that the model-observation comparisons in the study depend greatly on the dataset and model outputs used by the authors.
The authors also published their own response with Carbon Brief, pointing out that they “present no evidence in our paper to suggest that future CO2-induced warming under any emissions scenario will be lower than the projections given in AR5 [the Intergovernmental Panel on Climate Change’s fifth assessment report]”.
425m tonnes
The world’s tropical forests can no longer be considered a carbon sink. In fact, a global rise in deforestation and land degradation has caused tropical forests to become a net emitter of carbon, a study found. It concluded that the world’s rainforests had a net loss of around 425m tonnes of carbon from 2003 to 2014.
In other news, scientists were also forced to reconsider the role that livestock play in global emissions. In September, a study found that recent methane emissions from livestock were 11% higher than previous estimates suggested.
However, this recalculation is unlikely to seriously dent efforts to meet the climate goals of the Paris Agreement, Carbon Brief analysis revealed. It found that revised methane emissions could have decreased the remaining carbon budget for limiting warming to 1.5C by 1-2%.
2nd (or 3rd) warmest year
Despite the lack of an El Nino event to drive up global temperatures, 2017 is still shaping up to be either the second or third warmest year on record, depending on the organisation measuring temperatures. This year now seems certain to be the warmest non-El Nino year recorded.
The temperatures in 2017 are in-line with what climate models have projected and show continued rapid warming since the 1970s. This is true both in raw and adjusted temperature records, as adjustments have little impact in recent years and actually reduce long-term global warming.
This year, Remote Sensing Systems (RSS), one of the two main satellite records that estimate the temperature of the lower atmosphere, released a major update that was corrected due to decaying satellites orbits. This update increased the warming shown by RSS since 1998 by 140%, meaning it now matches land-based records.
Volcanoes are one of the many factors that affect global temperatures. While the Mount Agung volcano in Indonesia has had a number of small eruptions over the past two months, Carbon Brief analysis showed that a major eruption there could lower global temperatures by around 0.2C. This cooling would prove temporary, however, with the effect only lasting a couple of years.
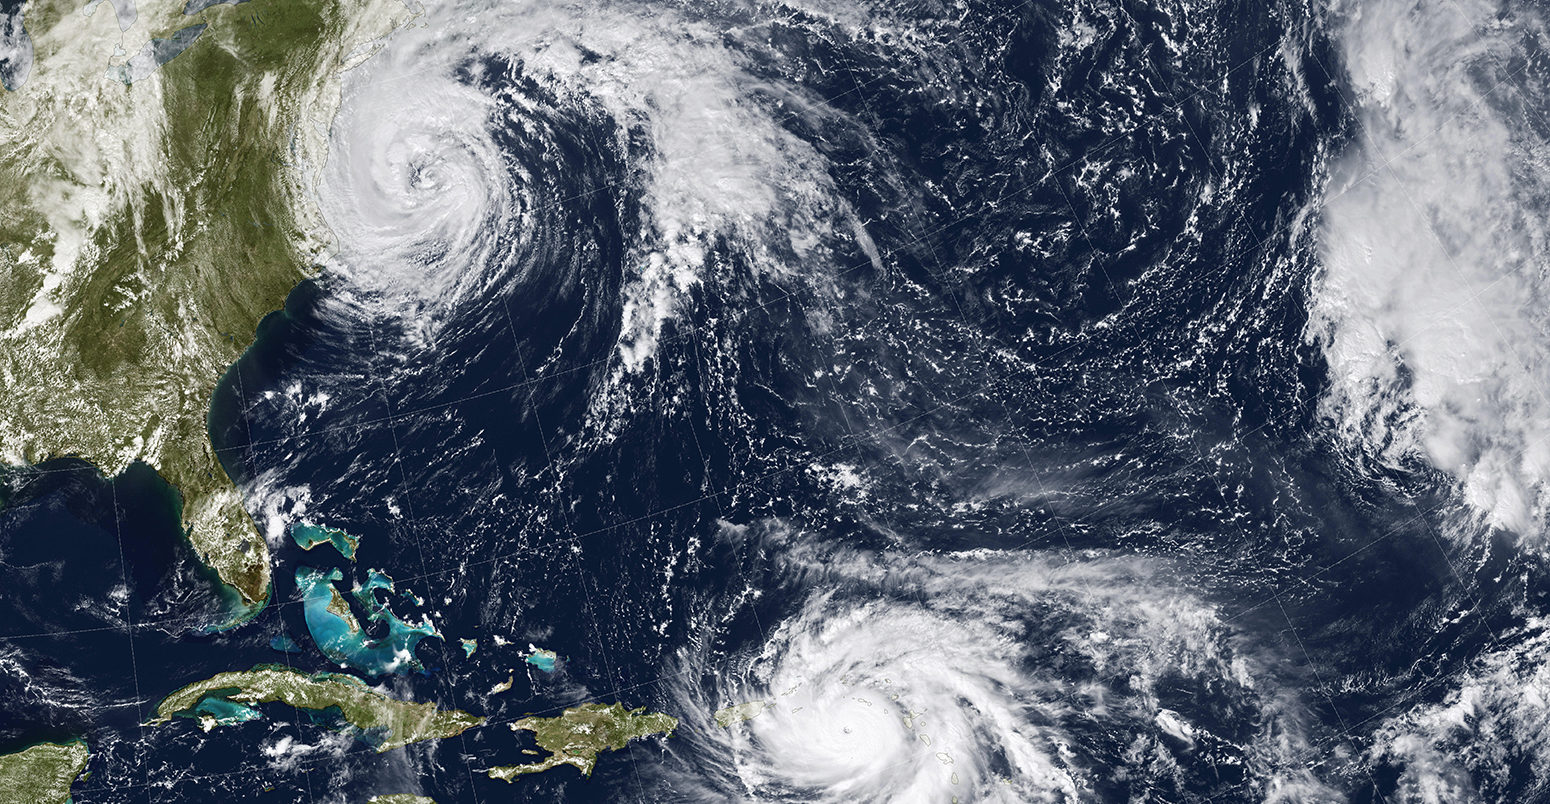
This has also been a year of notable extreme weather events, with climate change playing a role in helping to strengthen the major hurricanes that hit the US and Caribbean. Carbon Brief mapped studies of extreme weather events around the world and found that 63% of those studied were made more likely or more severe by human-caused climate change.
21 April
Despite a year of major coal-related developments, burning the black stuff remains the biggest barrier to meeting international climate goals.
Some of the most dramatic events took place in the crucible of the industrial revolution, the UK, which went without coal power for the first time since the Victorian era on 21 April.
Data published in July showed the UK’s coal use had already halved during 2016. As Carbon Brief analysis revealed in January, coal had generated less electricity in the UK than wind.
In November, the UK also helped launch the “Powering Past Coal Alliance” of more than 20 countries pledging to phase out the fuel. Still, this year’s global picture for coal has been more nuanced, with stalled demand in China and increases in India.
If the latest outlook from the International Energy Agency (IEA) is right – and its earlier forecasts have not fared well – then India will drive rising global coal demand over the next five years.
Forecasts for global coal demand, made by the IEA in 2011 through 2017 (blue lines), compared to data on actual use (red), in millions of tonnes of coal equivalent. Note the y-axis is truncated. Source: Carbon Brief analysis of IEA coal market reports. Chart by Carbon Brief using Highcharts.The outlook for coal is slowing, however, with coal power investments having already peaked. This year, for the first time, oil major BP forecast a peak in global coal use in the early 2030s.
In November, the IEA said cheap renewables will drive an inexorable shift from coal. It also scotched the idea that only coal can bring electricity to the world’s poor, saying renewables will bring more people access to power.
165 pages
Climate policy wonks in the UK spent most of 2017 waiting for the government’s Clean Growth Strategy. This was supposed to bridge the gap to meeting the UK’s legally binding carbon targets. When it arrived in early October, however, the quantified bits of the 165-page plan left the UK significantly off track.
Annual emissions during the UK’s first five carbon budgets (millions of tonnes of CO2 equivalent). The annual average emissions cap is shown in black, along with projections under existing policies (dashed blue line) and with the quantified policies of the Clean Growth Strategy (red line). Source: BEIS Clean Growth Strategy. Chart by Carbon Brief using Highcharts.While the UK power sector continues to cut its emissions, figures published in July showed progress on energy efficiency, heat and transport is stalling.
Meanwhile, chancellor Philip Hammond had two chances to contribute to the climate agenda with a Spring Budget, delivered in March, and an Autumn Budget in November. Instead, he announced more tax relief for the North Sea oil and gas sector – which Carbon Brief had revealed in April to have recently become a net drain on the public finances.
The Autumn Budget put a freeze on further subsidies for low-carbon electricity, even after the latest auction in September showed offshore wind will soon be cheaper than new gas-fired power. (In October, innovative floating offshore wind turbines began generating power off Peterhead on Scotland’s east coast).
Another much-anticipated report was Dieter Helm’s review of the cost of energy in the UK. However, since it was published in October, it has been kicked into the long grass.
8 June
Prime Minister Theresa May’s ill-fated attempt to gain a larger majority midway through the year meant British voters headed to the polls on 8 June, just two years after the UK’s last general election. As the parties launched their manifestos, Carbon Brief kept track of their climate change and energy policy offerings in our election grid.
Carbon Brief also produced manifesto grids which summarised the energy and climate policies being pledged in the elections in France and Germany. (A survey released earlier this month showed people living in Germany are among the most concerned in Europe about climate change.)
Meanwhile, Emmanuel Macron, winner of France’s presidential election, has been hard at work carving out a climate leadership niche for himself. As well as hosting the One Planet summit earlier this month, Macron was among those pushing to underpin the reformed EU Emissions Trading System (ETS) with a minimum “floor price” for carbon emissions.
19,109 participants
According to the UNFCCC’s official participant list, more than 19,000 negotiators, policymakers, researchers, journalists and campaigners gathered in Bonn, Germany, last month for the annual UN climate conference.
Analysis of the list by Carbon Brief revealed which country sent the most delegates (Côte d’Ivoire led the way, with 492 participants) and what the gender balance of the conference looked like (62% male).
This year’s summit was a relatively technical affair which aimed to smooth out agreement on several topics ahead of some significant deadlines in 2018. Key outcomes from the talks included a text on the final “approach” of the 2018 Talanoa dialogue, which aims to help raise ambition on national climate pledges, and a recognition that more focus is needed on “pre-2020 action”.
Carbon Brief’s coverage of COP23 also included a video summary of three need-to-know outcomes from the talks, as well as another video asking participants whether they think Donald Trump’s presidency has now made limiting global warming to 1.5C impossible. (Spoiler alert: they said a firm “no”.)
$2.78bn
Eight years ago at COP15 in Copenhagen, developed nations promised to “mobilise” $100bn a year from 2020 onwards to help developing countries tackle climate change. An important contribution will come via the four main multilateral climate funds.
This year, Carbon Brief published analysis which showed, via an interactive map, that these four funds between them have pledged $2.78bn in support for more than 1,000 projects across the developing world since 2009.
Our analysis also found that, from 2013-2016, India received the highest level of single-country funding ($725m) approved by the funds in absolute terms. This was followed by Ukraine ($278m) and Chile ($262m). However, the picture was very different when viewed on a per-capita basis, with India plummeting down the rankings and Tuvalu coming out top with $3,947 per person.
In a separate article, published in October, Carbon Brief focused in on how the UK spends its foreign aid budget on tackling climate change around the world. Using freedom-of-information requests, Carbon Brief revealed that the government has committed “climate-specific” aid to 284 projects. Our analysis found that Ethiopia has received the most single-country funding since 2011 (£139.7m).
Mapped: How UK foreign aid is spent on climate change | @LeoHickman @_rospearce https://t.co/Ti5wXkAQof pic.twitter.com/JLffSKvhY2
— Carbon Brief (@CarbonBrief) October 19, 2017
14% reduction in US emissions
When assessing US efforts to reduce emissions, it’s hard to look past Donald Trump’s allergic reaction to any action on climate change. After all, he confirmed in July that he intends to withdraw the US from the Paris Agreement.
However, US CO2 emissions have actually declined 14% from their 2005 peak. Carbon Brief analysis examined the causes for this fall and found it has been driven by a large-scale transition from coal to gas for electricity generation, growth in wind and solar, reduced energy use in buildings and industry, more fuel-efficient vehicles, fewer miles driven, and other factors.
Separately, Carbon Brief produced an interactive map showing how the US generates electricity. The underlying analysis revealed that the average coal plant in the US is 40 years old and since 2010 more than half of US coal units have either shut down or have a planned retirement in the near future. Almost all new capacity under development in the US is either gas, wind or solar. While gas has been a big factor in displacing coal in the US, a guest post for Carbon Brief argued it might provide much less of a climate benefit in the UK.
Mapped: How the US generates electricity | @DrSimEvans @_rospearce https://t.co/vcjEEnDoYT pic.twitter.com/JX8R1OVuDw
— Carbon Brief (@CarbonBrief) December 16, 2017
While federal action on climate has stalled under the Trump administration, many states and localities are enacting policies to reduce emissions. US states can directly control almost all carbon emissions within their borders, even in the absence of action by the federal government. While not all states are pursuing climate policies, Carbon Brief analysis showed that those concerned about the potential high cost of climate change represent 40% of total US emissions.
1% of emissions
Geoengineering received a lot of attention in 2017. This controversial field of research generally divides into two categories: CO2 removal (CDR, also known as “negative emissions”); and solar radiation management (SRM).
This year brought us the first commercial “direct air capture” plant, a negative emissions technology that involves sucking CO2 directly out of the air.
In June, Carbon Brief travelled to the opening of the plant, built outside Zurich by Swiss firm Climeworks. There we interviewed co-founder Christoph Gebald, who told us that the company aims to be capturing 1% of global CO2 emissions each year by 2025.
Such is the level of interest in the potential for negative emissions, the UK this year launched the world’s first research programme into the subject. Coordinated by the National Environment Research Council, the programme will allocate £8.6m of public money to projects that explore the real-world potential of different technologies.
Geoengineering was also the topic of an international conference in Potsdam in October. Carbon Brief was there to report all the discussions, which included the announcement of the world’s largest outdoor SRM experiment – slated for launch in the US next autumn.
Research published this year also highlighted some of the potential pitfalls of unregulated SRM. The study, published in Nature Communications, warned that “stratospheric aerosol injection” used in one part of the world could contribute to droughts and hurricanes in others.
35m
This is how many electric vehicles (EVs) the National Grid says could be on the UK’s roads by 2050. Given that the global number of EVs only passed the 1m mark last year, there has been much media talk this year about whether the grid will be able to cope with this resulting surge in demand for power.
The problem is that – as analysis by Cambridge Econometric showed – much of the resulting debate has been wildly speculative, misinformed, or a heady combination of both. This year, Carbon Brief was forced to publish two factchecks rebutting hyperbolic claims about the “burden” EVs will place on the UK’s grid.
One particularly popular claim was that EVs would mean the UK “will need [insert any number] new Hinkley Points”. The problem was that it ignored key caveats, as our article pointed out. Then there was the claim that it might not be possible to boil a kettle whilst charging an EV. Simply not true, as we explained.
Elsewhere, we published media factchecks about stranded whales and wind farms, the Grenfell Tower fire and “duped world leaders”.
Two months
The amount of time that had passed since Brian Deese had left the White House before he granted his first in-depth interview.
Deese, who had served as Barack Obama’s senior advisor on climate change, energy and conservation from January 2015 to January 2017, spoke to Carbon Brief about a wide range of issues. We transcribed the conversation in full, as we always do for all our big interviews. And, yes, Donald Trump came up once or twice.
But Deese was not the only person we interviewed this year. Dr Katharine Hayhoe proved herself to be one of the world’s most compelling communicators on climate change. At COP23, we spoke to Dr Bill Hare, who has experienced the UN climate talks as a scientist, negotiator and campaigner. Other interviewees included climate lawyer Prof Michael Gerrard, UK shadow minister for international climate change Barry Gardiner, veteran energy analyst Amory Lovins and the World Coal Association’s Benjamin Sporton.
36 years ago
And, finally, if you’ve reached this far then you deserve one more bonus number as a reward.
As we explained in May, almost four decades have now passed since ITV became the first broadcaster in the world to air a documentary dedicated solely to the topic of human-caused climate change.
The hour-long programme was called “Warming Warning” and shown after the 10 o’clock news on the evening of Tuesday, 8 December 1981. The documentary, which was made by the now-defunct Thames Television, had sat in the archives largely unseen ever since. But Carbon Brief tracked down the copyright holder and persuaded it to upload a series of clips onto Youtube.
As we wrote: “The clips provide a poignant, historical insight into what scientists knew about climate change almost four decades ago – and how the world was beginning to react in terms of the resulting geopolitical, technological and societal ramifications. Many of themes still resonate strongly today.”