State of the climate: How the world warmed in 2022
Zeke Hausfather
01.18.23Zeke Hausfather
18.01.2023 | 3:00pmWith a new year underway, most of the climate data for the whole of 2022 is now available. And this data shows that last year set new records for individual locations as well as the world as a whole.
Here, Carbon Brief examines the latest data across the oceans, atmosphere, cryosphere and surface temperature of the planet (see the links below to navigate between sections). This 2022 review reveals:
- Ocean heat content: It was the warmest year on record for ocean heat content, which increased notably between 2021 and 2022.
- Surface temperature: It was between the fifth and sixth warmest year on record for surface temperature for the world as a whole, at between 1.1C and 1.3C above pre-industrial levels across different temperature datasets. The last eight years have been the eight warmest years since records began in the mid-1800s.
- A persistent triple-dip La Niña: The year ended up cooler than it would otherwise be due to persistent La Niña conditions in the tropical Pacific. Carbon Brief finds that 2022 would have been the second warmest year on record after 2020 in the absence of short-term variability from El Niño and La Niña events.
- Warming over land: It was the warmest year on record in 28 countries – including China, France, Germany, Ireland, Italy, New Zealand, Portugal, Spain and the Uk – and in areas where 850 million people live.
- Extreme weather: 2022 saw extreme heatwaves over Europe, China, India, Pakistan and South America, as well as catastrophic flooding in Pakistan, Brazil, West Africa and South Africa. Climate change played a clear role in increasing the severity of all of these events.
- Comparison with climate model data: Observations for 2022 are close to the central estimate of climate models featured in the IPCC fifth assessment report.
- Warming of the atmosphere: It was the seventh or eighth warmest year in the lower troposphere – the lowest part of the atmosphere – depending on which dataset is used. The stratosphere – in the upper atmosphere – is cooling, due in part to heat trapped in the lower atmosphere by greenhouse gases.
- Sea level rise: Sea levels reached new record-highs, with notable acceleration over the past three decades.
- Greenhouse gases: Concentrations reached record levels for CO2, methane and nitrous oxide.
- Sea ice extent: Arctic sea ice saw its 10th lowest minimum extent on record, and was generally at the low end of the historical range for the year. Antarctic sea ice saw a new record low extent for much of 2022.
- Looking ahead to 2022: Carbon Brief predicts that global average surface temperatures in 2023 are most likely to be slightly warmer than 2022, but are unlikely to set a new all-time record given lingering La Niña conditions in the first half of the year.
Record ocean heat content
Last year was the warmest on record for the heat content of the world’s oceans. Ocean heat content (OHC) has increased by around 428 zettajoules – a billion trillion joules – since the 1940s. The heat increase in 2022 alone compared to 2021 – about 11 zettajoules – is around 19 times as much as the total energy produced by all human activities on Earth in 2020 (the latest year in which global primary energy statistics are available).
Human-emitted greenhouse gases trap extra heat in the atmosphere. While some of this warms the Earth’s surface, the vast majority – around of 93% – goes into the oceans. About two thirds of this accumulates in the top 700 metres, but some also ends up in the deep oceans. Annual OHC estimates between 1950 and present for both the upper 700 metres (light blue shading) and 700-2000 metre )dark blue) depths of the ocean are shown in the figure below.
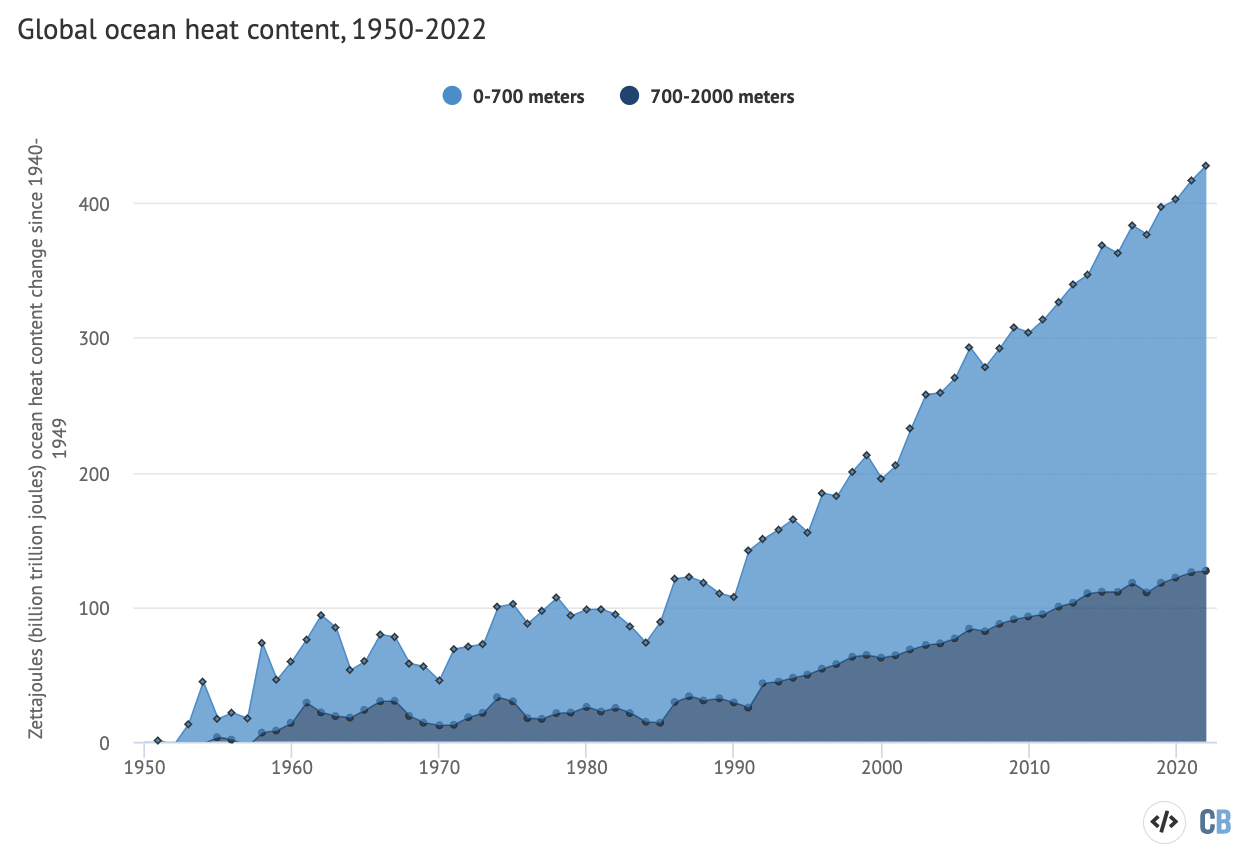
In many ways, OHC represents a much better measure of climate change than global average surface temperatures. It is where most of the extra heat ends up and is much less variable on a year-to-year basis than surface temperatures.
Changes in the amount or rate of warming are much easier to detect in the OHC record than on the surface. For example, OHC shows little evidence of slowing down over the past eight years, despite a growing focus by climate sceptics on global surface temperature trends over that period. It also shows a distinct acceleration after 1991, matching the increased rate of greenhouse gas emissions over the past few decades.
Just about every year since 1991 has set a new OHC record, showing that heat has continued to accumulate in the Earth system as concentrations of atmospheric greenhouse gases have increased.
Fifth or sixth warmest year on the surface
Global surface temperatures in 2022 were among the warmest measured since records began in the mid-1800s. Data from NASA, NOAA and the Met Office Hadley Centre/University of East Anglia’s (UEA) HadCRUT5 records show that 2022 was the sixth warmest year on record, while data from Berkeley Earth, Copernicus ERA5, JRA-55, and AIRS satellite data show it as the fifth warmest. In most cases differences between these group’s rankings are small and within the range of measurement uncertainty.
The figure below shows global surface temperature records from the principal research groups around the world since 1970. These are created by combining ship- and buoy-based measurements of ocean sea surface temperatures with temperature readings of the surface air temperature from weather stations on land. Temperatures are shown as anomalies relative to a 1981-2010 average; note that the 1981-2010 period is around 0.6 to 0.8C warmer than the 1880-99 pre-industrial period across the different groups.
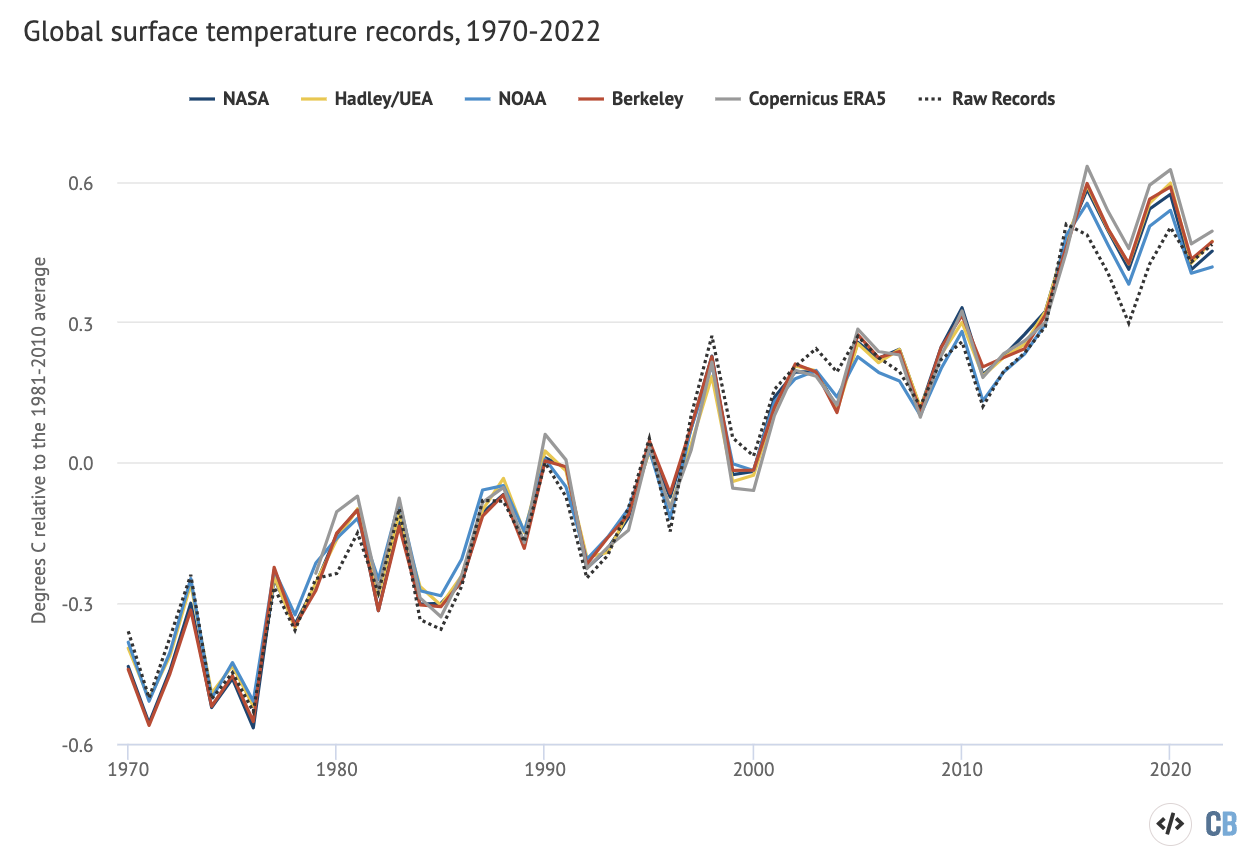
The global warming seen is not due to any adjustments made to the underlying temperature records. The figure above includes a “raw records” line (shown as a dotted line) calculated by Carbon Brief using data not subject to any adjustments or corrections for changes in measurement techniques. These adjustments only modestly affect the record after 1950. Before then, the adjusted temperature records actually show less warming than the raw data.
Global surface temperature records can be calculated back to 1850, though some groups choose to start their records in 1880 when more data was available. Prior to 1850, records exist for some specific regions, but are not sufficiently widespread to calculate global temperatures with high accuracy (though work is ongoing to identify and digitise additional records to extend these further back in time). These longer surface temperature records are created by combining ship- and buoy-based measurements of ocean sea surface temperatures with temperature readings of the surface air temperature from weather stations on land (Copernicus ERA5 and JRA-55 are an exception, as they use weather model-based reanalysis to combine lots of different data sources over time).
The chart below shows global temperature records since 1850, with temperatures shown relative to the 1880-99 period to highlight warming since the pre-industrial period.
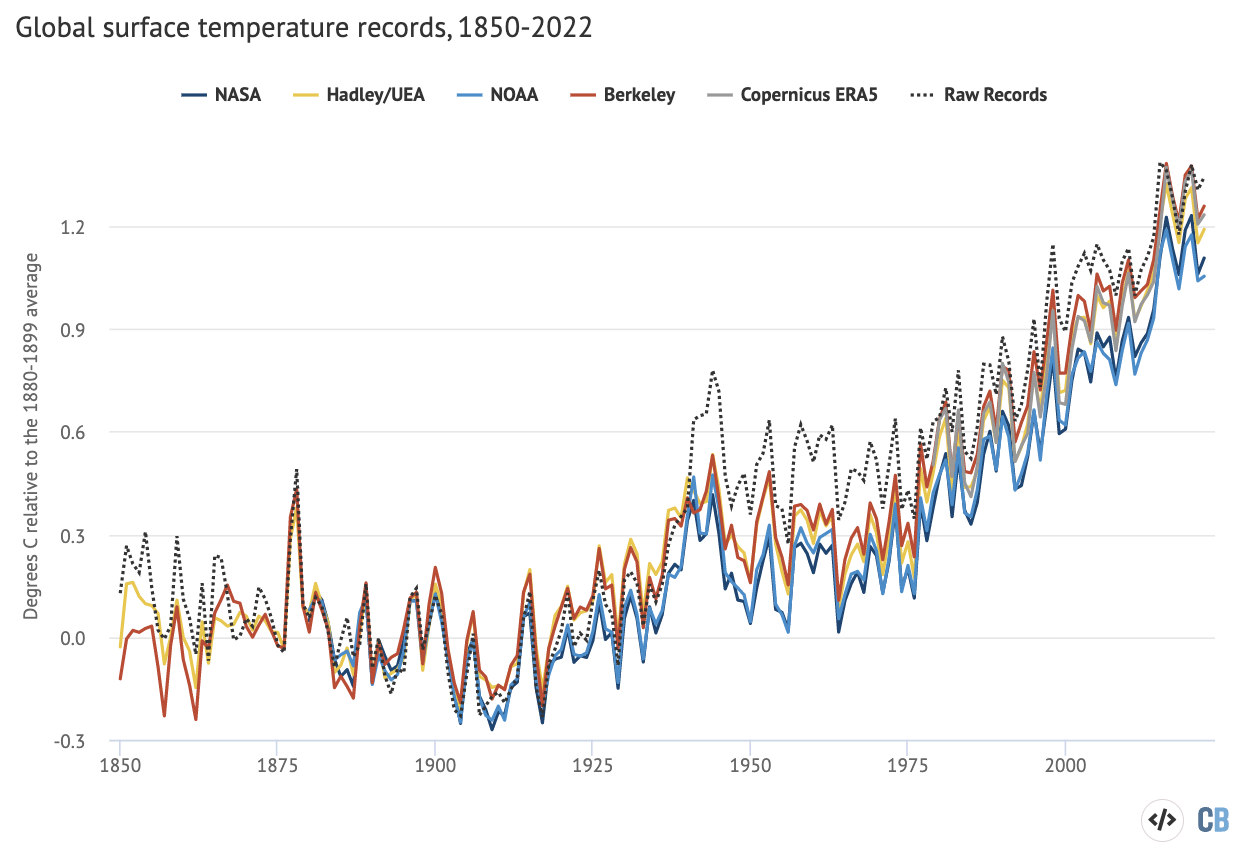
Temperatures in 2022 were between 1.1C and 1.3C warmer than temperatures in the late 19th century (between 1880 and 1899), depending on the temperature record chosen. Last year represented between the eighth (NOAA and NASA) and 14th (Berkeley Earth) consecutive year that global temperatures have exceeded 1C above pre-industrial levels across the different datasets.
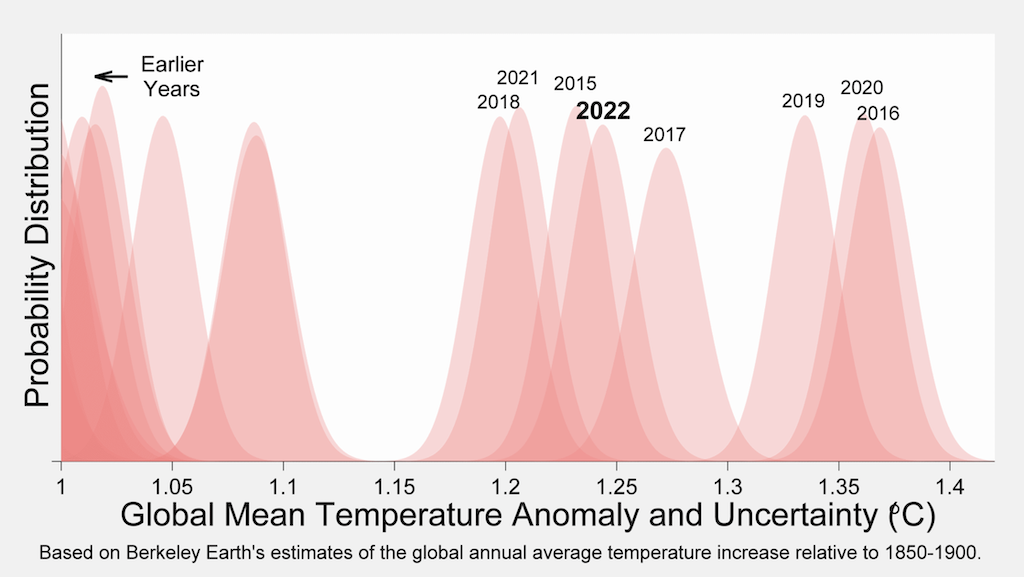
The past eight years of the record really stand out as much warmer than anything that has come before. This can be seen in the figure below from Berkeley Earth. Each shaded curve represents the annual average temperature for that year. The further that curve is to the right, the warmer it was.
The width of each year’s curve reflects the uncertainty in the annual temperature values (caused by factors such as changes in measurement techniques and the fact that some parts of the world have fewer measurement locations than others).
Second warmest year on record when La Niña is removed
Year-to-year variability in temperature records is mostly due to the influence of El Niño and La Niña events, which have a short-term warming or cooling impact on the climate. Other dips are associated with large volcanic eruptions. The longer-term warming of the climate is due to increases in atmospheric CO2 and other greenhouse gases emitted from human activity.
Last year’s temperatures were dragged down a bit by a moderately strong La Niña event during the year, which strengthened in the second half of 2022 of the year (creating a relatively rare “triple dip” La Niña event). Due to a lag of a few months between La Niña conditions in the Pacific and their peak effect on global temperatures, La Niña conditions – projected to persist into the first quarter of 2023 – will contribute to lower temperatures this year than would have otherwise occurred.
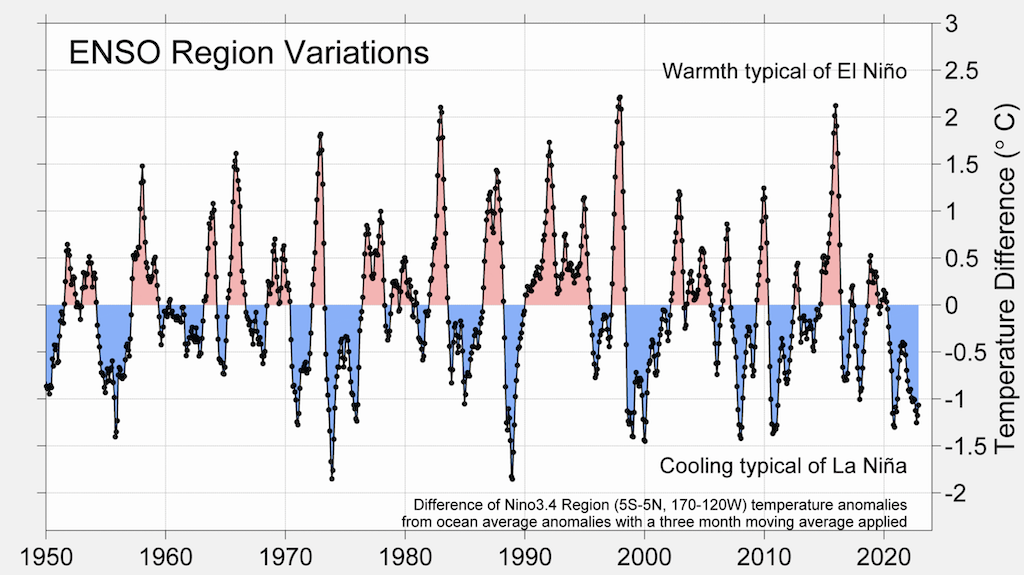
The figure below shows the El Niño (red shading) and La Niña (blue) conditions over the past 70 years (collectively referred to as the El Niño-Southern Oscillation, or “ENSO”). While not unprecedented, the extended La Niña conditions since the latter part of 2020 have extended for an unusually long period of time.
To assess the effects of El Niño and La Niña on the surface temperature record, Carbon Brief has produced an estimate of what temperatures would be in the absence of these events. The figure below shows the published Berkeley Earth temperature record compared to Carbon Brief’s estimate without El Niño or La Niña events.
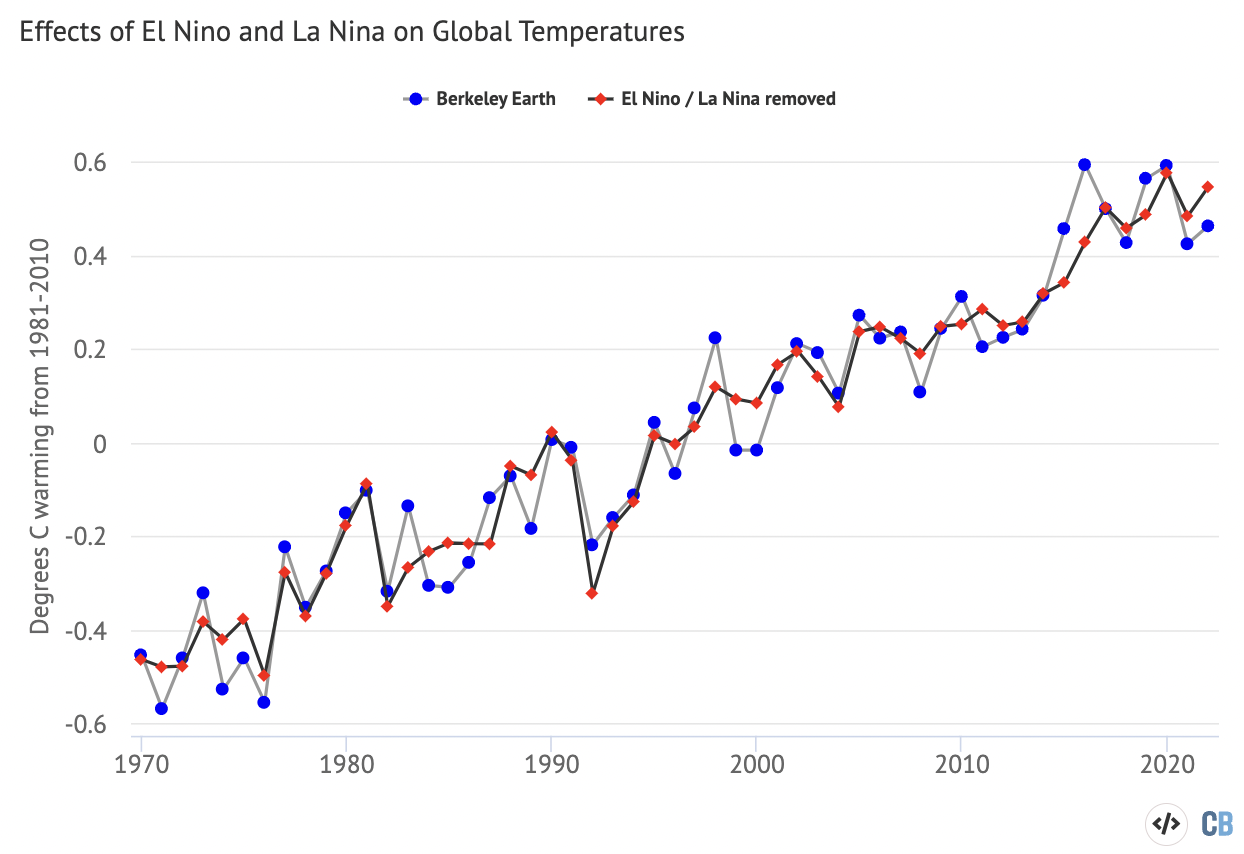
Removing the effects of El Niño and La Niña from the temperature record would make 2022 the second warmest year on record. (Dr Gavin Schmidt at NASA GISS finds a similar result). It would also result in 2020 being the warmest year on record, rather than 2016, as 2016 temperatures were boosted by a large El Niño event.
Removing ENSO effects also results in a clear warming trend over the past eight years, showing that the apparently flat temperatures over the period is largely the result of a strong El Niño (2015 and 2016) followed by a persistent La Niña (2021 and 2022).
Once El Niño effects are removed, the cooling impact of major volcanic eruptions – such as those in 1982 and 1991 – are also much easier to spot in the temperature record.
Rapid warming for the world’s land regions
The focus on global surface temperature as a key metric of climate change is important, but it can obscure very different rates of change across the planet.
For example, while most of the Earth’s surface is covered by oceans, nearly all human settlements and activities are in land areas. The land has been warming around 70% faster than the oceans – and 40% faster than the global average – in the years since 1970.
The figure below breaks down the Berkeley Earth temperature dataset into land-only (red) and ocean-only (blue) temperatures.
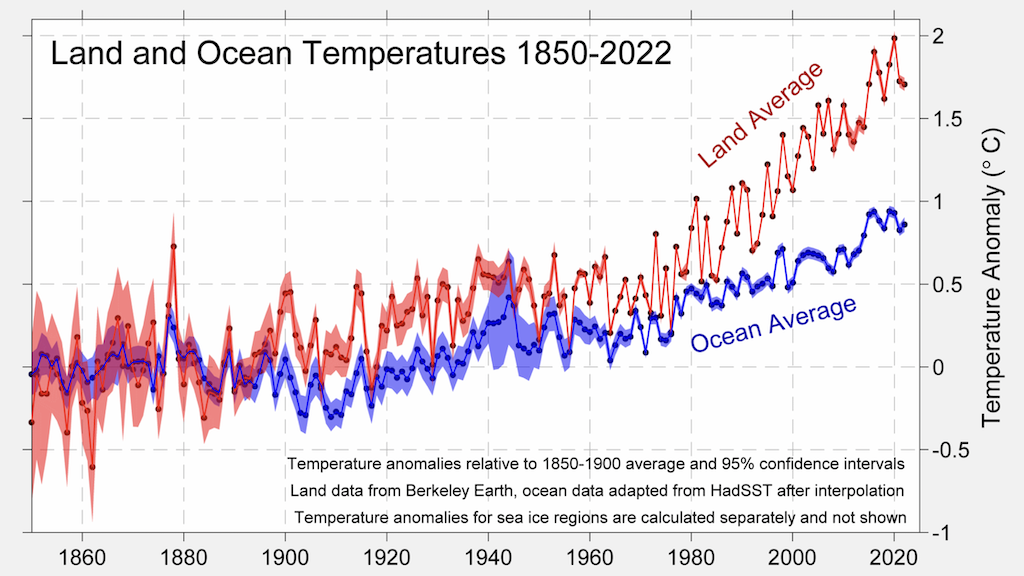
While the world as a whole has warmed by around 1.3C since the pre-industrial period (1850-1900) in the Berkeley Earth dataset, land areas have warmed a much larger amount – by 1.8C on average. In contrast, the oceans have warmed more slowly – by around 0.8C since pre-industrial times. (See Carbon Brief’s guest post on why the land and ocean warm at different rates.)
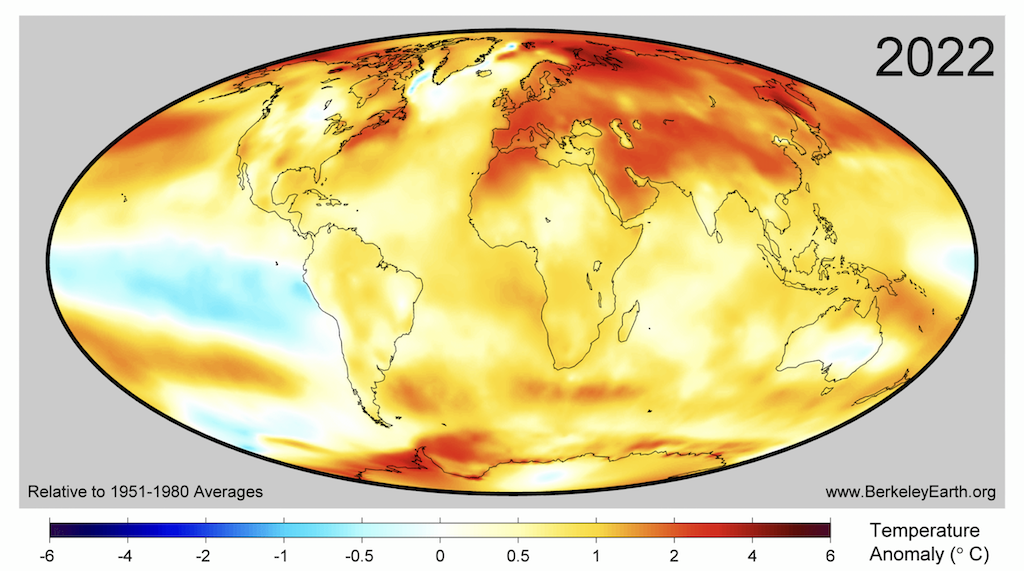
Different parts of the land and ocean are also warming at different rates. The warmth in 2022 covered large regions of the world, with particularly anomalously high temperatures over Europe, China, the Middle East and parts of the Arctic, and relatively cool temperatures over the tropical Pacific due to La Niña conditions. The figure below, from Berkeley Earth, shows the average annual temperatures, relative to 1951-80, across the world for the year.
A year of climate extremes
In addition to being the fifth or sixth warmest year on record for the surface and setting a new record for ocean heat content, 2022 saw many climate extremes around the world. These include record-breaking extreme heat events in the UK and Europe, China, India and Pakistan and South America, and catastrophic flooding in Pakistan, Brazil, West Africa and South Africa.
In all of these cases, scientists working with the World Weather Attribution team have found that these extremes were made worse by human-driven climate change. At the same time, researchers found more limited evidence of the role of climate change in worsening droughts in both Madagascar and the Sahel region of Africa.
In 2022, 28 countries saw their warmest year on record according to Berkeley Earth. This includes Afghanistan, Andorra, Belgium, Bosnia and Herzegovina, China, Croatia, Fiji, France, Germany, Ireland, Italy, Kyrgyzstan, Liechtenstein, Luxembourg, Malta, Monaco, Morocco, New Zealand, Papua New Guinea, Portugal, San Marino, Spain, Switzerland, the UK, Tajikistan, Tonga, Tunisia and Vanuatu.
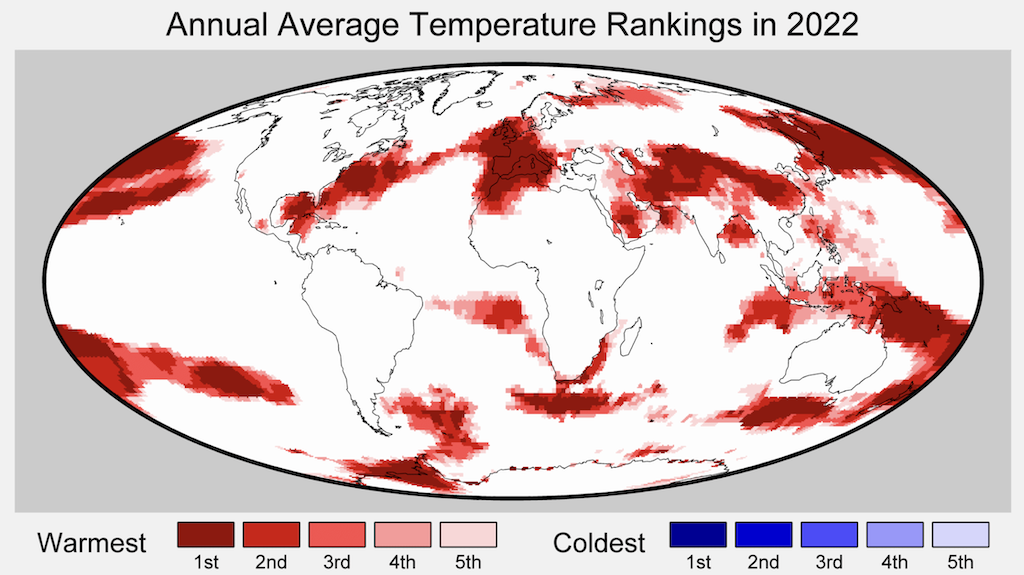
Areas home to 850 million people saw their warmest year on record during 2022, while there was no location on Earth where annual average temperatures were among the coldest on record. The figure below, also from Berkeley Earth, shows the regions of the world where either warm (red shading) or cold (blue) records were set in 2022.
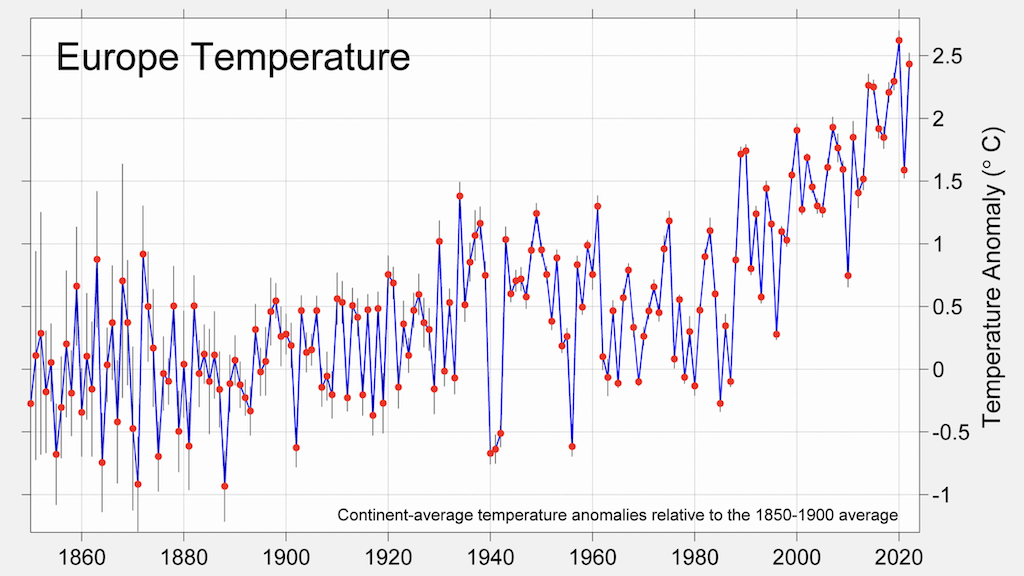
While most of western Europe and parts of north-west Africa saw their warmest year on record, Europe as a whole only recorded its second-warmest year, slightly below the record set in 2020. However, 2022 was still nearly 2.5C warmer than pre-industrial levels for the region, as shown in the figure below.
The July heatwave in the UK and Europe was particularly notable, shattering records in many countries. On 19 July, UK temperatures surpassed 40C for the first time on record, reaching 40.3C. This far exceeded the previous high of 38.7C set in 2019. The figure below shows the new record at the Coningsby Royal Air Force station in Lincolnshire, compared to all the prior hourly temperature measurements at that location since 1973, and demonstrates just how anomalously warm it was.
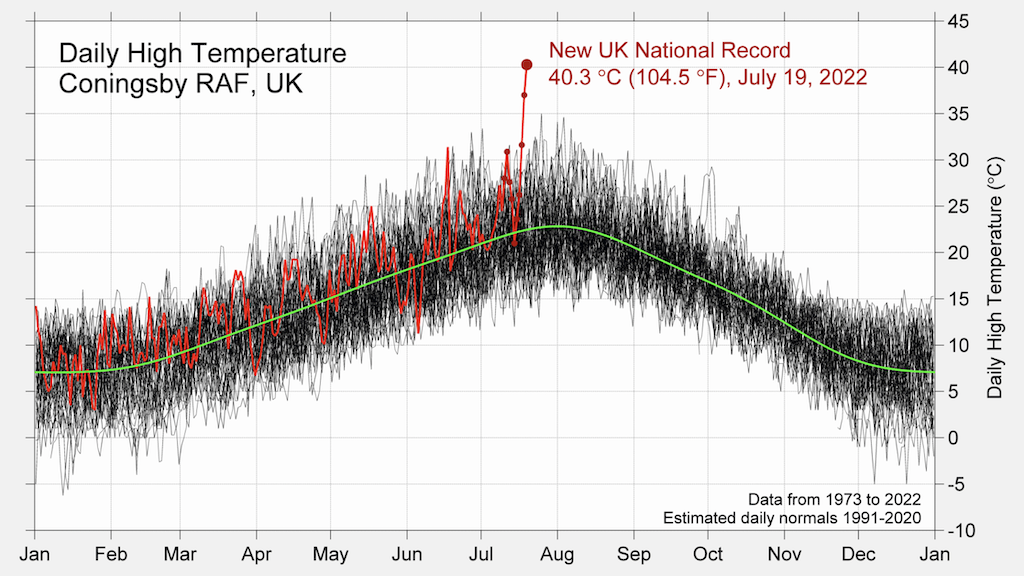
Researchers at World Weather Attribution found that the extreme heat in the UK was made at least 10 times more likely due to human-caused climate change experienced to-date.
Antarctica also experienced an exceptional climate event in early 2022. An atmospheric river on 18 March brought unusually warm air into Antarctica, and briefly pushed temperatures at the Vostok station 38.5C above the normal levels. This is likely the largest deviation above a climate normal ever recorded at a station, though there has not been any link established between this particular event and climate change.
Temperatures in-line with climate model projections
Climate models provide physics-based estimates of future warming given different assumptions about future emissions, greenhouse gas concentrations and other climate-influencing factors.
Here, Carbon Brief examines a collection of climate models – known as CMIP5 – used in the 2013 fifth assessment report (AR5) from the Intergovernmental Panel on Climate Change (IPCC). In CMIP5, model estimates of temperatures prior to 2005 are a “hindcast” using known past climate influences, while temperatures projected after 2005 are a “forecast” based on an estimate of how things might change.
The figure below shows the range of individual CMIP5 models projections since 1950, as well as future projections through to 2100 under the middle-of-the-road RCP4.5 emissions scenario. The black line shows the average of 38 different models, while the grey area shows the 95% (two standard deviation) range of the model projections. Observational temperatures are plotted on top of the climate model data, with individual observational records represented by coloured lines.
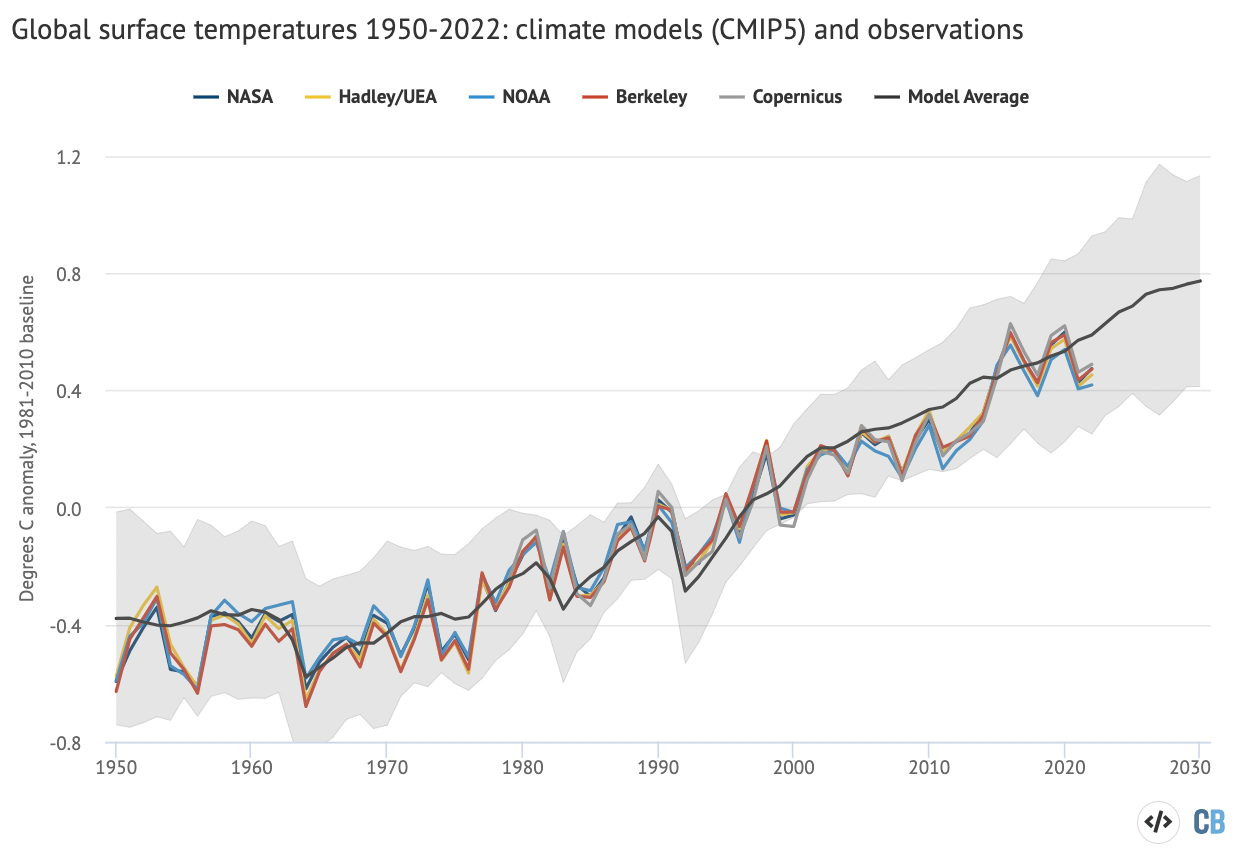
Observations fall well within the range of CMIP5 climate model projections over the past 70 years. Temperatures in 2022 are slightly below the model average (as the average of all the models effectively averages out short-term variability from El Niño and La Niña events).
The climate model outputs shown here are blended – that is, they combine surface air temperature over the land with sea surface temperatures over the ocean in the same way they are measured in the observational climate record. This allows for a more accurate comparison of the two.
The latest generation of models – CMIP6 – are not compared to observations in this state of the climate report. The most recent report from the IPCC’s sixth assessment report (AR6) has changed the way that the collection of models is used. Rather than simply taking the average of all the models (and their range) – as was the case in previous IPCC reports – the IPCC decided to use a weighted subset of models that agreed well with historical observations. This also reflected a narrowing of climate sensitivity in the most recent IPCC report – such that a number of new models fall outside the “very likely” sensitivity range.
While the IPCC AR6 provided a new set of future “assessed warming” projections, these start in the year 2015, which makes comparisons with observations over such a short period not very informative.
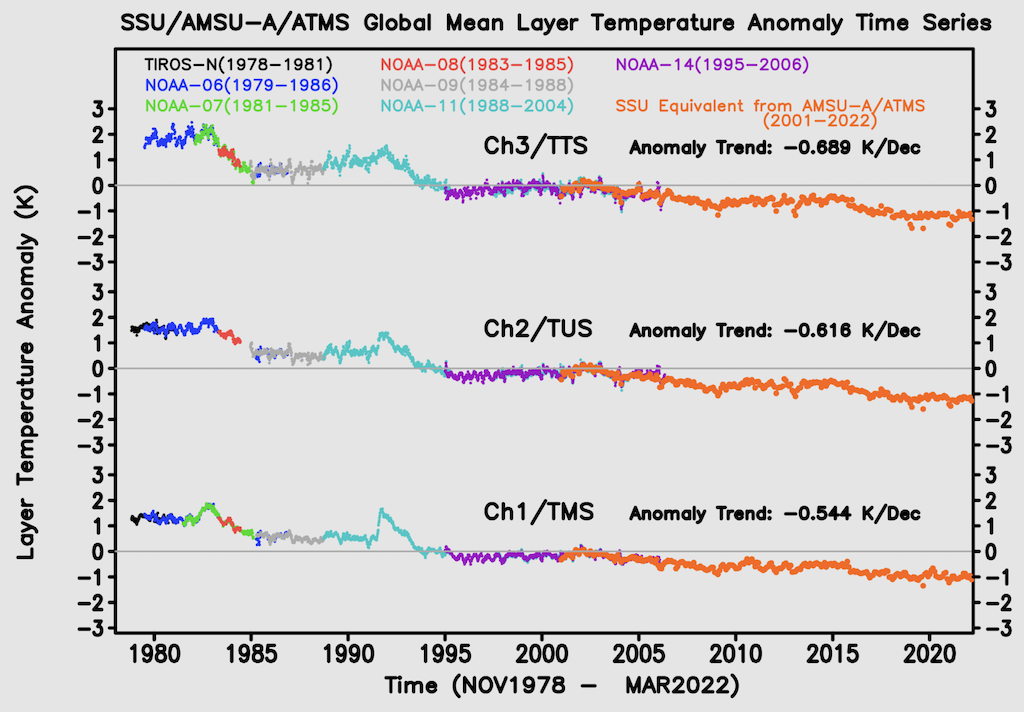
Warming troposphere and cooling stratosphere
In addition to surface measurements over the world’s land and oceans, satellite microwave sounding units have been providing estimates of temperatures at various layers of the atmosphere since 1979.
The lowest layer they estimate – the lower troposphere – reflects temperatures a few kilometres above the surface and shows a pattern of warming similar (though not identical) to surface temperature changes. The record produced by Remote Sensing Systems (RSS) shows 2022 as the eighth warmest year on record in the lower troposphere, while the record from the University of Alabama, Huntsville (UAH) shows it as the seventh warmest. The chart below shows the two records – RSS in red and UAH in blue – for the lower troposphere (TLT).
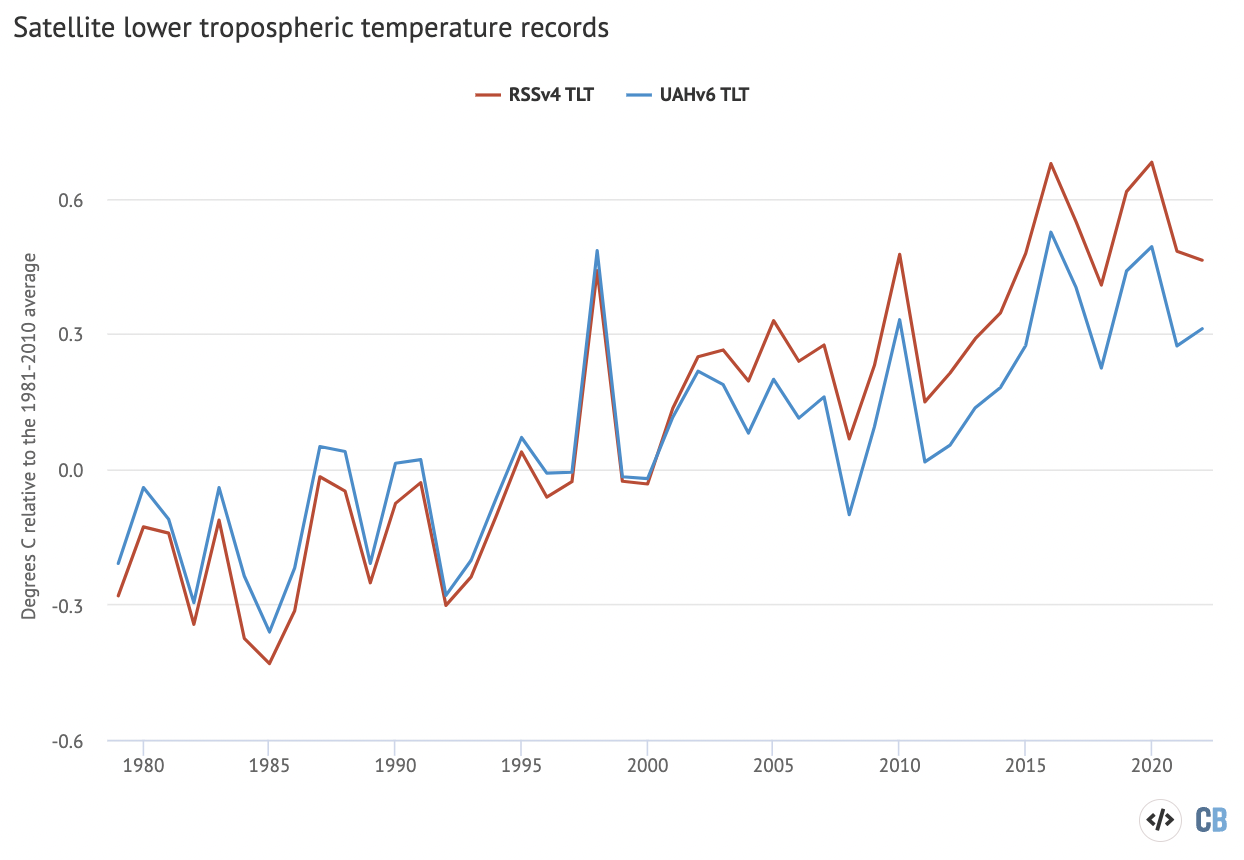
The lower troposphere tends to be influenced more strongly by El Niño and La Niña events than the surface. Therefore, satellite records show correspondingly larger warming or cooling spikes during these events. This is why, for example, 1998 shows up as one of the warmest years in satellites, but not in surface records.
The two lower-tropospheric temperature records show large differences after the early 2000s. RSS shows an overall rate of warming quite similar to surface temperature records, while UAH shows considerably slower warming in recent years than has been observed on the surface. Both have seen large adjustments in recent years that have warmed RSS and cooled UAH compared to prior versions of each record.
Overall, there is more agreement with RSS to other records that include satellite data (such as reanalysis products like ERA5 and JRA-55, as well as the shorter AIRS satellite-based surface temperature record), while the UAH record is a bit of an outlier compared to the others.
In addition to a temperature record of the lower troposphere, RSS and UAH also provide measurements of the lower stratosphere – a region of the upper atmosphere around 18km above the surface. The figure below shows lower stratospheric temperatures (TLS) records for both RSS (red) and UAH (blue) from 1979 through 2022.
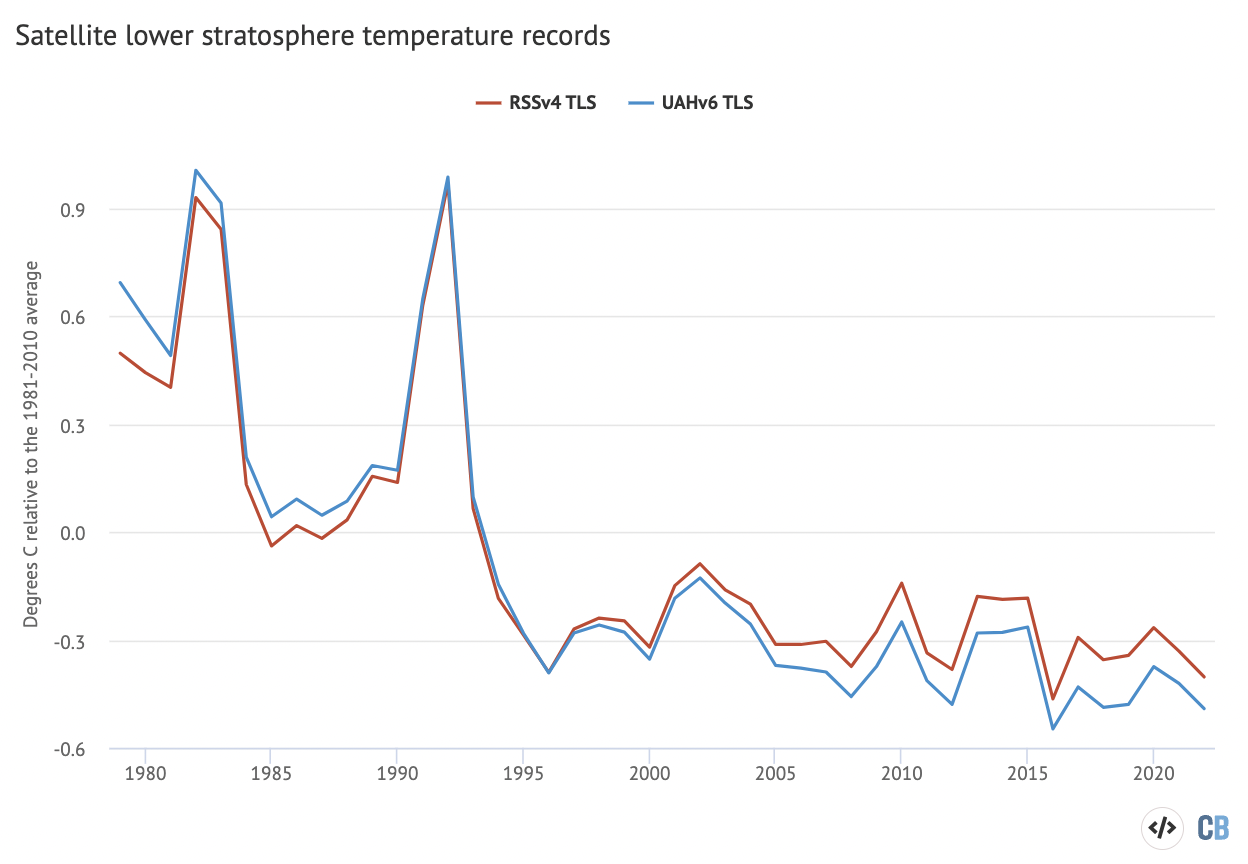
The stratosphere has been cooling for the last few decades in a clear fingerprint of human greenhouse gases, which warm the lower part of the atmosphere by trapping heat while cooling the upper atmosphere as less heat escapes. If other factors – such as changing solar output – were causing climate change, both the stratosphere and troposphere would be warming.
The lower stratosphere is affected by a number of factors in addition to greenhouse gases – including volcanic eruptions and ozone depletion. These play a smaller role in influencing the upper stratosphere, where the cooling trend due to greenhouse gases trapping heat in the lower parts of the atmosphere shows up even more clearly. This is illustrated in the chart below, which shows satellite temperature measurements at the top of the stratosphere (top line), in the upper stratosphere (middle) and lower stratosphere (bottom).
Accelerating sea level rise
Modern-day sea levels have risen to a new high, due to a combination of melting land ice (such as glaciers and ice sheets), the thermal expansion of water as it warms, and changes in land water storage. In recent years, there have been larger contributions to sea level rise from melting ice sheets and glaciers, as warmer temperatures accelerate ice sheet losses in Greenland and Antarctica.
Since the early 1990s, the increase in global sea level has been estimated using altimeter data from satellites. Earlier global sea levels have been reconstructed from a network of global tide gauge measurements. This allows researchers to estimate how sea level has changed since the late 1800s.
The chart below shows five different modern sea level rise datasets (coloured lines), along with satellite altimeter measurements from NASA satellites as assessed by the University of Colorado (in black) after 1993. (As sea level rise data has not yet been released for the whole year, the 2022 value is estimated based on data through October.)
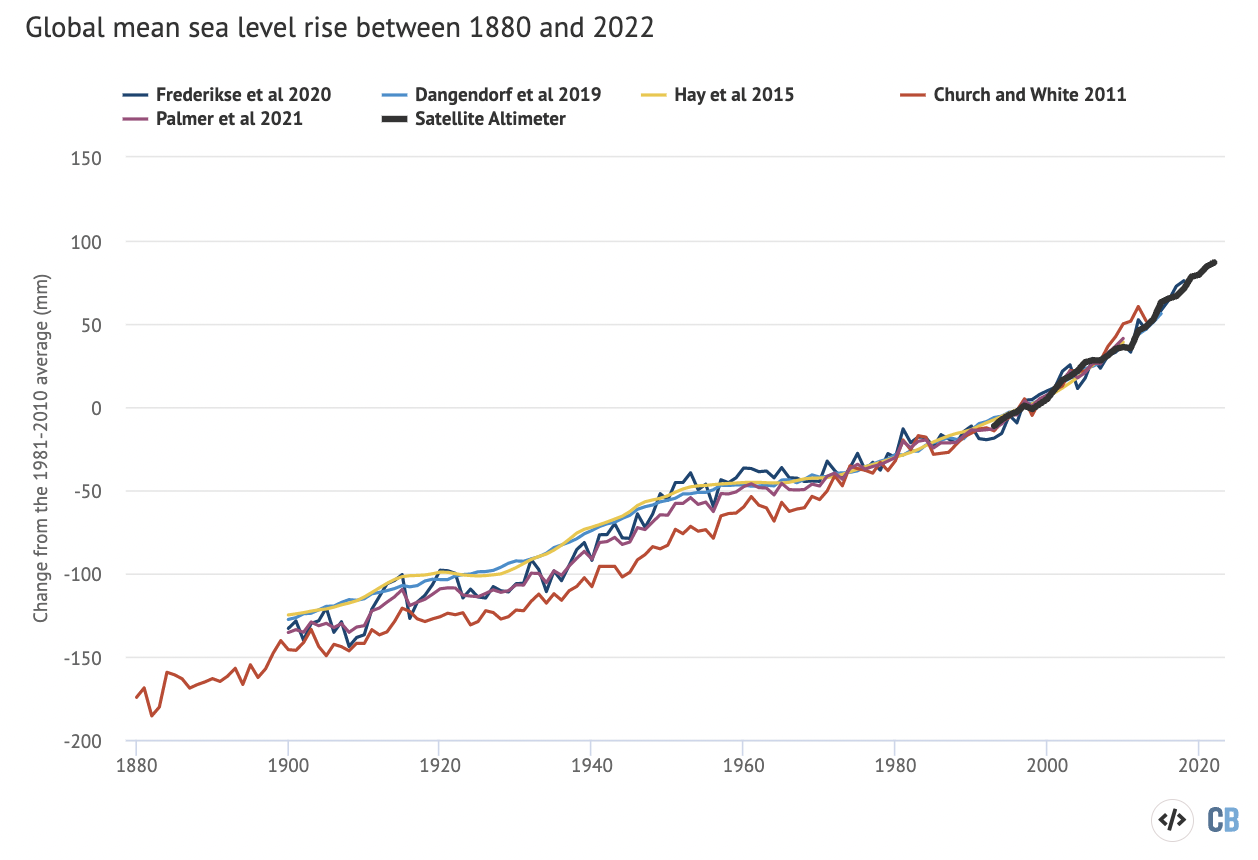
Sea levels have risen by around 0.2 metres (200mm) since 1900. While sea level rise estimates mostly agree in recent decades, larger divergences are evident before 1980. There is also evidence of accelerating sea level rise over the post-1993 period when high-quality satellite altimetry data is available. (See Carbon Brief’s explainer on how climate change is accelerating sea level rise.)
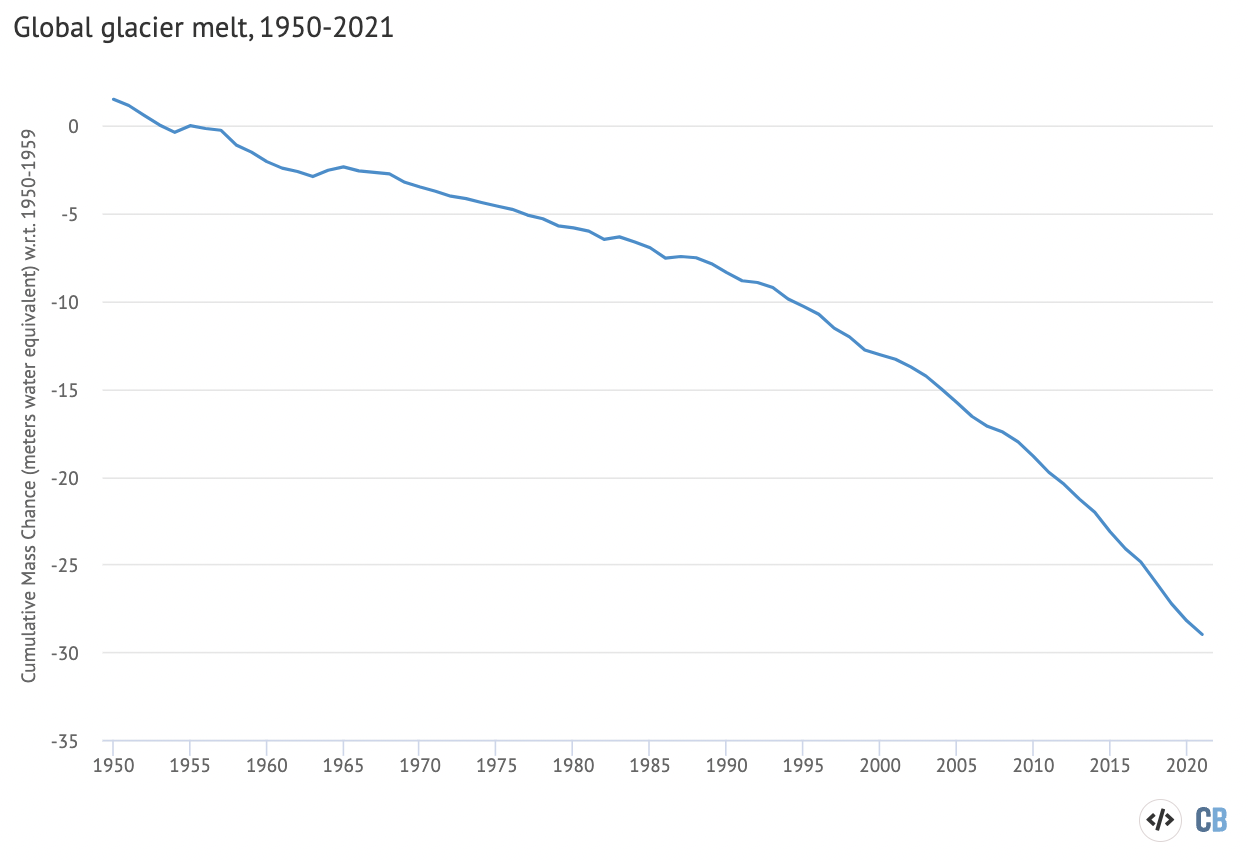
A portion of this sea level rise is being driven by melting land glaciers. Scientists measure the mass of glaciers around the world using a variety of remote-sensing techniques, as well as through GRACE measurements of the Earth’s gravitational field. The balance between snow falling on a glacier and ice loss through melting and the breaking off – or “calving” – of icebergs determines if glaciers grow or shrink over time.
An international consortium called the World Glacier Monitoring Service tracks 164 different glaciers in 19 different regions around the world. The figure below shows the change in global average glacier mass from 1950 through to the end of 2021 (2022 values are not yet available). Note that glacier melt is reported in metres of water equivalent, which is a measure of how much mass has been lost on average.
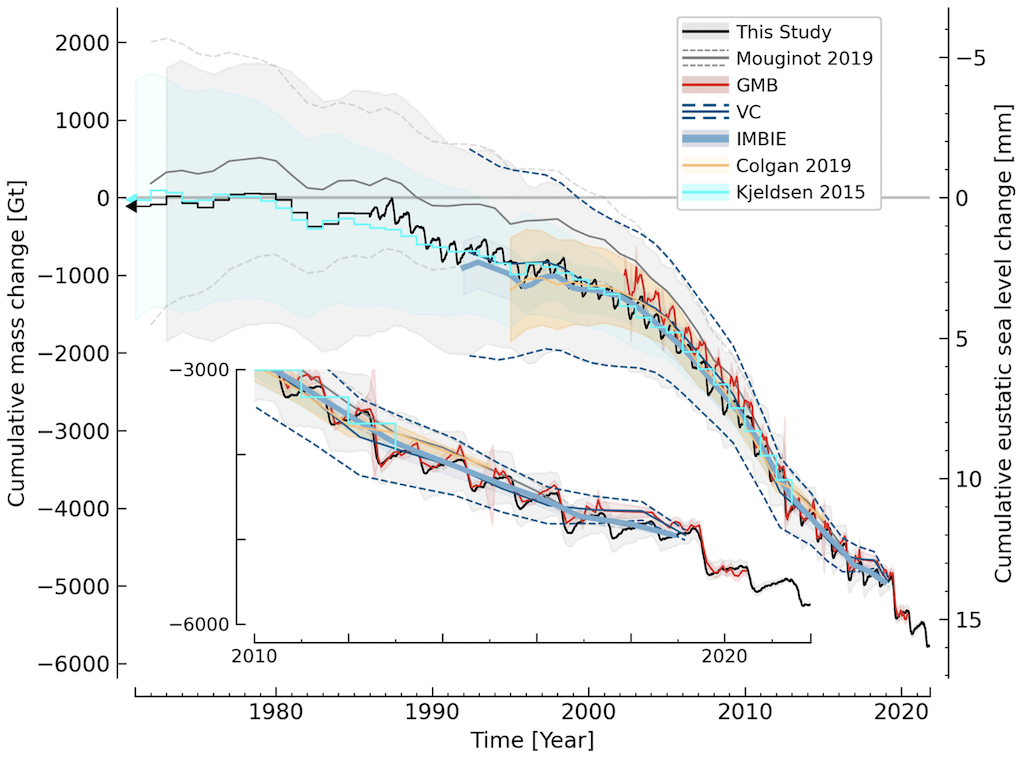
Greenland ice sheets have become a larger contributor to sea level rise in recent years due to accelerating loss of mass. The year 2022 was the 26th in a row where Greenland lost ice overall, with 84Gt of ice lost over the 12 months from September 2021 to August 2022. Greenland last saw an annual net gain of ice in 1996.
The figure below, from a study published in late 2021, shows the cumulative mass balance change – that is, the net ice loss – from Greenland between 1970 and October 2021. The different coloured lines indicate estimates from different studies. The authors find that Greenland has lost around 6 trillion metric tons of ice over that period, or more than 700 tons lost per person for every person on the planet.
Atmospheric greenhouse gases concentrations reach new highs
Greenhouse gas concentrations reached a new high in 2022, driven by human emissions from fossil fuels, land use and agriculture.
Three greenhouse gases – CO2, methane (CH4) and nitrous oxide (N2O) – are responsible for the bulk of additional heat trapped by human activities. CO2 is by far the largest factor, accounting for roughly 42% of the increase in global surface temperatures since the pre-industrial era (1850-1900).
Methane accounts for 28%, while nitrous oxide accounts for around 5%. The remaining 25% comes from other factors including carbon monoxide, black carbon and halocarbons, such as CFCs.
Human emissions of greenhouse gases have increased atmospheric concentrations of CO2, methane and nitrous oxide to their highest levels in at least a few million years – if not longer.
The figure below shows concentrations of these greenhouse gases – in parts per million (ppm) for CO2 (blue line) and parts per billion (ppb) for methane (orange) and nitrous oxide (red) – from the early 1980s through to October 2022 for CO2 and September 2022 for CH4 and N2O (the most recent data currently available).
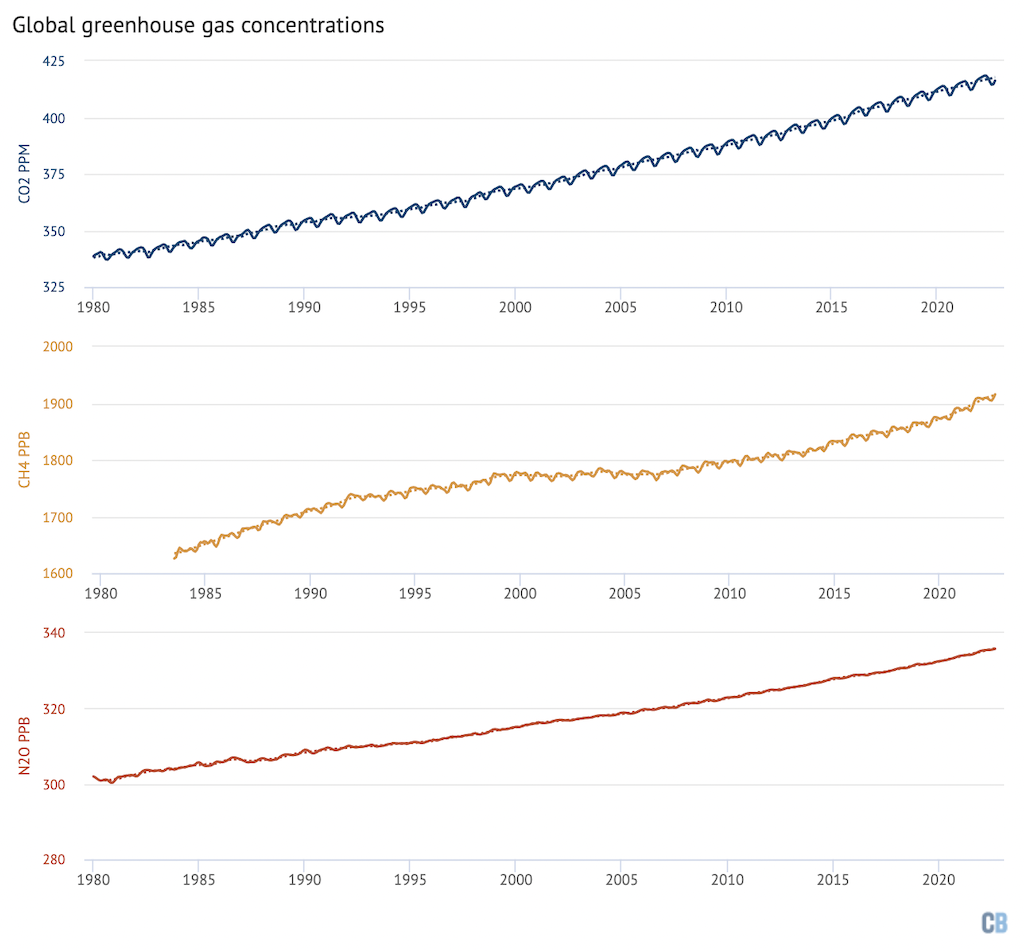
Methane concentrations in particular have seen a sharp rise over the past decade after a plateau in the 2000s. This appears to be driven by both increased emissions from agriculture and fossil fuels, in roughly equal measure.
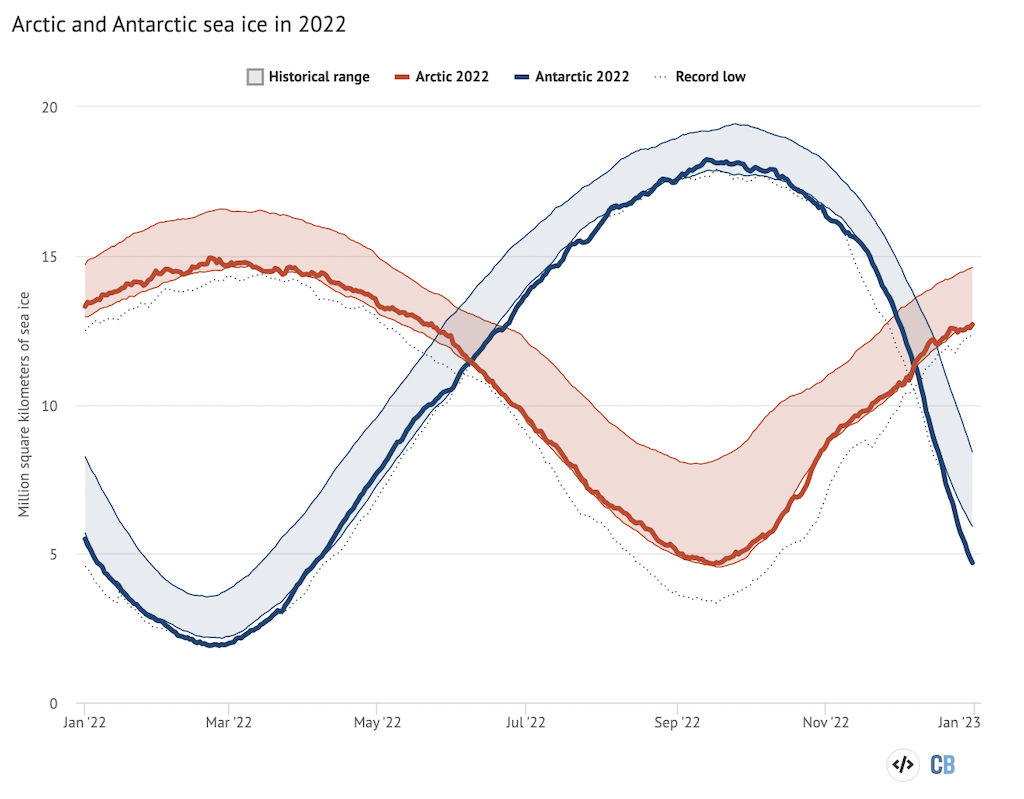
Arctic and Antarctic sea ice
Arctic sea ice was at the low end of the historical (1979-2010) range for most of 2022, but did not set any new all-time low records. The summer minimum extent – the lowest recorded level for the year – was the joint-10th smallest since records began in the late 1970s.
Antarctic sea ice, on the other hand, saw new record low levels for much of the year, including February through April, June through August, late October and December. Unlike the Arctic, the long-term trend in sea ice extent in Antarctica is less clear. There is an active debate in the community about the relative role of climate change versus natural variability in the record lows experienced over the past two years, though it is clear that warming is driving at least some of the recent decline.
The figure below shows both Arctic (red line) and Antarctic (blue line) sea ice extent for each day of the year, along with how it compares to the historical range (corresponding shading).
Looking forward to 2023 and beyond
With a “triple dip” La Niña event in the latter part of 2022, La Niña conditions are expected to persist for at least the first three months of 2023. Because there is a lag of a few months between when El Niño or La Niña conditions peak in the tropical Pacific and their impact on global temperatures, these La Niña conditions will likely have a lingering cooling influence on 2023 temperatures.
Here, Carbon Brief provides its own prediction of likely 2023 temperatures using the NASA GISTEMP dataset – and based on a model using the year, temperatures over past three months, and projections of El Niño/La Niña conditions over the next six months. The figure below shows the Carbon Brief prediction in yellow, along with its 95% confidence interval (black bars) and the historical NASA GISTEMP record (grey dots).
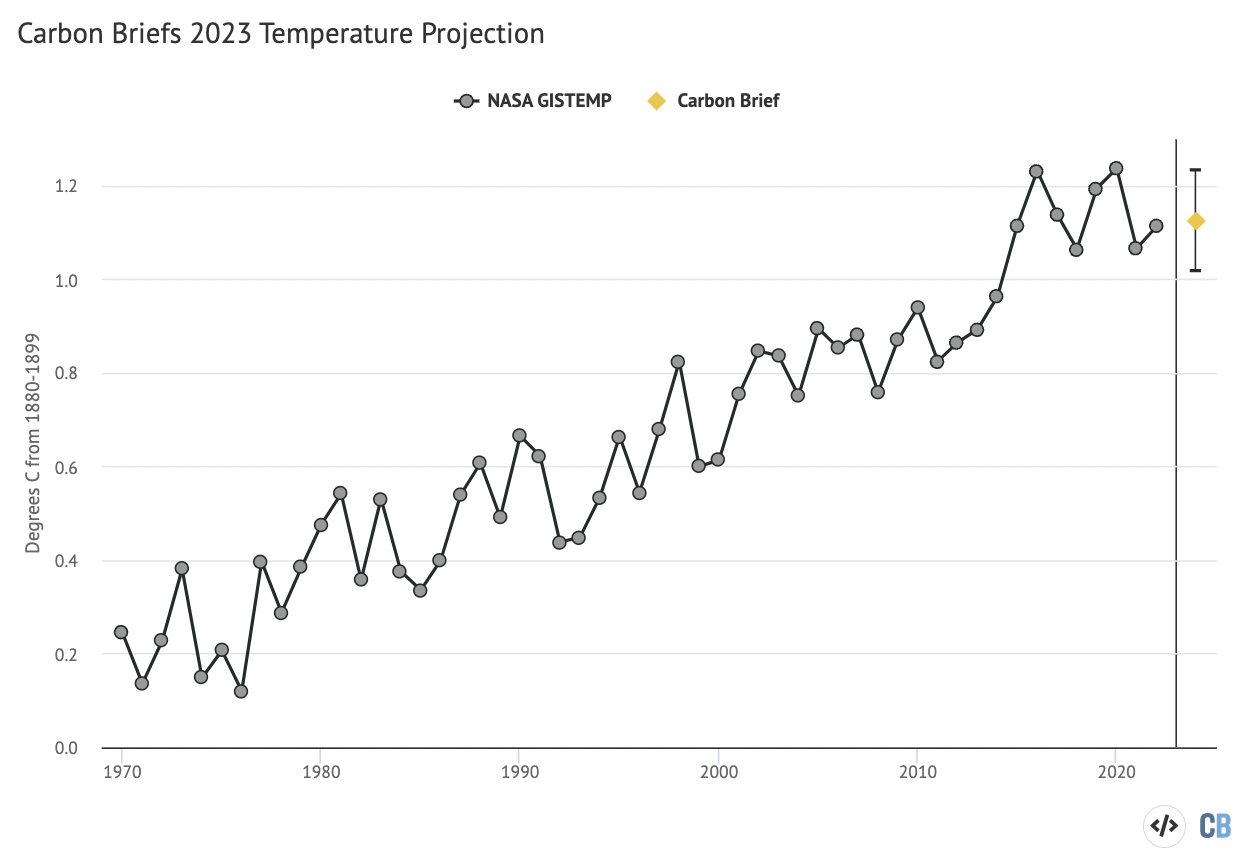
While the uncertainties are still wide at this point, we find that 2023 is very likely to be between the third and ninth warmest year on record, with a best estimate of being the fifth warmest on record – similar to 2022. If an El Niño event develops in late 2023, however, it will make it likely that 2024 will set a new record.
There have been three other published predictions – from the UK Met Office, NASA’s Dr Gavin Schmidt and Berkeley Earth – of what temperatures might look like in 2023. The figure below shows the four different 2023 predictions compared to the NASA GISTEMP temperature record. These have been “normalised” to show 2023 warming relative to the 2001-20 period in the NASA dataset. This is to remove any differences in predictions due to divergences between datasets in earlier parts of the temperature record.
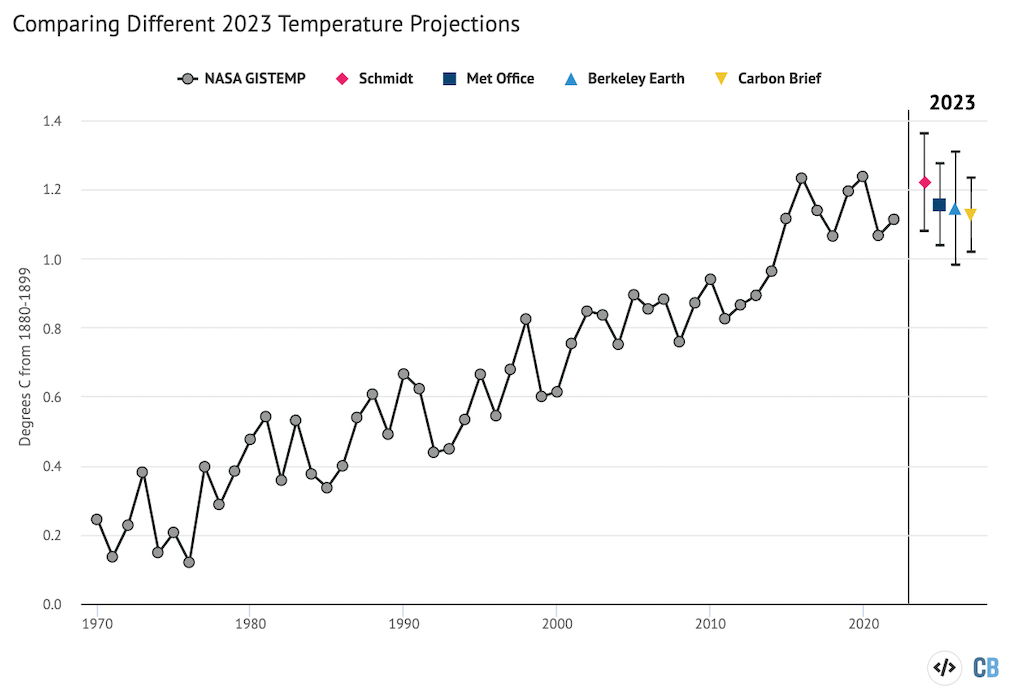
While the Met Office, Berkeley Earth and Carbon Brief estimates all have 2023 as similar (albeit a tad warmer) to 2022, with a relatively small chance of setting a new record, Dr Schmidt predicts that 2023 has a real chance of tying with 2016 and 2020 as the warmest year on record. It is worth noting that the Berkeley Earth projection ended up being the most accurate last year in predicting 2022 temperatures.
However, what matters for the climate is not the leaderboard of individual years. Rather, it is the long-term upward trend in global temperatures driven by human emissions of greenhouse gases. Until the world reduces emissions down to net-zero, the planet will continue to warm.
It is almost certain that the next time the world sees a moderate to strong El Niño event, that year will set a new all-time temperature record.
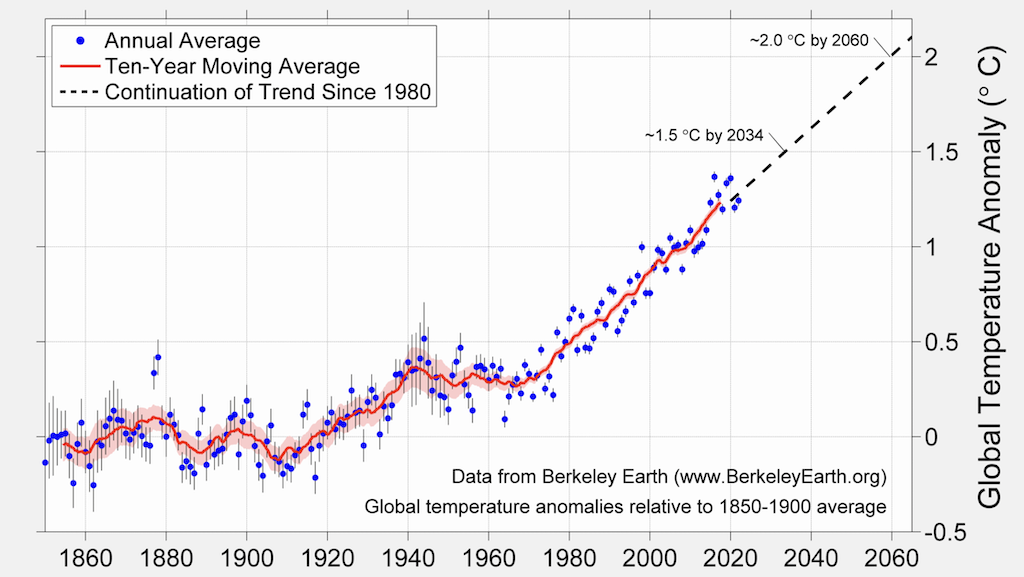
Similarly, as the chart below highlights, if the warming trend over the past 40 years continues, average surface temperatures are likely to pass 1.5C in the mid-2030s and 2C by around 2060.